Evaluating the Potentials of Educational Systems to Advance Implementing Multimedia Technologies

Author: Zoran Kotevski, Ivana Tasevska
Journal: International Journal of Modern Education and Computer Science (IJMECS) @ijmecs
Article in issue: 1 vol.9, 2017.
Free access
Implementing multimedia in education has proven to be quite beneficial to the educational processes by enhancing the students' cognitive abilities, accelerating of memorization and learning, and easing the understanding of abstract entities. But, for an educational system, whether it is a single institution, regional system, or even a state level system, the information that multimedia technologies provide enhancements to the educational processes is not sufficient to achieve the acclaimed advancements. To improve learning by implementing multimedia, decisions about actions and investments should be based on a specific analysis of the current condition of the educational system. In this manner, this research presents an evaluation methodology that supports the purposes of strategic planning and investments in education, in the context of advancements implementing multimedia. The methodology takes into account three key aspects: i) multimedia equipment and IT resources, ii) teachers' competencies and their interest in adding multimedia to their lectures, and iii) promotional events about using multimedia in education. As a case study, a segment of the educational system in a municipality in R. Macedonia was evaluated, where the results showed the system's strong and weak aspects, giving a profound direction in which the future enhancement efforts should be conducted.
Multimedia in education, evaluation methodology, improving classroom teaching, management decision support
Short address: https://sciup.org/15014935
IDR: 15014935
Text of the scientific article Evaluating the Potentials of Educational Systems to Advance Implementing Multimedia Technologies
Published Online January 2017 in MECS DOI: 10.5815/ijmecs.2017.01.03
Educational systems employ an ongoing effort for advancement in order to enhance their educational processes and more effectively transfer the knowledge to their students. In the last couple of decades, the explosive development of Internet and multimedia technologies brought vast possibilities to implement these new paradigms with an aim to improve students’ learning and more easily augment their knowledge. Worldwide research activities in the field of practicing multimedia in education have proven that implementing multimedia renders enhancements in learning in many different ways, such as promotion of the students’ cognitive abilities, acceleration of memorization and learning and alleviation of understanding of abstract, micro and macro entities.
But, from a higher perspective of an educational system, the information that multimedia can bring enhancement to the learning processes is not sufficient to achieve the intended advancements. For this purpose, to evaluate the conditions and potentials of an educational system to advance, there are several key questions that need to be answered, such as: Is the educational system properly equipped concerning hardware resources ? Are the teachers interested to present their lecture content using multimedia ? Does the educational system organize events in order to promote the usage of multimedia technologies ?
In order to answer the aforementioned questions, this research presents an evaluation methodology that supports the purposes of strategic planning and investments in educational systems, in the context of learning enhancement by the implementation of multimedia technologies and, to the best of our knowledge, this is the first effort to realize such research. The performed evaluation is based on an anonymous survey conducted in a segment of the educational system in a municipality in R. Macedonia. The first intention was to evaluate the complete secondary education in the country, but the lack of financial support prevented us to realize this objective. Nevertheless, we believe that the developed methodology in this research is a solid foundation to determine the weakest elements of any educational system or system level (regardless of whether it is a single institution or a composite system), and provides directions for future decisions, efforts and investments, on the course of improvement of education by implementing multimedia technologies.
The rest of this paper is organized as follows. Section 2 presents the related work and explains the main motivating factors to realize this research. Section 3 describes the methodology for evaluation of educational systems, depicting the key aspects and indicators that portray that system’s state in the given context. Section 4 presents an evaluation case study of segment of the educational system in a municipality in R Macedonia. The given example shows that the evaluation provides adequate results and a solid platform on which future decisions could be based on. Beside the presentation of the results, a discussion about all the specific implications related to the provided information is presented as well. Section 5 concludes the paper with a deduction of the most important characteristics and contributions of this research.
-
II. Motivation and related work
The implementation of multimedia in lectures has proven to be very favorable to the educational processes and provides numerous benefits for the students’ cognitive and memory abilities. For example, Lee et al. [1] as pioneers in the field of implementing multimedia in education speak about the usage of multimedia for supporting classroom instructions. Their initial results had shown that this method of instruction has a great potential in enhancing traditional teaching methods. When applied correctly, it can bring breadth and depth to the subject, render efficient use of class time, create flexibility in teaching, and, enhance students’ leaning. Mayer [2] also concluded that, under some conditions, multimedia learning can lead to substantial improvements in problem-solving transfer, and that students are better able to make sense of a scientific or mathematical explanation when they are able to hold relevant visual and verbal representations in working memory at the same time. Garcia et al. [3] showed that, in some specific case of descriptive geometry, the use of flash animations accelerates the development of the students’ spatial perception. Lin et al. [4] investigated the potential benefits of using animation, visual cueing, and their combination in a multimedia environment designed to support learners’ acquisition and retention of scientific concepts and processes, concluding that participants provided with animations retained significantly more concepts than their peers provided with static graphics. Kim et al. [5] explored the effects of gamification of learning and concluded that after some period of adaptation the learning curve is quite steeper that with regular learning. This list goes much further and similar conclusions are presented in many other researches, such as: Arcelli et al. [6], Mayer et al. [7], Lou et al. [8], Aloraini [9], Milovanovic et al. [10], Mercier et al. [11], Pérez-López et al. [12], Barra et al. [13], Surjono et al. [14], Rabah [15], Tibbitts et al. [16], Cuban et al. [17], Evans et al. [18], Gilakjani [19], Khoo [20], Schmid [21], Eysink et al. [22], Brom et al. [23], Kumar et al. [24], Kumar et al. [25], Bittman et al. [26], Mai et al. [27], Chen et al. [28], Marsono and Wu [29], Uluyol et al. [30],
Loong et al. [31], Portugal et al. [32], Adesope et al. [33], Ocepek et al. [34], Inavat et al. [35], Danielson et al. [36], Robles et al. [37], Leow et al. [38], Smith et al. [39], Mayer et al. [40], Jeong et al. [41], Auddy et al. [42], Scheiter et al. [43], Bei and Peng [44], Neo et al. [45], Park et al. [46], Kocaleva [47], Schweppe et al. [48], that undoubtedly prove the benefits gained by the implementation of multimedia technologies in education.
Taking all these benefits into account, in 2005, the Government of R. Macedonia adopted the “National program for development of education in the R. Macedonia 2005-2015” [49]. One part of this document is the “Program for development and implementation of ICT in education”, with a vision that consists of multiple goals, among which the most interesting to this research are the following:
-
a) To the year of 2015 all the teachers are obligated to use ICT technologies in the educational processes;
-
b) All the primary and secondary schools must obtain High Speed Internet connection;
-
c) To provide that no more than 15 students have access to a single computer for multimedia lectures;
-
d) To provide access to Internet educational multimedia resources until the end of 2015.
Knowing that the education is an essential pillar of any society, the Macedonian Government raised the investments and financial support of educational sector. Thus, conforming to the goals defined in [49], among other investments, the Macedonian Ministry of Education started a project to provide a computer for each student, for laboratory settings, while, similarly, later in 2014 a new project was realized to supply a tablet for each student. Hence, considering these investments, it was expected that the positive effects would inevitably follow. But, the recently published World Bank report on public expenditure for FYR Macedonia [50] revealed a rather unexpected situation. We cite several fragments from the report:
“ The quality of primary and secondary education seems to have declined ”
” In 2013, FYR Macedonia’s spending on education of 4.1 percent of GDP was the highest in the region, but its education performance indicators were below the regional average. The quality of primary and secondary education has not improved significantly over the last several years, as measured by international tests. Scores on the Trends in International Mathematics and Science Study (TIMSS) declined significantly between 1999 and 2011, and are below other European countries. ”
”The levels of skills and knowledge of Macedonian students lag behind those of students in comparable countries. For example, on PIRLS 2006, which assesses children in the fourth year of formal schooling on a range of reading comprehension strategies, fewer children reached the lowest benchmark in FYR Macedonia (55%) than all neighboring and EU countries which participated (the next lowest was 83% for Slovenia). On the TIMSS assessment, which test children in grade 8 in mathematics and science, Macedonia did significantly worse between 1999 and 2011 as the average mathematics score fell from 447 to 426, with no other European country scoring less. The proportion of FYR Macedonian students who achieve the minimum standard (the ‘low international benchmark’) fell from 70% to 61% in mathematics and from 73% to 53% in science”.
The report analyses presented in [50] raised multiple questions about the reasons that lead to such situation, which were the main motivating factors to explore in this direction and develop a methodology for evaluation of the potentials of an educational system for advancement, in the context of the usage of multimedia in class lectures. The evaluation defines multiple indicators that provide solid representation of the system’s condition, and supports the future planning and decisions concerning the advancement of the referred educational system.
-
III. Evaluation Methodology: Criteria, Indicators and Hypothesis
The methodology we have developed considers a three step approach. In the first step we define the basic criteria upon which the evaluation will be performed, i.e. the evaluation is defined from a perspective of several key aspects. The second step is the derivation of the quantitative normalized indicators that would accurately depict the current situation of an educational system involving the usage of multimedia technologies. And, finally, in the third step we describe our hypothesis which we put on a test in the next chapter.
-
A. Basic criteria
In order to plot the current potentials of an educational system to advance using multimedia technologies, we declare that the evaluation methodology is defined by three key aspects.
-
i) The first key aspect, upon which we base our estimation of the school’s capabilities to implement multimedia learning, is the school’s equipment with multimedia hardware and other IT resources . It is an obvious criteria since “one cannot become a good craftsman without possessing proper tools”. Thus, presenting the situation with hardware equipment is crucial to depict the schools’ capabilities to implement multimedia content in the class lectures. This aspect is covered by data concerning the total number of classrooms and the number of classrooms equipped with audio system, TV, video projector and smart board. We also included a set of questions about the Internet connection speeds, and the number of servers that a schools possesses.
-
ii) The second key aspect is the teachers’ interest and their current usage of multimedia content, as well as their requirements for future increased usage of multimedia in their lectures . In this manner, on one hand, we will learn the exact amount of classes in which some form of multimedia is used. But, on the other hand, what would be more valuable information is that this aspect will show how much are the teachers interested and willing to use
multimedia in their classes. Hypothetically, if we come to a situation in which the teachers consider that no benefit will come out of multimedia lectures, it would be quite difficult to enhance the educational processes, or, we can simply say, it would certainly take much longer.
-
iii) The third key aspect is about various events (seminars, conferences, workshops etc.) that schools organize to promote usage of multimedia in education, and/or the teachers’ attendances to such events regardless of whether they are organized by the schools we evaluate, or by a third party.
For the purpose of evaluation based on aforementioned criteria, we composed two types of questionnaires: a) a questionnaire for the principal/administration office, with questions concerning the equipment present in the school classrooms, the Internet connection capacities and the organization of promotional events, and b) a questionnaire for each teacher with questions about: the total number of classes in one semester for each subject they teach, the number of classes in which the teacher uses a single type of multimedia content (images, audio, video, animations, interactive multimedia content, educational games and various web resources), the cumulative usage of any type of multimedia in the total number of classes, the teacher’s attendance to meetings and events, and their preparedness and competencies for creating multimedia content. In this questionnaire we also included a question of whether the classroom where particular classes take place is properly equipped with multimedia devices, since many classrooms are shared classrooms.
-
B. Normalized indicators
Considering the previously defined key aspects of the evaluation methodology we define ten indicators of state , normalized to the values from “0” to “1”, that would present the preparedness of an educational system and its potentials to advance with an aid of multimedia in the class lectures.
-
1) The first indicator ( SEq ) considers the schools’ equipment . For the teachers to be able to fully implement multimedia lectures, we propose that each classroom should be fully equipped with an audio system, TV, video projector, smart board and at least one computer. SEq is calculated as the number of fully equipped classrooms divided by the total number of classrooms in the schools.
-
2, 3) The Internet connection bandwidths ( Up, Do ), are the second and the third indicator, which, in a standard case at present times, would be sufficient if each school has at least 30 Mbps download ( Do ) and at least 5 Mbps upload ( Up ) bandwidths. This is a case when a multimedia server (if present) does not serve clients outside the local network. Otherwise, the requirements for upload bandwidth would be much higher. These indicators are calculated as the current upload (i.e. download) divided by the upload (i.e. download) in the sufficient case (30/5 Mbps). If one of these measures goes above the limits of 30/5 Mbps, we set the corresponding indicator to “1”.
-
4) The fourth indicator ( E ) is part of the third aspect concerning meetings and events for promotion of multimedia usage in education, but only considers events that are organized by the respondent schools. In a discussion with several teachers from different schools (and not only the ones evaluated in this research), the majority believe that one municipal or regional meeting annually, in a form of a workshop, is sufficient to exchange experiences, promote collaboration about novel lecturing techniques and discuss the gained results. Therefore, this indicator is calculated as the total number of organized events in the last five years divided by 5.
-
5) As a fifth indicator ( S ), that also represents the aspect of equipment and IT resources, we defined the number of servers that a school possesses. For an ideally equipped school, we consider that one employed server is completely sufficient, but, beside other eventual functions, it is expected to be used for serving multimedia lectures as well. For a single institution this indicator is defined as “1” if server is present, and “0” if absent. For a larger educational system it is calculated as the total number of servers divided by the total number of evaluated schools (in our case four), with a maximum of “1”. In both cases, if the servers are not used for multimedia services, we additionally divide this indicator by “2”.
-
6) Concerning the usage of multimedia content in the classrooms, we believe that some or multiple forms of multimedia content should be used in every lecture, regardless if it is images, animation or some other form of multimedia. This is the sixth indicator ( uMM ). Combined usage of multiple content types is also encouraged, but in this particular research we addressed the issue of whether multimedia in any form is used in each lecture. Thus, it is calculated as the number of classes in which any type of multimedia is used divided by the total number of classes, in one semester.
-
7) The seventh indicator ( nMM ) is closely related to the sixth and represents the needed amount of multimedia lectures that teachers require and consider sufficient for their classes. It is calculated as the number of classes in which the teachers require to use multimedia, divided by the total number of classes, in a semester.
-
8) The eighth indicator ( tE ) is the average annual participation of the teachers to events promoting the use of multimedia in the classroom. In an ideal case, this indicator is also set to one which corresponds to the previous discussion about the organization of such events by the schools. This means that each teacher should attend at least one event annually, regardless whether it is a local, regional, or maybe international event. It is calculated as the average number of annual participations to such events divided by the total number of teachers.
-
9) Although considered in this research, the ninth indicator ( tC ) showing teacher competencies to create multimedia content is not regarded as a crucial factor, since the teachers teach different subjects and it cannot be expected from them to be educated in creating computer animations or producing specific videos. But, we included this indicator in order to see how the teachers manage with this issue, even though the percentage of
teachers that are competent to create multimedia content around 50% would be completely satisfactory. It is calculated as the average number of teachers that feel competent to create a certain type of multimedia content divided by the total number of teachers.
-
10) Finally, regarding the classroom equipment , we defined another indicator ( CEq ), denoting whether the classroom where the lectures of a specific course are held is equipped with multimedia devices. This indicator is closely related to SEq , but considers the fact that some classrooms are shared classrooms, which is especially the case for the computer laboratories. This is a compact indicator that represents the conditions of the classroom in use for the particular class lectures. It is calculated as the number of classes that are held in an adequately equipped classroom divided by the total number of classes held in one semester.
-
C. Hypothesis
When all the required data is gathered, we hypothesize that the potentials of an educational system to advance using multimedia technologies can be precisely determined. Thus, it can be exploited in making decisions in a direction to foster improvements to the learning processes, with an emphasis of the weakest elements that require premiere attention.
-
IV. An Evaluation Case Study Of A Segment of the Educational System In a Municipality in R.
Macedonia: Results And Discussion
For the purpose of presenting an example of evaluation of the potentials of an educational system to advance using multimedia technologies, we chose a segment of the educational system in a municipality in R. Macedonia. The selected segment of the educational system comprises of four schools. Hence, an anonymous survey was conducted in all selected schools, where each teacher, as well as representatives from the administrative offices, were individually requested to fill the corresponding questionnaires. We collected a total of 86 questionnaires from teachers, which represent 48% of all employed teachers, and all 4 questionnaires from the administrative offices.
-
A. General plots
In this section we fist plot the situation of the evaluated segment of the educational system in general, thus from Fig. 1 to Fig. 7 we present the findings regarding the key aspects, representing absolute, cumulative and/or single parameter data. These representations are quite adequate from a certain perspective, and offer good insight in some specific details concerning the implementation of multimedia in educational processes.
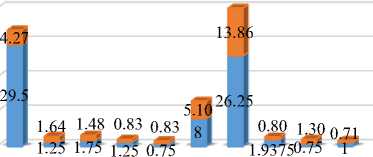
The chart in Fig. 1 represents the standings of all the evaluated schools in the municipality of Veles, concerning the multimedia equipment, Internet connection and organization of promotional events. Unfortunately, the presented numbers indicate significant deficiency in multimedia hardware equipment, such as, audio systems, TVs, video projectors and smart boards. The organization of events for promoting multimedia usage in classes is fair, with an average of 0.6 events annually, in the last five years, and with the last event held in December 2014. The schools are also well equipped with servers, but with only 25% usage for the purpose of implementing multimedia in classes. The only satisfactory parameters in this case are the Internet connection speeds. We must also mention that, according to the questionnaires, individual situation among all evaluated schools is very similar, which is shown by the standard deviation along the mean values, concerning the schools’ equipment, presented in Fig. 2. This implies that the situation with the lack of hardware equipment is common among all the evaluated schools in the city of Veles.
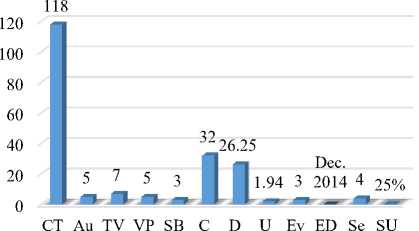
Legend: CT – the total (cumulative) number of classrooms from all evaluated schools; Au – the number of classrooms equipped with audio system and speakers; TV – the number of classrooms equipped with a TV set; VP – the number of classrooms equipped with video projector; SB – the number of classrooms equipped with Smart Board; C – the number of classrooms equipped with one or more computers; D – average Internet upload bandwidth per school in Mbps; U – average Internet download bandwidth per school in Mbps; Ev – the number of events organized for promotion of multimedia in learning, in the last five years; ED – the date of the last organized event; Se – the total number of servers that evaluated segment of educational system in Veles possesses; SU – the percentage of servers that are used for the purpose of implementation of multimedia in lectures.
-
Fig.1. Schools’ multimedia equipment in all evaluated schools in the selected segment of the referred educational system.
aCT aAu aTV aVP aSB aC aD aU aEv aSe
■ Classroom multimedia equipment ■ Standard deviation
Legend: aCT – average number of classrooms from all secondary schools; aAu – average number of classrooms equipped with audio system and speakers; aTV – average number of classrooms equipped with a TV set; aVP – average number of classrooms equipped with video projector; aSB – average number of classrooms equipped with Smart Board; aC – average number of classrooms equipped with one or more computers; aD – average Internet upload bandwidth per school in Mbps; aU – average Internet download bandwidth per school in Mbps; aEv – average number of events organized for promotion of multimedia in learning, in the last five years; aSe – average number of servers per school.
-
Fig.2. Average multimedia equipment in the evaluated schools in the selected segment of the referred educational system, and the standard deviation among different schools.
The following several charts present the situation of the teachers’ use of multimedia content, as well as their other activities concerning the use of multimedia, their participation in various events, their capabilities to create multimedia content and whether the classroom where they hold their classes is properly equipped.
Contrary to the situation with the schools’ equipment presented in Fig. 1 and Fig. 2, the chart in Fig. 3 describes completely different situation. Even though the classrooms are barely equipped with multimedia devices, it appeared that in the majority of classes (nearly 70%) teachers do implement multimedia in their lectures. These two different plots do not correspond to each other, and at first it seemed that there are some errors in the data analyses, or maybe the respondents did not provide accurate answers. This situation motivated us to convey a series of conversations with the teachers previously involved in the survey, from whom we learned that most of them use their own laptops and carry-on speakers to implement multimedia in their classes. This was unexpected and surprising information, but is was also explaining the reason for our charts discrepancy. We must also point out that this raised a certain dilemma about the quality of multimedia lecturing when only a single laptop is used in class, but this is a question that is out of the scope of this research. What can be considered as a promising outcome of the situation that Fig. 3 presents is that all the teachers consider that multimedia should be implemented in even more of their classes.
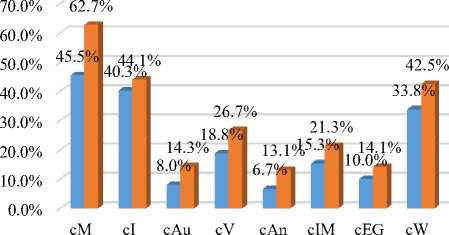
■ Actual usage of multimedia content in class
■ The need for usage multimedia content in class
Legend: cM – percentage of classes in which any type of multimedia content is used; cI – percentage of classes that use images; cAu – percentage of classes that use audio content; cV – percentage of classes that use video materials; cAn – percentage of classes that use animations; cIM – percentage of classes that in which interactive multimedia content is used; cEG – percentage of classes that use educational games; cW – percentage of classes that use some type of web content.
-
Fig.3. Percentage of classes in which various types of multimedia content is used and needed as an aid to the lectures.
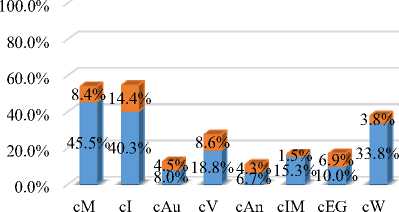
Fig. 4 shows the standard deviation among the teachers from all different schools, along with the data about the actual usage of multimedia in classes, which shows that the situation among the teachers is relatively similar. The following Fig. 5, similarly to the outcome of Fig. 1, presents a situation that is barely satisfactory. With an average annual participation of teachers to a 0.13 events, it can be concluded that each teacher, on average, attends one event in 7 to 8 years. This is quite valuable information for the schools management team, and an indicator that this kind of collaboration among the teachers should be more intensively promoted.
multimedia materials. Thus, it must be pointed out that in this particular case there is very high standard deviation among the teachers, which, we must admit was an expected result. If we compare the chart in Fig. 6 to the chart in Fig. 3, we can infer some correlation explaining that decent amount of multimedia materials are certainly provided or produced by the corresponding teachers. This situation also implies that, in order to enhance the learning capabilities of their students, many of the teachers put a lot of effort to follow the modern trends in education and to practice the new ways of teaching. Also, an inevitable conclusion implies that the ambient they work in can be further improved.
-
■ Standard deviation
-
■ Actual usage of multimedia content in class
Legend: cM – percentage of classes in which any type of multimedia content is used; cI – percentage of classes that use images; cAu – percentage of classes that use audio content; cV – percentage of classes that use video materials; cAn – percentage of classes that use animations; cIM – percentage of classes that in which interactive multimedia content is used; cEG – percentage of classes that use educational games; cW – percentage of classes that use some type of web content.
Fig.4. Percentage of classes in which various types of multimedia content is used as an aid to the lectures, and the standard deviation of multimedia usage among the teachers.
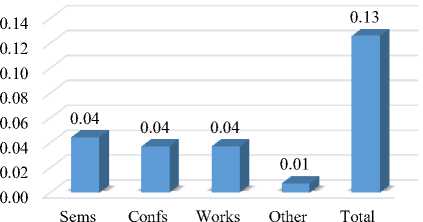
Legend: Sems – average number of attended seminars; Confs – average number of attended conferences; Works – average number of attended workshops; Other – average number of attended other events; Total – average number of attended any type of event
-
Fig.5. Average annual participation of a single teacher in events that promote usage of multimedia in education, in the last five years.
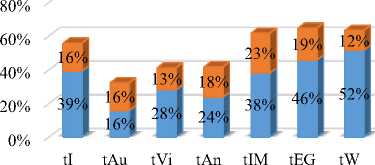
In Fig. 6 we plot the percentage of teachers that feel competent to create certain multimedia content for the use in their own lectures, as well as the standard deviation of this indicator. Again, we observe quite interesting results because decent number of teachers believe that they are sufficiently competent to create their own
-
■ Standard deviation
-
■ Percentage of teachers that are competent to create multimedia content
Legend: tI – percentage of teachers that are competent to prepare the images they use in their classes; tAu – percentage of teachers that are competent to produce audio content; tVi – percentage of teachers that are competent to produce video materials; tAn – percentage of teachers that are competent to produce animations; tIM – percentage of teachers that are competent to produce interactive multimedia; tEG – percentage of teachers that are competent to produce educational games; tW – percentage of teachers that are competent to produce web content
-
Fig.6. Percentage of teachers that are competent to produce multimedia content for their lectures, and the standard deviation among them.
To conclude this part, consisting of chart types explaining certain situations, we present one more parameter in Fig. 7 that somehow correlates to the data about schools’ equipment presented in Fig. 1, but from a
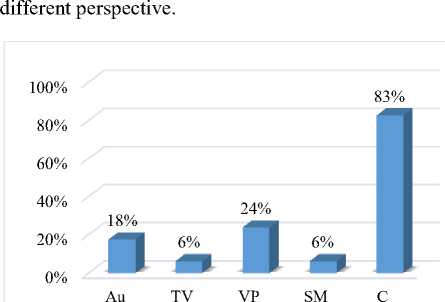
Legend: Au – the number of classrooms equipped with audio system and speakers; TV – the number of classrooms equipped with a TV set; VP – the number of classrooms equipped with video projector; SB – the number of classrooms equipped with Smart Board; C – the number of classrooms equipped with one or more computers.
-
Fig.7. Percentage of classrooms that are equipped with multimedia devices, where the teachers hold their lectures for a certain subject.
Namely, in the most usual case, in all the schools, classrooms are sheared among students of different age, subject, and different teachers. Thus, the situation presented in Fig. 1 does not necessarily imply such unwilling situation as it appears to be at first site. Fig. 7 shows that, since the majority of classrooms are shared, the percentage of equipped classrooms where the teachers hold their lectures is quite higher compared to Fig. 1. This also implies that it is not necessary to employ full multimedia equipment in all the classrooms, and we believe that a percentage of roughly 50% would be completely sufficient. As presented in Fig. 7, the situation with the classroom equipment where certain classes are held exhibits better overall standings, regardless of the quite deficient situation presented in Fig. 1.
-
B. Normalized indicators and comprehensible plot
For the purpose of making the results of this research much more prominent for the top management, and to visualize the ten indicators defined in the previous section more comprehensibly, in the following charts (Fig. 8 and Fig. 9) we plot the normalized indicators in a visually more intelligible radar chart. Hence, each indicators’ value spans from zero to one, where zero means worst, and one indicates best case scenario. The plots in Fig. 8 present the individual situation in each school, from which it can be seen that all the schools share similar characteristics. Fig. 9 clearly depicts the current potentials of the evaluated (composite) segment of the educational system to advance using multimedia technologies. From this plot it is easily inferred that the schools are not sufficiently equipped with multimedia devices (indicators SEq and CEq ), and these should gain premier attention in future enhancement planning efforts.
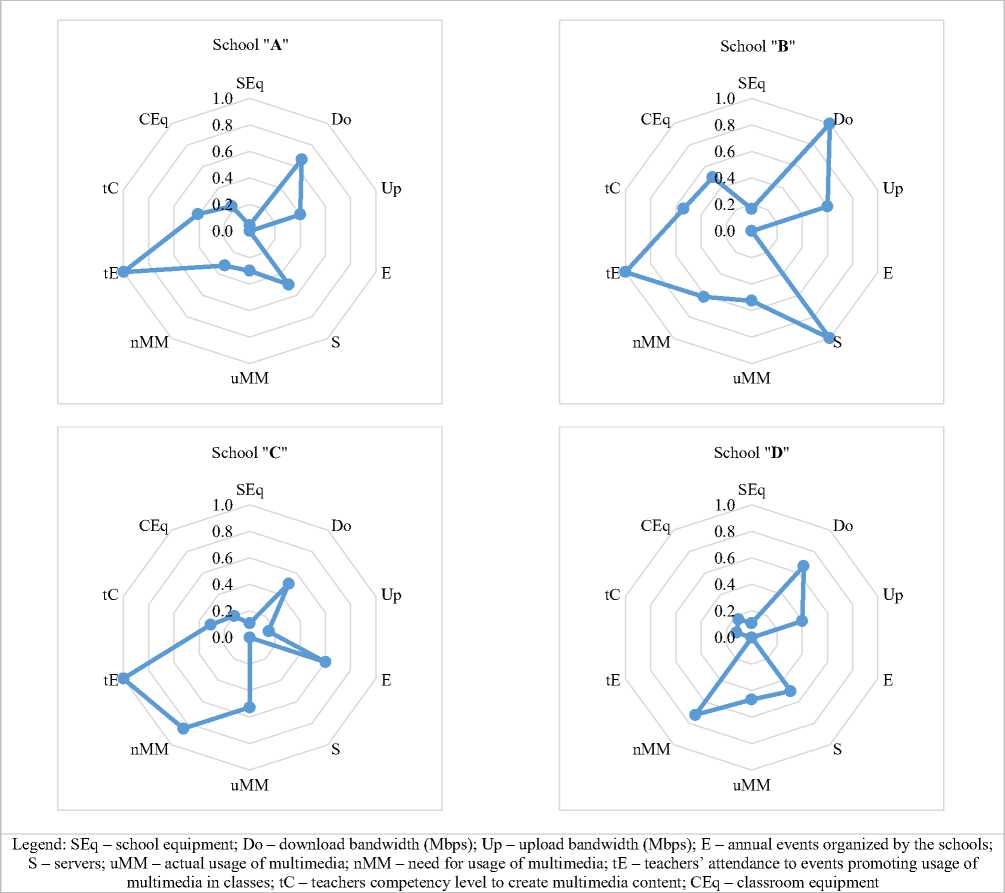
Fig. 8. Plot of the 10 normalized indicators individually presenting the potentials of each evaluated school school the city of Veles, R. Macedonia, to advance using multimedia technologies.
The referred educational system is also deficient in organizing events for promoting the usage of multimedia in classes, and it is also quite inactive in promoting the idea that teachers should make greater effort to attend such events (indicators E and tE ). In this manner, it is obvious that a collaboration among teachers is required in a greater extent as well. Other indicators, such as Do , Up , and uMM imply highly substantial situation in the usage of multimedia content.
But, we must draw attention to the question whether the quality of multimedia lectures is on an appropriate level, since the teachers work in somewhat insufficiently equipped classrooms, and provide their own means to realize their intended lecturing tasks.
CEq
Do
SEq 1.0 0.9 0.8
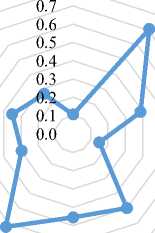
tC
tE
Up
E nMM uMM
Legend: SEq – school equipment; Do – download bandwidth (Mbps); Up – upload bandwidth (Mbps); E – annual events organized by the schools; S – servers; uMM – actual usage of multimedia; nMM – need for usage of multimedia; tE – teachers’ attendance to events promoting usage of multimedia in classes; tC – teachers competency level to create multimedia content; CEq – classroom equipment
Fig.9. Plot of the 10 normalized indicators presenting the potentials of the whole segment of the educational system to advance using multimedia technologies.
Another indicator with a positive value is nMM that witnesses the increased interest among the teacher to use multimedia content, beside the fact that the actual usage is rather decent. If we go back and refer to the previously mentioned Report [50], an obvious recommendation for this particular educational system would be to direct their future investments toward providing certain multimedia equipment, as well as a financial support for organizing promotional events and providing the teachers with means to participate in such events.
-
V. Conclusion and Future Work
In recent years, implementing multimedia in lectures attracted huge attention from the research community. That research has proven that multimedia is quite beneficial to the educational processes and brings a lot of benefits to enhance learning. But, for an educational system, the information that multimedia technologies provide enhancement of the educational process is not sufficient to achieve the required advancement. Decisions about actions and investments, in the context of implementing multimedia in lectures, must be based on a specific analysis of the current system state. In this research we developed an evaluation methodology that supports the purposes of strategic planning and investments in educational systems by plotting the crucial indicators that depict the educational system’s condition, and its potentials to advance with the implementation of multimedia. As a case study, a segment of the educational system in a municipality in R. Macedonia was evaluated, where the results have exactly shown its strong and weak aspects, and in which direction should future efforts be conducted. Regarding the results of this evaluation, it was evident that classroom equipment indicators were among the lowest, while Internet connection capacities and the actual use of multimedia were among the highest. Beside the recommendations for future investments in equipment that the results imply, the organization and promotion of events about the use of multimedia in education should be conveyed as well. Considering the fact that teachers mostly use multimedia that personally create, or make their own effort to provide, we believe that a multimedia collaboration system (library and portal) would provide greater benefits to the educational community, and not only to a single educational system. If teachers in a larger region are connected in a collaboration system where they can exchange multimedia content and lectures, it would widen the enhancement perspectives not only to the educational processes, but also to the way teachers experience teaching. Our future efforts would be directed toward the planning and development of such collaboration system where teachers, as well as students, can create, exchange and discuss their experiences from using multimedia lectures and the knowledge benefits they gain.
Acknowledgements
The authors wish to thank all the teachers and other employees from the educational institutions that participated in the survey and compliment their open cooperation that enabled this research to be realized.
References Evaluating the Potentials of Educational Systems to Advance Implementing Multimedia Technologies
- Lee, Pui Mun, and William G. Sullivan (1996). Developing and implementing interactive multimedia in education. IEEE Transactions on Education, 39(3), 430-435.
- Mayer, Richard E. (1999). Multimedia aids to problem-solving transfer. International Journal of Educational Research, 31(7), 611-623.
- García, Ramón Rubio, Javier Suárez Quirós, Ramón Gallego Santos, Santiago Martín González, and Samuel Morán Fernanz (2007). Interactive multimedia animation with macromedia flash in descriptive geometry teaching. Computers & Education, 49(3), 615-639.
- Lin, Lijia, and Robert K. Atkinson (2011). Using animations and visual cueing to support learning of scientific concepts and processes. Computers & Education, 56(3), 650-658.
- Kim, Jung Tae, and Won-Hyung Lee (2015). Dynamical model for gamification of learning (DMGL). Multimedia Tools and Applications, 74(19), 8483-8493.
- Arcelli, Francesca, and Massimo De Santo (2002). Multimedia distributed learning environments: Evolution towards intelligent communications. Multimedia Tools and Applications, 16(3), 187-206.
- Mayer, Richard E., and Roxana Moreno (2002). Animation as an aid to multimedia learning. Educational psychology review, Plenum publishing corporation, 14(1), 87-99.
- Lou, Shi-Jer, Hui-Chen Lin, Ru-Chu Shih, and Kuo-Hung Tseng (2012). Improving the Effectiveness of Organic Chemistry Experiments through Multimedia Teaching Materials for Junior High School Students. Turkish Online Journal of Educational Technology-TOJET, 11(2), 135-141.
- Aloraini, Sara (2012). The impact of using multimedia on students' academic achievement in the College of Education at King Saud University. Journal of King Saud University-Languages and Translation, 24(2), 75-82.
- Milovanovic, Marina, Jasmina Obradovic, and Aleksandar Milajic (2013). Application of Interactive Multimedia Tools in Teaching Mathematics-Examples of Lessons from Geometry. TOJET: The Turkish Online Journal of Educational Technology, 12(1).
- Mercier, Emma M., and Steven E. Higgins (2013). Collaborative learning with multi-touch technology: Developing adaptive expertise. Learning and Instruction, 25, 13-23.
- Pérez-López, David, and Manuel Contero (2013). Delivering educational multimedia contents through an augmented reality application: A case study on its impact on knowledge acquisition and retention. TOJET: The Turkish Online Journal of Educational Technology, 12(4).
- Barra, Enrique, Sandra Aguirre Herrera, Jose Ygnacio Pastor Caño, and Juan Quemada Vives (2014). Using multimedia and peer assessment to promote collaborative e-learning. New Review of Hypermedia and Multimedia, 20(2), 103-121.
- Surjono, Herman D. (2015). The Effects of Multimedia and Learning Style on Student Achievement in Online Electronics Course. Turkish Online Journal of Educational Technology-TOJET, 14(1), 116-122.
- Rabah, Jihan (2015). Benefits and Challenges of Information and Communication Technologies (ICT) Integration in Québec English Schools. TOJET: The Turkish Online Journal of Educational Technology, 14(2).
- Tibbitts, George E., John R. Nicholas, and Ronald J. McKay (1978). Five Teaching Methods: A Comparative Study in Nurse Education. Australian Journal of Education, 22(1), 91-92.
- Cuban, Larry, Heather Kirkpatrick, and Craig Peck (2001). High access and low use of technologies in high school classrooms: Explaining an apparent paradox. American educational research journal, 38(4), 813-834.
- Evans, Chris, and Nicola J. Gibbons (2007). The interactivity effect in multimedia learning. Computers & Education, 49(4), 1147-1160.
- Gilakjani, Abbas Pourhosein. (2012). The significant role of multimedia in motivating EFL learners' interest in English language learning. International Journal of Modern Education and Computer Science (IJMECS), 4(4), 57-66.
- Khoo, M. (2007). Observing the users of digital educational technologies: theories, methods and analytical approaches. The New Review of Hypermedia and Multimedia, 13(2), 87-91.
- Schmid, Euline Cutrim (2008). Potential pedagogical benefits and drawbacks of multimedia use in the English language classroom equipped with interactive whiteboard technology. Computers & Education, 51(4), 1553-1568.
- Eysink, Tessa HS, Ton de Jong, Kirsten Berthold, Bas Kolloffel, Maria Opfermann, and Pieter Wouters (2009). Learner performance in multimedia learning arrangements: An analysis across instructional approaches. American Educational Research Journal, 46(4), 1107-1149.
- Brom, Cyril, Vít Šisler, and Radovan Slavík (2010). Implementing digital game-based learning in schools: augmented learning environment of 'Europe 2045'. Multimedia systems, 16(1), 23-41.
- Kumar, Jeya Amantha, Balakrishnan Muniandy, Wan Ahmad Jaafar Wan Yahaya, and Wan Ahmad Jaafar (2016). Emotional Design in Multimedia Learning: How Emotional Intelligence Moderates Learning Outcomes. International Journal of Modern Education and Computer Science (IJMECS), 8(5), 54-63.
- Kumar, TP Anil, K. Nidhina, V. Vijith Krishnan, Kamal Bijlani, and P. Anu (2010). Collaborative 2D animations in e-Learning paradigm and its applications. IEEE International Conference on Technology for Education, pp. 248-249.
- Bittman, Michael, Leonie Rutherford, Jude Brown, and Lens Unsworth (2011). Digital natives? New and old media and children's outcomes. Australian journal of education, 55(2), 161-175.
- Mai, N. E. O., Ken Tse-Kian Neo, and Heidi Yeen-Ju Tan (2012). Applying authentic learning strategies in a multimedia and web learning environment (MWLE): Malaysian students' perspective. TOJET: The Turkish Online Journal of Educational Technology, 11(3).
- Chen, Chiu-Jung, and Pei-Lin Liu (2012). Comparisons of Learner-Generated versus Instructor-Provided Multimedia Annotations. Turkish Online Journal of Educational Technology-TOJET, 11(4), 72-83.
- Marsono, Wu, Mingchang (2016). Designing A Digital Multimedia Interactive Book for Industrial Metrology Measurement Learning. International Journal of Modern Education and Computer Science (IJMECS), 8(5), 39-46.
- Uluyol, Celebi, and R. Kagan Agca (2012). Integrating mobile multimedia into textbooks: 2D barcodes. Computers & Education, 59(4), 1192-1198.
- Loong, Esther Yook-Kin, and Sandra Herbert (2012). Student perspectives of web-based mathematics. International Journal of Educational Research, 53, 117-126.
- Portugal, Cristina and Rita Maria de Souza Couto (2012). Educational Suport for Hypermedia Design. International Journal of Modern Education and Computer Science (IJMECS), 4(6), 9-16.
- Adesope, Olusola O., and John C. Nesbit (2013). Animated and static concept maps enhance learning from spoken narration. Learning and Instruction, 27, 1-10.
- Ocepek, Uroš, Zoran Bosnić, Irena Nančovska Šerbec, and Jože Rugelj (2013). Exploring the relation between learning style models and preferred multimedia types. Computers & Education, 69, 343-355.
- Inayat, Irum, Rooh ul Amin, Zubaria Inayat and Khan Badshah (2013). A Collaborative Framework for Web based Vocational Education and Training (VET); Findings from a Case Study. International Journal of Modern Education and Computer Science (IJMECS), 5(12), 54-60.
- Danielson, Jared, Vanessa Preast, Holly Bender, and Lesya Hassall (2014). Is the effectiveness of lecture capture related to teaching approach or content type? Computers & Education, 72, 121-131.
- Robles , Ava Clare Marie O. (2013). The Use of Educational Web Tools: An Innovative Technique in Teacher Education Courses. International Journal of Modern Education and Computer Science (IJMECS), 5(2), 34-40.
- Leow, Fui-Theng, and Mai Neo (2014). Interactive Multimedia Learning: Innovating Classroom Education in a Malaysian University. Turkish Online Journal of Educational Technology-TOJET, 13(2), 99-110.
- Smith, J. G., and S. Suzuki (2015). Embedded blended learning within an Algebra classroom: a multimedia capture experiment. Journal of Computer Assisted Learning, 31(2), 133-147.
- Mayer, Richard E., and Gabriel Estrella (2014). Benefits of emotional design in multimedia instruction. Learning and Instruction, 33, 12-18.
- Jeong, Hwa-Young, and Sang-Soo Yeo (2014). The quality model for e-learning system with multimedia contents: a pairwise comparison approach. Multimedia Tools and Applications, 73(2), 887-900.
- Auddy, Ajay and Sripati Mukhopadhyay (2014). Studies on ICT Usage in the Academic CampusUsing Educational Data Mining. International Journal of Modern Education and Computer Science (IJMECS), 6(6), 10-20.
- Scheiter, Katharina, and Alexander Eitel (2015). Signals foster multimedia learning by supporting integration of highlighted text and diagram elements. Learning and Instruction, 36, 11-26.
- Bei, Chengxun, and Jianxin Peng (2012). Application of Network and Multimedia Technology in University Physical Experiment Teaching. International Journal of Education and Management Engineering, 2(1), 42-46
- Neo, Mai, Heykyung Park, Min-Jae Lee, Jian-Yuan Soh, and Ji-Young Oh (2015). Technology Acceptance of Healthcare E-Learning Modules: A Study of Korean and Malaysian Students' Perceptions. TOJET: The Turkish Online Journal of Educational Technology, 14(2).
- Park, Babette, Lisa Knörzer, Jan L. Plass, and Roland Brünken (2015). Emotional design and positive emotions in multimedia learning: An eyetracking study on the use of anthropomorphisms. Computers & Education, 86, 30-42.
- Kocaleva, Mirjana, Igor Stojanovic and Zoran Zdravev (2015). Model of e-Learning Acceptance and Use for Teaching Staff in Higher Education Institutions. International Journal of Modern Education and Computer Science (IJMECS), 7(4), 23-31.
- Schweppe, Judith, Alexander Eitel, and Ralf Rummer (2015). The multimedia effect and its stability over time. Learning and Instruction, 38, 24-33.
- Ministry of education of R. Macedonia (FYROM) (2005). National program for development of education in the R. Macedonia 2005-2015. Government of the Republic of Macedonia (FYROM).
- Report No. 93913-MK (2015). FYR Macedonia Public Expenditure Review: Fiscal Policy for Growth. World Bank Group – Macroeconomics and Fiscal Management.
