Evaluating the Project based Organizational Teaching-Learning Process

Author: S. Justus, Mohammed Sirajudin
Journal: International Journal of Modern Education and Computer Science (IJMECS) @ijmecs
Article in issue: 5 vol.5, 2013.
Free access
Organizational Training and Learning are among the 22 key process areas in CMM. These two processes are subject for improvement based on its framework and execution. In this paper, we have worked on project-based frameworks for organizational training and learning and have attempted to validate them in the software developmental organizations and in an institution teaching software engineering. The empirical validation is carried out with those case studies and significant results are obtained in assessing the improvement in the two process areas. Moreover, this work is also extended to accommodate improvement in the regular conventional OTL processes.
Organizational Learning, Training, Project Based Learning, Teaching learning frameworks
Short address: https://sciup.org/15014548
IDR: 15014548
Text of the scientific article Evaluating the Project based Organizational Teaching-Learning Process
Published Online June 2013 in MECS DOI: 10.5815/ijmecs.2013.05.05
With many problems lying around in computer science and software engineering education and practice, we found this area of organizational teaching-learning much challenging and interesting [13], [16]. Many realtime unsolved problems of project failures, risk management in project management, managers’ failures to meet out the timeline and avoid budget runs, employees attitude and ability to work in team, and challenging technical problems, are all the areas in which the software development companies are striving hard to survive [1], [5], [13].
One of the reasons that software developing organizations lack is the appreciation for learning and self-improvement through learning and experience [20]. All they would concentrate is finishing projects in time, earn revenue and forget and do not document what has been learnt in the previous successfully finished project [11], [12].
This lead us to contemplate over the area projectbased organizational teaching-learning, where conventional curriculum based teaching will not be in operation. It is not that only software development companies are facing such serious problems, but the institutions which teach software engineering are facing a bad scenario, due to the gap between the institution and the industry.
-
A. Research Problem
On the motivation to take up this research work in organizational teaching and learning, the research problem is to “Evaluate the project-based Organizational Teaching-Learning (OTL) Process”. To take up this research work we framed three questions, which directed us to carry out this research work in the right direction. The research questions are:
-
■ What process areas commend teaching (or training) and learning?
-
■ What parameters are to be evaluated to assess project-based OTL?
-
■ Could there be real improvement in a project based organizational teaching-learning process? Validate.
The project-based processes are to be validated for their real impact and influence in the improvement of the two processes. These questions drove the research work in a way it should need valid substantiation for an improvement framework.
-
B. Outline of the Paper
This paper is organized as follows: Section II presents the oraganizational teaching-learning (OTL) framework and its assessment. Section III focuses on the Evaluation of the presented processes, with focus on research design, and assessment plans for the experminents. Section IV describes the experiments carried out based on the OTL frameworks and its validation. Section V concludes with a few points on the future directions of this work.
-
II. OTL Framework and its Assessment
It shows that good training results in delivering customer goals, enhancement of individual performance, which in turn, helps the organization in achieving its business goals.
-
A. Organizational Training System
Definition: More formally speaking, ‘Training is a transforming process that requires some input and in turn it produces output in the form of knowledge, skills, and attitudes (KSAs)’ [6]. Two models of OT are discussed in this subsection.
-
a) Individual Training Model (ITM)
Individual Training Model (ITM) addresses the individual trainer’s methodology for project-based teaching. Training objectives are defined on the basis of job responsibilities and job description, and on the basis of the defined objectives individual progress is measured. This model is the practiced model in most of the training organizations, specifically in software development companies that offer instant training to its employees. Since we were with the learning institutions for more than 12 years, we were able to draw this model of practice in Individual training and learning.
The ITM comprises of five stages:
-
1. REQUEST ANALYSIS – Training requests from development team are analyzed – training expectations, pre-requisites, target audiences skill level etc.
-
2. DESIGN – Based on the request analysis and refining the needs, the curriculum is designed, with much focus on the project based training modules. Course objectives are set, instructional objectives that can measure the content’s credibility, trainer’s presentation and participants’ understanding. Modes of training, study materials, sequence of contents are designed.
-
3. DEVELOPMENT – The design decisions are converted into training material. It consists of developing course material including course
-
4. IMPLEMENTATION – All logistical arrangements, such as classroom venues, public address audiovideo systems, in-class facilities like chairs, tables, podium, boards, and food facilities, parking, and other training accessories, that will make the training effective.
-
5. EVALUATION – Ensures that the training program has met its objectives in terms of trainer’s productivity and learners’ understandability. The strengths and weaknesses of different components involved are indentified and steps are taken to improve the failed areas in the training module.
materials, handouts, demos, audio-visual aids, lecture notes etc, for the trainer. Elaborated course material, summary files and shareable contents for the trainee are developed alongside.
-
b) Group Training Model (GTM)
Group Training Model (GTM) focuses on the organization as a whole, while having the ITM model as its core. The outer loop describes the vision, mission and values of the organization on the basis of which individual training model (ITM) i.e. inner loop is executed. Observations were carried out in three IT companies and five academic institutions in India, where they all followed this model with customization done to their ITM. Some had two more components, experimentation and realization, in their outer loop.
-
1. VISION – states the purpose of an organization’s existence and what it would like to achieve after a
-
2. MISSION – explain the reason of organizational existence and its vision. The endeavors that it takes to reach the objectives and goals mentioned in the vision statements are clearly stated here. The mission statement tells about the identity that how the organization would like to be viewed by the customers, employees, and all other stakeholders.
-
3. VALUES – is the translation of vision and mission into communicable ideals. It reflects the deeply held values of the organization and is independent of current industry environment
defined point of time. A wider perception or look into the future of the organization and sees itself few years down the line. It may include setting a role mode, or internal/global objectives or promising to meet some defined deadlines.
-
B. The Organizational Learning Model
Learning is formally defined as the process by which a person constructs new knowledge, skills and capabilities [14].
It is widely recognized that for an organization to be sustainable in the present climate, it is essential that it is equipped to adapt on a continual basis – and change is only useful if it is informed by learning.
-
a) Transition to a Learning Culture
As with any change to an organization’s culture, the transition to a learning culture must be managed well. Learning ultimately improves the competencies in an individual employee, with respect to their skillsets and technical proficiency. Competencies can be described as, “the behavior that employees must have or must acquire to input into a situation in order to achieve high levels of performance” [18]. Staff needs to be aware of the skills and behavior that is necessary for them to fulfill their job requirements, and being made aware of shortcomings should encourage learning to close the gaps.
We interviewed some 30 employees of two organizations about their preferred method of learning. Just over half cited learning ‘on-the-job’. Although classroom learning was second, it was a long way behind. Employees feel that it is important not to lose sight of traditional learning, however everyday on-the-job learning is treated with more significance and managed better. Technology explosion has let learning within the workplace, and in particular, the internet has opened up easy access to courses and sharing learning. E-learning is worth mentioning here specifically, as it has opened new ventures and perceptions, which appeals because it allows individuals to take responsibility for their learning and learn at their own pace.
Sloman [22] argues that training and development circles are increasingly focused on the individual’s responsibility for learning, where individuals start to question, “What difference could my learning make to my performance, and as a result, to the performance of the business?” Providing access to learning, without going through HR, is one way in which individuals could take ownership of their learning, for their own benefit, as well as that of the organization. But there is greater risk of guarantee that self-e-learning contributes to improvement of the OTL process. Hence, it is subject to measurement.
-
b) Measuring the Learning
If individuals are to take more personal responsibility for their learning there is an increased onus on the organization to measure whether learning is taking place. The following are tools to aid this:
-
1. Learning objectives need to be set from the start and follow a sequence of activities: A defined increase in knowledge or skills, building a learning network, sharing experiences, witness a measurable change, and improving perceptions of employees.
-
2. Personal Development Plans are crucial in objective setting. PDPs need to be owned by the individual and referred to and updated regularly.
-
3. Learning logs are a way of recording less formal learning.
-
4. Learning reviews with managers and peer groups are a way of reminding oneself what has been learned.
Measurement of learning also needs to occur at an organizational level. Corporate strategies need an accompanying learning strategy to highlight new skills and expertise that are required to fulfill the plan effectively, and this requires a system of measurement. Furthermore, to create a true learning culture, learning must not be for the sake of the individual alone, but for the team and the wider organization.
-
C. The Assessment Objectives for OTL
The measurement process area aligns closely with the assessment of the key process area, organizational training [9], [15]. We frame our implementation with the conjunction of Six-Sigma and CMMI. Six-Sigma place primary emphasis on understanding and managing performance (outcomes), while CMMI (in practice if not in principle) places more emphasis on compliance (activities) [13]. Certainly both are necessary and important, but neither is sufficient by itself.
The Six-Sigma roadmap provides a specific approach to establishing the overall objectives and identifying potential measures for an improvement project. As illustrated in Table I the assessment plan involves three defined steps: Chart, context understanding and assessments. The details and practical translations for each step are also provided in the table I.
table i. The Assessment Plan
|
Define Steps |
Step Details |
Practical Translation |
|
Develop Training Charter |
Training Statement |
Purpose of Training |
|
Statement with Success Measures |
What measures will be impacted? |
|
|
Team & Roles |
Identify team players and define roles |
|
|
Understand Learners & Context |
Review/Build Learning Objectives |
Given goal, scope and measure results, what does the trainer understand? |
|
Gather Data (trainer, learner, tests, skills) |
Gather data for understanding training context information |
|
|
Test the learner technically, maintain competency matrix for trainers |
||
|
Assess other process areas |
Define measurement strategies |
Quantify the measurable attributes |
|
Analyze the measurable terms for improvement |
Deem specific areas for improvement |
table ii. The Measurement Plan
|
Measurement Steps |
Step Details |
Practical Translation |
|
Plan Measure Results |
■ Operationally define result measures ■ Result Performance Standards |
■ Refine the training’s key result measures ■ Performance targets for key measure |
|
Plan to Collect Data |
|
|
|
Collect & Quantify Data |
■ Collect the data ■ Assess data distribution & integrity |
|
In Table II we provide plans for conducting measurements for evaluating the OTL and necessary improvements. Plan for measurement strategies for each training program and identify participating entities in the training. Collect key result measures from the training program for assessing the result performance and learners’ ability in absorbing the content of the technologies. Use an appropriate measurement tool to collect direct data that will be consistent in arriving at the factors that influence the training modules. Data segmentation may happen based on the influencing factors. The collected data is assessed and evaluated for data consistency and completeness which will then serve as indicator for suggesting improvement schemes.
The two tables Table I and Table II discusses the plan and strategies that should be followed during the experimental process of training in organizations.
-
III. Evaluating the Process Improvement
In this section we present the experimental environment and the methodologies with which the research is carried out. The evaluation of the OTL processes is performed in two stages: preliminary and main.
-
A. Research Design
The evaluation of the project based organizational Teaching (Training)-learning processes and their scope for improvement in the practicing environment is our research goal. The investigation is carried out using experimental evaluation of the practice that is actually happening. The collected empirical results are interpreted, evaluated and submitted for discussion, to arrive at possible conclusion stating the appreciable improvement in the OTL processes.
-
a) Data Collection
This study carried out in two software development companies had its own complications in moving with the employees and trainers and heads of the modules/projects. We were with the organization for few months and conducted our experiments on assessing the training processes that were in practice there and we strived to implement the project-based OTL framework. We conducted personal interviews with the HR, and the training heads of the companies. Then we interviewed the trainers, who were in various domains, and gathered the present status of the training modules. We also closely monitored by attending few training sessions and observed the trainers way of handling our new training module and the learners reaction in adapting to the new way of understanding the concepts.
We also included an institution offering software engineering as a program at the post-graduate level. To enter into the academic stream and getting them to cooperate with us in this research work needs lot of persuasion and patience. Finally, we did it and attended classes for two weeks, wherein we observed a different result from the one we had from the two software organizations. The results collected were the outcome of tests, and Group discussion conducted then and there during the course of this training program and at the end of each module.
-
b) Experimental Setup
We selected two companies that are involved in software development and an institution which is offering software engineering as a program at the post-graduate level. We found that the environment and the processes they adopt are a welcoming scene for our study. In order to protect the identity of the participants, the two companies were renamed as Company A and Company B, and the institution as Company C. The profiles of the companies are given in Table III.
table iii. Profile of the Companies
|
Name of the Company |
Location |
Employee Strength (Approx) |
Nature of the Organization |
Products/ Services |
|
Company A |
Metro |
2500 |
Multinational |
Software development/ Training |
|
Company B |
City |
1250 |
Medium Business |
Web services/ training/ consulting |
|
Company C |
City |
Teaching Staff: 600 Student: 1940 |
National Reputation |
Software Engineering Training |
B. Assessing the Teaching Learning Processes
The experimental setups for the assessment and the preliminary work carried out in the given setup and the direction of the work are discussed in the section.
-
a) Experimental setup for Assessment
Table IV gives the experimental setup of the three companies (two companies and one institution) and the assessment parameters for each of them.
-
b) Organizational Teaching Process
The framework of teaching process includes; Faculties, Professional Trainers, Heads of the Department/Institution and top management. The processes defined here are applicable to these teaching entities identified for this framework, but their level of implementation varies at different levels.
The teaching processes given in Table V gradually increases in complexity, teaching the basics in computer science to the higher level promoting research projects and software projects. Also the responsibilities of the heads of the department and corporate/institution are aptly defined in such a way they should contribute to the teaching process which would be purely project based and are deemed for improvement in the teaching/training processes.
table iv. The Experimental Setup for Assessment
|
Companies |
Success Factors |
No of Training Teams |
Learning Groups |
Quantifiable measures |
|
Company A |
Reachability of the training Improvement in Project endeavours |
4 |
12 |
No of contact hours No of practical sessions Test results Competency of the trainers |
|
Company B |
Usability of the Training modules Practicality of the theory Improvement in the trained subjects |
7 |
18 |
No. of contact hours No of practical session Understandability of the concepts Competency of the trainers |
|
Company C |
Usability of the training models in the view of understanding or Exams Project based teaching-learning |
2 |
6 |
No. of contact hours No. of internal tests/assignments Exam results Understandability of the concepts Competency of the teachers |
table v. Teaching Processes
|
Teaching Entities |
Teaching Processes |
|
Faculties |
Teaching the basic computer science concepts Teaching the rudiments of technologies based on existing projects Identify real-time problems in existing software projects Provide guidance to mini-projects to solve the proposed problems |
|
Professional Trainers |
High level of exposure to computer concepts Expert level practical exposure to latest technologies/projects Provide Practical knowledge in software development Motivate the learner to corporate cultures |
|
Head of Departments |
Motivate faculties in research and development projects Facilitate external consultancy to the departments Administer the overall competencies of each faculty and trainer |
|
Head of Institutions |
Facilitate individual departments of undertake external projects and funding Appreciate faculties and trainers by appropriate appraisal based on performance Promote research and projects in individual departments in addition to regular academic works |
|
Top Management |
Provide excellent infrastructure facilities Promote research and projects |
-
c) Organizational Learning Process
The most important part of success for the trainers lies with the process of learning. Since learners can be categorized into various levels, we have proposed the learning processes for each individual type of learners. Similar to the classification done for teaching module, we have identified five different groups of learners. The levels of learners begin from the most preliminary beginner-level learners to the domain experts who occupy the highest level in the group of learners.
The complexity of the process of learning also increases from beginner to domain expert. These levels of learners are a general classification that they can be found in any group or team. The handling and role play of the levels of learners in software projects varies – from simulated environments to real-time environments. When an individual climbs up this ladder, he/she will be able to work with real-time projects.
table vi. Learning Processes
|
Types of Learners |
Learning Processes |
|
Beginner |
Awareness of subject area Abstract concepts and ideas Basic of computer science concepts |
|
Advanced Beginner |
Marginal learning to an acceptable level Experience with mini projects Understands the scope of the subject or concept |
|
Proficient |
Exposure to and working knowledge in the relevant area of specialization Exposure to solving project based software problems |
|
Specialist |
Exposure to handle realtime software projects Able to provide consultancy in the relevant area of expertise |
|
Domain Expert |
Able to lead a software project team involved in real-time product development Interaction with experts in their relevant areas Expert consultancy in their domain area |
Source: Organizational Learning, 13th APSEC, 2006
C. Preliminary Measures and Results
The preliminary results were the measurement of the parameters for two months period of time.
For Company A, the training on theory sessions is optimum enough to cope with the subject’s understanding. The second week dipped so as to give sufficient room for practical sessions. During the third week, more theory and less practical sessions were good. And then as the training proceeded toward the end, a balanced approach is adopted. Tests were regularly conducted, and this could be the optimum approach for the training schedules. Figure 1, gives the preliminary measures of Company A.
Preliminary measures for company B are given in Figure 2. The training division of the Company-B is focusing mainly on theory and practical sessions for their learners, and only less priority is given for the conduct of tests. The trainers work too hard, ie., 45 hours a week in average, and contribute in full swing to both the ends. Theory and practical sessions are sometimes held in parallel. We could assess that the learners are much contend, because of the dual nature of training.
Preliminary measures for Company C are given in Figure 3. The institution showed a different outlook from what was observed in the other two companies. The theory part was given much weightage than the practical based study. At the end of the eighth week, we found that the theory sessions were increasing from what was found less in the earlier weeks forcing the labs to get reduced substantially. Except for the practical sessions, the schedules were good enough to assess our measurement parameters in our next study.
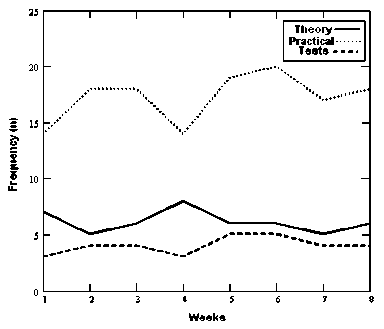
f igure 1. Preliminary Measures for Company-A
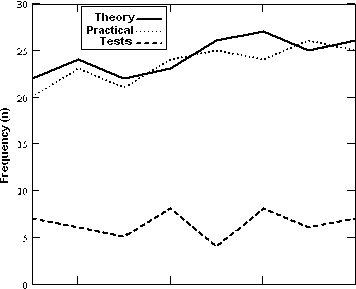
4 Weeks figure 2. Preliminary Measures for Company-B
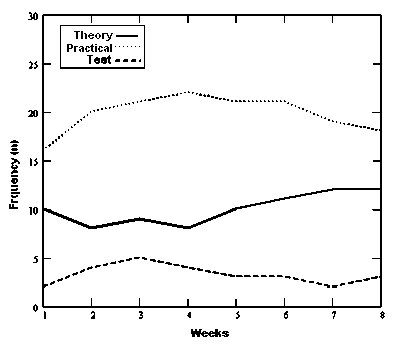
f igure 3. Preliminary Results for Company-C
-
IV. Experimental Results and Interpretation
This session discusses the main study of this research work, and presents the results in two phases – the understandability of the learners, and the teaching proficiency of the trainers. An improvement plan for the OTL framework is given at the end of this session.
-
A. Experimental Design
We collected data from interview sessions and participating in training sessions. Most of the experimental data interpretation is like before-after situation. To carry the experimental part of this research and make more authenticate, we have opted to follow two approaches, conventional Chi-Square Test for assessing the understandability of the learner, and regression method for evaluating the productivity of the trainer after implementing the project-based organizational teaching-learning framework. We will describe the two methods in this session.
project-based Training module conducted in the three companies, were asked to appear for a written exam. The number of individuals who passed the exam was taken as the observed value ( o ) and the expected value ( e ) is the number of individuals who passed the exams before implementing the project based OTL.
The Chi-square value is arrived using the following formula р2 = (o-e^- (1)
e
The results are shown in Table VIII.
table viii. Chi-Square Test Results
TABLE VII. V ariables I dentified for the experiment
|
Independent Variables |
Level 2 |
Ability, Motivation |
|
Level 1 |
Age, Sex, Qualification |
|
|
Dependent |
Understandability of the learner |
|
|
Variables |
Productivity of the Trainer |
|
The OTL framework is implemented in the three casestudies, and the two dependent variables, Understandability of the students and the Productivity of the Teachers, are identified. These two dependent variables are assessed for their improvement after implementing the OTL framework. Table VII tells the variables identified for this investigation.
We have drawn two levels of independent variables, in which the most preliminary variables, age, sex and qualification are classified as level 1 , and in level 2 independent variables are ability and self-motivation of the individual. These two variables are directly proportional to the dependent variable understandability and productivity .
We chose the 60 individuals, 20 in each case study, in the age limit >25 and <45; no restrictions in sex; framed two groups based on the qualification - Undergraduates and Postgraduates.
-
B. Chi-Square Test for Understandability
We derived two hypotheses, to test the understandability of the students who have undergone the project-based OTL program.
H0: U(!otl) ~ U(otl) <= 0 /*Not understood */
H1: U(!otl) ~ U(otl) > 0 /*Better Understanding*/
-
[1] Hypothesis H0 is if the difference in the understandability before and after implementing OTL of the learners is less than or equal of zero, then no effect of the project based OTL.
-
[2] Hypothesis H1 is if the difference in the understandability before and after implementing OTL of the learners is greater than zero, then the project based OTL has effect on the understandability of the learners.
We opted to test the understandability of the students using Chi-Square test. The 60 learners, who attended the
|
Weeks |
Observed |
Expected |
(o-e)2 |
(o-e)2/e |
|
1 |
54 |
50 |
16 |
0.32000 |
|
2 |
51 |
50 |
1 |
0.02000 |
|
3 |
48 |
45 |
9 |
0.20000 |
|
4 |
46 |
44 |
4 |
0.09091 |
|
5 |
58 |
55 |
9 |
0.16364 |
|
6 |
46 |
42 |
16 |
0.38095 |
|
7 |
44 |
42 |
4 |
0.09524 |
|
8 |
45 |
42 |
9 |
0.21429 |
|
9 |
52 |
45 |
49 |
1.08889 |
|
10 |
51 |
45 |
36 |
0.80000 |
|
11 |
56 |
48 |
64 |
1.33333 |
|
12 |
48 |
50 |
4 |
0.08000 |
|
13 |
51 |
50 |
1 |
0.02000 |
|
14 |
58 |
55 |
9 |
0.16364 |
|
15 |
53 |
50 |
9 |
0.18000 |
|
16 |
52 |
50 |
4 |
0.08000 |
|
Chi-Square = |
5.23088 |
|||
Source: Primary Data derived by applying Chi-Square Equation
For degree of freedom equal to 1 and for the Chisquare value 5.23088, the probability is estimated to be 0.01, which means 1% deviation is encountered due to other dropped out factors which affect the learning process. However, we have a significant improvement in the understandability of the learners.
This means the understandability of the learners after implementing the project-based learning framework has improved significantly, with one percent deviation that may be caused due to other factors which are not considered for this study. However this improvement is credited to the OTL framework of learning.
-
C. Regression Method for Proficiency
The productivity of teachers/trainers is another dependent variable with which we are so concerned in assessing the OTL framework. The productivity of a trainer is influenced by several factors, ranging from the teacher’s ability, students’ understandability, curriculum, environmental factors, examinations, evaluation methodologies etc. However we took into consideration a few of these factors and attempted to define teaching productivity.
These are the variables which are involved in assessing the productivity of a teacher. These parameters are evaluated based on the individual performance or usage of these methodologies to implement OTL, and then multiplied with regression parameters. Regression parameters are assigned weightage, constant values, which are already assessed based on environmental factors.
The regression equation is given as
Productivity = (α0 + (α1 * Basic teaching methodology) + ( α2 * modern teaching equipment usage) + ( α3 * demonstration-approach) + ( α4 * prevention-based approach) + ( α5
* appraisal-based approach) + ( α6 *
research projects & publications) + ( α7 * lecture-notes reuse) + R)
Relevant data are collected from the two software countries and one institution over a period of four weeks. The detailed values of data collection are given in Table IX.
table ix. Summary Statistics of the Variables
used in Analysis
|
Variables |
Units |
Mean |
Std Dev |
Min |
Max |
|
Basic teaching methodology |
% of total contact hrs |
34.68 |
11.35 |
13.62 |
52.38 |
|
Modern teaching equipment usage |
% of total contact hrs |
15.27 |
5.74 |
6.81 |
38.55 |
|
Demonstration approach |
% of project based demo |
19.85 |
9.18 |
4.11 |
44.53 |
|
Prevention-based approach |
% of Risk prevention |
4.57 |
4.56 |
1.00 |
25.67 |
|
Appraisal-based approach |
% of contribution |
22.45 |
7.59 |
8.89 |
42.69 |
|
Research Projects & Publications |
No. projects or publication |
7 |
2 |
1 |
12 |
|
Lecture notes reuse |
No. of times reused |
3 |
2 |
2 |
15 |
Source: Primary Data
table x. Regression Results
|
Variables |
Regression Constants |
Teaching Productivity |
|
Basic teaching methodology |
α 1 |
0.893 (0.046) |
|
Modern teaching equipment usage |
α 2 |
0.647 (0.032) |
|
Demonstration approach |
α 3 |
0.324* (0.035) |
|
Prevention-based approach |
α 4 |
0.059 (0.584) |
|
Appraisal-based approach |
α 5 |
0.573* (0.014) |
|
Research Projects & Publications |
α 6 |
0.182*** |
|
Lecture notes reuse |
α 7 |
0.845*** |
Source: Primary Data
Table X. shows the regression results of our data using the regression equation. Probability values are shown in parentheses; results significant at 5% are indicated by *; results significant at 1% are indicated by ** .
The summary statistics of our data set is presented in Table IX while the results of our regression tests on our data are presented in Table X. Overall, the results of our regression analysis indicate that our empirical models are valid. The Fisher statistic ( F ) values for the empirical model are significant at 1% and indicate that our regression results are statistically valid. The advantage of the regression model approach is that regression models take the effect of project size on the productivity of a project into account [21].
In the regression model, after several rigorous tests and experimentation we conclude that the productivity in hours estimated for the three organizations shows an appreciable value of 37% increase in productivity than the institute. The explained variance is observed as R2=0.60. That is 60% of variance in effort can be explained by project based teaching and learning.
-
D. Results and Interpretation
The understandability is a dependent variable on the number of students passed in a given test ( p ). So, p is directly proportionality of the understandability of a student in the undertaken test. We have considered the observed values of p and plotted it against the tests conducted during every week. The scatter of plots show that 62% of the tests showed above the passing minimum of 50.8%. Though the failure rate of the remaining 38% may be due to several other reasons, we consider this as plain observed value, considering the hypotheses (H0 and H1).
The graph shown in Figure 4 has two regions, where the unshaded region is accounted as the appreciable ( p ) value, supporting our thesis by 1% deviation caused due to other influencing factors.
We evaluated the effort to understand the subject based on the duration taken to prepare for the exam and get a pass in it. The formula to calculate the effort in hours to understand is
U(Effort) = ((o-e)/e) * e ,
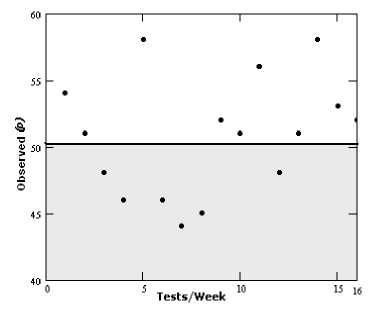
Figure 4. Plots for Observed Understandability
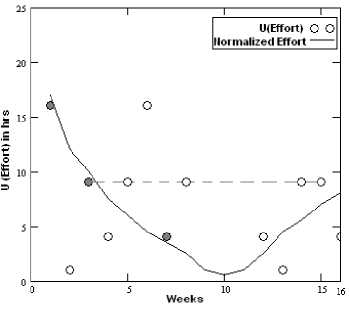
Figure 5. Consistency in Understandability Effort where e is a constant effort factor.
We plotted U(Effort) against the weeks during which the tests were conducted. Figure 5 shows the graph.
Also we drew a normalized curve for the effort taken to understand, and found that three values of effort are close to normalized curve, shaded in grey. Five values are consistent in showing 8-9hrs of effort put in understanding the concepts in each subject applying our project based OTL. The results showed 32% of the consistent cases which is significant for a first time implementation. This would improve as weeks and semesters pass by.
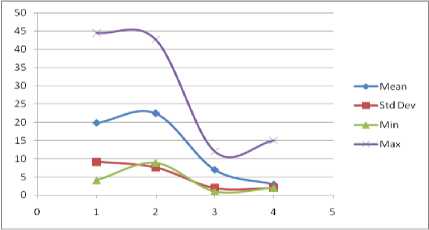
Figure 6. Regression Analysis: Values of Significance 1-Demonstration approcah; 2-Appraisal based approach; 3-Research projects & publications; 4-Lecture notes reuse
table xi. Improving Process Areas
|
Measurement Steps |
Step Details |
Practical Translation |
|
Develop and Compare Solution Alternatives |
Develop alternate solutions |
Develop two-or-more alternate solutions |
|
Strengthen Key solution areas |
Document the relationship of inputs & outputs in the context of solution areas |
|
|
Select and tune the best solution |
Select the best solution |
Weigh the top candidate solutions |
|
Tune and detail the solution |
Perform the critical evaluation on the improvement program |
|
|
Pilot the Solution |
Mistake proof the solution |
Assess “What could go wrong?” |
|
Evaluate Pilot Performance |
Document the measure results |
|
|
Refine solution for implementation |
The solution is ready to roll out |
Source: Use of IDEAL Model, ICSE 2000
Research projects and software real-time projects lay a vital, non replaceable role in the teaching and learning processes of individuals, teams and organization as a whole. This is one such area where the learning institutions have to concentrate more in order to compete in the international research scenario.
With these results in hand, we would like to draft the plan for improving the OTL. The three steps involved in analyzing the solution inorder to get improvement in long term are:
-
■ Develop and Compare Solution alternatives
-
■ Select and tune the best solution
-
■ Pilot the solution
Table XI shows the steps and the practical implementation of the steps. The first two steps are carried out in this research, and the last step is omitted, because we have worked on limited time slots and on controlled environment. This work on OTL can be implemented on a long time basis and the results thus obtained could be analyzed with more number of case studies. However, we find the results obtained through implementing the project-based organizational teachinglearning are subject to improvement in future endeavors. This discussion on the results obtained was significant in focusing the improvement venues and will serve as a better indicator for process improvement.
The teaching learning process practices in software industry and institutions were more conventional than contemporary.
Organizational teaching-learning process can be improved in two aspects, the learning power of the student and the productivity of the trainer. While we considered only three case studies, this framework can be extended to more cases and should be implemented in controlled and uncontrolled environments. Then the results of the two scenarios could be assessed and we are sure that appreciable improvement would be the outcome.
Future Works
There are open problems in OTL: 1) knowledge based technical teaching, and 2) experience based learning. These two issues are still in study and research. From this research work we inferred that the project based teaching-learning program is feasible in small and medium scale developmental units. Now the future of this study would be to extend the project based improved OTL program to large and very large organizations, and still more to consider cross cultural and continental factors.
Finally, it would be interesting to do a quantitative survey and analysis of the different purposes for, and frequency of implementing the project based OTL in software development companies. This could help to find precisely in what domains our conclusions are applicable
Acknowledgment
The authors wish to thank the Software development companies and two universities for permitting us to carry out the surveys and implement a few processes.
References Evaluating the Project based Organizational Teaching-Learning Process
- Aaron J. Shenhar, Dov Dvir, Ofer Levy and Alan C. Maltz, “Project Success: A Multidimensional Strategic Concept”, Long Range Planning, Vol. 34, 699-725, 2001.
- Arent, J., Iversen, C. Andersen, and S. Bang, "Supporting Software Process Improvement with Project Assessments” presented at HICSS, Hawaii, 2000.
- Atkinson. R, “Project management: cost, time and quality, two best guesses and a phenomenon. Its time to accept other success criteria”, International Journal of Project Management, Vol. 17, pp. 337–342, 1999.
- Bhattacharyya. G.K., and R.A. Johnson, Statistical Concepts and Methods, Wiley Series in Probability and Statistics. Wiley-Interscience, NY, 1977.
- Alexandra Luciana Guţă, “The Learning Organization – An Answer to the Challenges of the Actual Business Environment”, CES Working Papers, Vol. 4, No. 3, 2012. Accessed on Feb 2013: http://www.cse.uaic.ro/WorkingPapers/articles/CESWP2012_IV3_GUT.pdf
- Argote, L., “Organizational learning research: Past, present and future”, Management Learning, vol. 42, no. 4, pp. 439-446, 2011. Available Online: http://mlq.sagepub.com/content/42/4/439.abstract.
- Bitter-Rijpkema, M., Retalis, S., Sloep, P., Sie, R., Katsamani, M., & van Rosmalen, P. A New Approach to Collaborative Creativity Support of New Product Designers. International Journal of Web Based Communities, Vol.7, No. 4, pp. 478-492, 2011
- CMMI of Development, ver 1.2, SEI, Pitsburgh, 2006, PA 15213-390, CMU/SEI-2006-TR-008.
- Conte. S.D., H.E. Dunsmore, and V.Y. Shen, Software Engineering Metrics and Models, Benjamin/Cummings Publishing, Menlo Park, CA, 1986.
- David N Card, “Research Directions in Software Process Improvement”, Proc. 28th Annual International Computer Software and Application Conference, 2004.
- Emam. K.E., J.N. Drouin, and W. Melo, “SPICE:The Theory and Practice of Software Process Improvement and Capability Determination”. IEEE Computer Society, Los Alamitos, 1998.
- Eric, Martin and Stephen, “Integration of E-Learning and Knowledge Management – Barriers, Solutions and Future Issues”, Proc. 3rd Conference Professional Knowledge Management - Experiences and Visions, Berlin, Springer, 2005.
- Fenton. N. and Pfleeger, Software Metrics: A Rigorous & Practical Approach, 2nd edn, PWS Publishing Company, Boston, ISBN 0-534-95425-1, 1999.
- Fitzgerald. B., Y. O'Kane, “A Longitudinal Study of Software Process Improvement”, IEEE Software, pp. 37-45, May/June 1999.
- Jantke. K, A. Lunzer, and J. Fujima, “Subjunctive Interfaces in Exploratory e-Learning”, Lecture Notes in Artificial Intelligence, Springer-Verlag, Berlin Heidelberg, New York, 2005.
- Jesper Arent, and Jacob Norbjerg., “Software Process Improvement as Organizational Knowledge Creation: A Multiple Case Analysis”, Proc. of the 33rd Hawaii International Conference on System Sciences, 2000.
- Jones, R., Ghani, R., Mitchell, T., Riloff, E., “Active Learning for Information Extraction with Multiple View Features Sets”, Proc. of Adaptive Text Extraction and Mining, EMCL/PKDD-03, Cavtat-Dubrovnik, Croatia, pp.26-34, 2003.
- Joost Schalken, Sjaak Brinkkemper, and Hans van Vliet, “Using Linear Regression Models to Analyse the Effect of Software Process Improvement”, Source:www.cs.vu.nl/~hans/publications/y2006/profes-2006.pdf
- Kellyann Jeletic, Rose Pajerski and Cindy Brown, “Software Process Improvement Guidebook”, NASA, Greenbelt, Maryland, March 1996.
- Stuart C. Grant, A Constructive Approach to Organizational Learning in a Tactical Operations Centre, PsychNology Journal, Volume 10, Number 1, pp.7–22, 2012.
- Sessa, V.I., London, M., Pingor, C., Gullu, B., Patel, J., “Adaptive, generative, and transformative learning in project teams”, Team Performance Management, vol. 17, no. 3/4, pp. 146 – 167, 2011, accessed on Jan 2013 at 10.1108/13527591111143691.
- Sloman, Martyn – Focus on the Learner – Change Agenda (CIPD, London, 2003). Available online:
- Vӓlimaa J., Hoffman D., “Knowledge society discourse and higher education”, Higher Education, vol. 56, no. 3, pp. 265-285, 2008. Aaccessed on Jan 2013 at 10.1007/s10734-008-9123-7
