Evaluating the Undergraduate Course based on a Fuzzy AHP-FIS Model

Author: Yan Liu, Xin Zhang
Journal: International Journal of Modern Education and Computer Science @ijmecs
Article in issue: 6 vol.12, 2020.
Free access
Course evaluation is a critical part of undergraduate curriculum in computer science. Most existing evaluation methods are based on questionnaire by analyzing the satisfaction rate of the respondents. However, there are many indicators such as attendance rate, activity level and average score that can reflect the overall effectiveness of the course. Limited research has taken all those indicators into account during course evaluation. This research chooses an innovative perspective that considers course evaluation as a multiple criteria decision-making problem. A hybrid model is proposed to measure the course effectiveness regarding various indicators. The indicators are first prioritized by a fuzzy Analytic Hierarchical Process (AHP) model which applies fuzzy numbers to deal with the uncertainty brought by subjective judgement. A hierarchical fuzzy inference system (FIS) is then designed to evaluate the course effectiveness, which reduces the number of the fuzzy IF-THEN rules and increases the efficiency compared to the traditional FIS. A numerical example is presented to demonstrate the application. The proposed model helps not only judge an individual course based on a comprehensive view but also rank multiple courses.
Course evaluation, fuzzy AHP, hierarchical FIS, decision-making, MCDM
Short address: https://sciup.org/15017611
IDR: 15017611 | DOI: 10.5815/ijmecs.2020.06.05
Text of the scientific article Evaluating the Undergraduate Course based on a Fuzzy AHP-FIS Model
Higher education is dedicated to prepare students for future jobs, especially those requiring high-tech and broad knowledge. Nowadays, with the growth in digitalization and automation, the graduates from computer science is of great demand [1] . It is essential to design undergraduate curriculum with qualified courses and teaching resources so as to meet the education goal in computer science. This paper aims to help analyse the quality of a course from multiple aspects.
Course evaluation is a critical part of the curriculum design, which analyses the course effect and judges if a course meets its expected settings. The most widely used method for course evaluation is student evaluations of teaching (SET) [2] . It assesses the quality of the instruction and teaching performance as well based on the satisfaction rate of students [3] . However, there are also other indicators that reflect the overall effectiveness of the course. For example, attendance rate and activity level could indicate to what extent the students are interested in the course. Average score or score distribution shows whether the student have mastered what they were taught. In this case, course evaluation turns into a multiple criteria decision-making (MCDM) problem by considering various indicators.
Many decision-making methods for evaluation are available. Dai and Blackhurst [4] apply Analytic Hierarchy Process (AHP) to measure the performance of suppliers and rank them according to the calculated scores. Faramarzi, et al. [5] suggest a network Data Envelopment Analysis (DEA) model to determine the sustainable performance of cycle power plants. Due to the subjective judgement, the decision process needs to deal with uncertainty. Thus, fuzzy set theory is often used. Liao, et al. [6] develop a method based on fuzzy inference system with process capability index for supplier evaluation. Orji and Wei [7] combine triangular fuzzy numbers and Technique for Order of Preference by Similarity to Ideal Solution (TOPSIS). Singh, et al. [8] propose a method based on fuzzy AHP to compare alternative locations and select the best one out of them for optimisation. Balusa and Gorai [9] establish a fuzzy model for mining methods ranking. Though these decision-making methods have been applied in many fields, limited research have adopted them to course evaluation. To fill this gap, this research proposes a hybrid model to measure the course effect, taking into various indicators into account. These indicators are first prioritised by fuzzy AHP which applies fuzzy numbers to deal with the uncertainty brought by subjective judgement. A hierarchical fuzzy inference system is then suggested to evaluate the course effectiveness, where the indicator weights are considered when constructing the fuzzy IF-THEN rules. This paper contributes to the literature by considering course evaluation problem from a MCDM perspective and proposing a fuzzy AHP-FIS model to solve this problem.
The rest of this paper is organised as follows. Section 2 discusses the related works on course evaluation. Section 3 presents the preliminaries for building the hybrid model, including the principles of fuzzy set and fuzzy inference system (FIS). The model integrating fuzzy AHP and hierarchical FIS is introduced in section 4, followed by an illustrative example in section 5. Section 6 concludes the paper.
2. Related Works
Course effect is mostly evaluated by SET, a questionnaire-based method. A five-level Likert scale (i.e. strongly disagree, disagree, neither agree nor disagree, agree and strongly agree) is generally used to indicate to what extent the respondents agree with the statement. Antonanzas-Baztan, et al. [10] investigate global satisfaction with the course and satisfaction with particular aspects, such as instructors and organisation, using a questionnaire. Na, et al. [11] assess the laboratory course content for better outcome attainment by analysing the students’ feedback on the open-ended experiments. Emiroglu and Sahin [12] collect and analyse students’ opinions about the lab sessions of computer networks course, which shows whether the students were happy to be involved in practical applications of computer networks subjects. While it is widely applied in institutions of higher education, this SET method has received argument and doubt on whether the result reflets an objective measurement on course effect and teaching quality [2, 13, 14] . Few researchers have considered this evaluation problem as a MCDM problem.
Kaushik [15] applies a conceptual framework to evaluate a first-year engineering course, which helps to identify the essential aspects or concepts in a course but lacks a detailed method for effect evaluation. Ramli, et al. [16] adopt Fuzzy Jaccard Ranking Index to measure teaching performance, which helps to compare and rank different instructors from the perspective of students. Chen, et al. [17] present an approach based on fuzzy AHP and comprehensive evaluation method for teaching performance evaluation. They consider various indicators such as planning and preparation, communication and interaction and professionalism. However, the core technique used for calculating the weights in their approach, i.e. extent analysis method, is problematic because it could produce invalid results [18] . Zhu, et al. [19] compute the teaching performance based on fuzzy data envelopment analysis (DEA) method. They take basic teaching level, high-level education background, high-level professional title and scientific research level of teachers as input, and number of scientific research projects, number of papers published publicly, quality of employment and quality of enrolment as output. The results could help the university strengthen the understanding of subordinate colleges, but the research focuses on college level rather than course level. Fuentes, et al. [20] evaluate the learningteaching technical efficiency by proposing a three-stage DEA model, which more focus on the identification of key performance indicators.
Among the MCDM methods, AHP proposed by Saaty [21] has been applied extensively in a number of fields [22, 23] . It outperforms by ease of use, structuring problem systematically and calculating criteria weights as well as alternative priorities. Fuzzy AHP, applying fuzzy numbers to AHP, maintains the advantage of AHP and is capable to deal with the uncertainty during the decision process. Many researchers have applied this model for evaluation. For example, Lofti et al [24] use fuzzy AHP to analyse the key factors to mobile health adoption. Ebrahimi and Taheri [25] select database management system with fuzzy AHP. Nagpal et al. [26] rank the university websites by adopting a fuzzy AHP based model. The decision process is an inference process. FIS is an efficient tool to build such an expert system [27, 28] . It maps the input (performance data with respect to each indicator) to the output (crisp value representing the overall performance) through a set of IF-THEN rules. To the best of our knowledge, limited research has integrated fuzzy numbers, AHP and FIS for course evaluation.
3. Preliminaries 3.1. Fuzzy set and triangular fuzzy number
Fuzzy set theory proposed by Zadeh [29] is a capable theory for handling imprecision during the decision-making process. A fuzzy set which consists two components, a set of elements x and an associated membership function. Triangular fuzzy numbers (TFNs) is a special class of fuzzy set, which describe the linguistic expressions better than crisp values. For example, ‘strong importance’ is represented by TFN (4, 5, 6) instead of a crisp scale ‘5’ in AHP. In this case, the uncertainty of a judgement could be included by the intervals [4, 5] and [5, 6] with their corresponding membership degrees. The preliminaries of fuzzy set theory for this research are as follows [30, 31] .
Definition 1 . Given a universal set X , a fuzzy set A in X is a set of ordered pairs as equation (1). x represents the element in the universal set and µ ( x ) is the associated membership function which assigns to x a value between 0 and 1
as its membership.
A = {( x , ^ (x )) | x G X }
Definition 2 . A triangular fuzzy number (TFN), A , can be expressed as a triple ( l , m , h ) where l and h are the least and largest values respectively with the smallest membership and m is the value with the largest membership. The membership function µ ( x ) of a TFN A = ( l , m , h ) is defined as follows.
M ( x ) =
( x - l )/( m - l ), ( h - x )/( h - m ),
l < x < m m < x < h
Definition 3 . A trapezoidal fuzzy number (TraFN), A , can be expressed as a quadruple ( l , m l , m h , h ) where l and h are the least and largest values respectively with the smallest membership and ml and mh are the two boundary values with the largest membership. The membership function µ ( x ) of a TraFN is defined as follows.
f ( x - l )/( mT - l ), l < x < mz
^(x) = ] 1, mi < x < mh
[ ( h - x )/( h - mh ), mh < x < h
Definition 4. The α-cut set of a fuzzy set A , denoted as A , is a crisp value set containing all the elements with membership degrees greater than or equal to the specified value of α:
Aa = {x | ^( x) ^ a}
Definition 5. Based on the previous definitions, the α-cut set of a TFN can be represented as an interval, which helps defuzzify a TFN.
Aa = [l + (m - l)a, h - (h - m )a ]
Definition 6 . Let A , = ( lx , mx ,\) and A2 = ( l 2, m 2, h 2) be two TFNs. The algebraic operations on TFNs are as follows:
Addition:
A1 Ф A2 = (l1, m 1, h1) © (12, m 2, h2) = (11 + 12, m 1 + m 2, h1 + h2)
Multiplication:
A1 ® A2 = (11, m 1, h1) ® (12, m 2, h2) = (1112, m 1 m 2, h1 h2)
X ® A1 = X ® (lx, m1, h1) = (X, X, X) ® (lx, m1, h) = (ХЦ, 2m1, Xhx) where X is a constant
Reciprocal:
Ai -1 = (11, m 1, h1) -1 = (1/h1 ,1/m 1 ,1/11)
Definition 7 . If there are multiple conjunctive antecedents, i.e. IF x1 is A AND x2 is A …AND xn is A THEN y is b , then the condition part can be evaluated by
^A ( x 1, x 2,..., xn ) = min{ Цд ( x 1), ^A ( x 2),..., ^A ( xn )}
Definition 8 . In the case of a disjunctive system of rules where the satisfaction of at least one rule is required, the rules are connected by the ‘‘or’’ connectives. The aggregated output is obtained by the fuzzy union of all individual rule contributions, and the membership function is defined as
Ц y (y) = max{ ц У1 ( y 1 ), ц y 2 (y 2 ),..., ц yr ( y r )}
-
3.2. Fuzzy inference system (FIS)
There are five components in a FIS as shown in Fig. 1. The figure also presents the inference process from input to output.
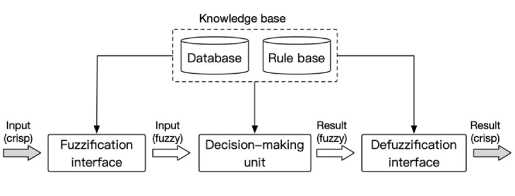
Fig. 1. FIS components and working principle
• Fuzzification interface transforms the crisp inputs into the degrees of match with the linguistic variables. The transformation is according to the predefined fuzzy sets in the Database.
• Database defines the membership functions of the fuzzy sets used in the fuzzification and the fuzzy rules. Various function shapes are available such as triangular, trapezoidal and bell.
• Rule base contains a number of fuzzy IF–THEN rules. The rules are in the format of ‘IF x is P , THEN y is Q ’, where P and Q are fuzzy propositions(sets). This is the core part of the FIS.
• Decision-making unit performs the inference operations on the rules. It calculates the output of a fuzzy rule with multiple antecedents and further aggregates multiple rules for a final result.
• Defuzzification interface which transforms the fuzzy results of the inference into a crisp output. There are various applicable methods including Centroid method, max membership principle, weighted average and mean of maxima[32].
4. The Proposed Hybrid Model for Course Evaluation
4.1. Research methodology4.2. Weighting the course indicators by fuzzy AHP
This research follows a systematic way of conducting research, starting from problem analysis to solution design and validation. How to evaluate course effectiveness is a key question when designing the curriculum in computer science. To solve this problem, this research has reviewed the related literature to explore the available methods. Fuzzy number, AHP and FIS are chosen to build the evaluation model, which consists of two parts, as illustrated in Fig. 2. The first one weights the course indicators and the other one evaluates the course effect.
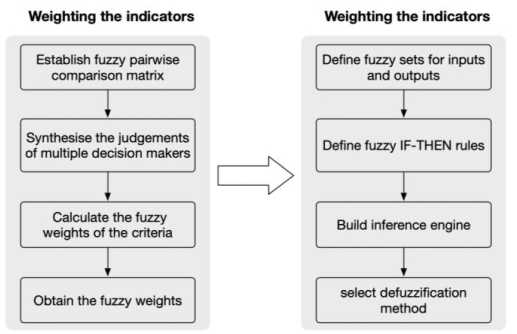
Fig. 2. The proposed hybrid model
Step 1 : Establish the fuzzy pairwise comparison matrix. Let F = [ c ]йхй be the matrix for n evaluation indicators. c is a fuzzy set representing the relative importance of indicator i over j . Its reciprocal, 1/ c , is equal to the relative importance of criterion j over i , c . 9 level-scale is applied as listed in Table 1.
Table 1. Scale for relative importance
|
Linguistic expression |
TFN |
|
Extremely more important |
(8,9,9) |
|
Very strongly more important |
(6,7,8) |
|
Strongly more important |
(4,5,6) |
|
Moderately more important |
(2,3,4) |
|
Equally important |
(1,1,1) |
|
Intermediate values |
(1,2,3), (3,4,5), (5,6,7), (7,8,9) |
Step 2 : Synthesise multiple judgements of different decision makers. Let C t = ( i t , m t , h . ) be the relative importance of indicator i over j judged by decision maker t and q be the number of the decision makers. Equation (12) synthesises the judgements for the overall relative importance of i over j .
q 1q 1q
c j = ( l j , m j , h j ) = (( П 0 q ,( П m j ) q ,( П hj^ q ^
t=1 t=1
Step 3 : Calculate the fuzzy weights of each indicator. Geometric mean as equation (13) is applied to derive the fuzzy weight w of indicator i from the fuzzy pairwise comparison.
n 1n 1n
w, = (/„m,,h) = ((П jn.(П mj)”,(П hj)” ) j=1 j=1
Step 4 : Obtain the crisp weights. The fuzzy weights from previous step is defuzzified to a single value as the crisp weight wi of indicator i by the centroid method.
F ( W. ) = ( l. + 2 m. + h. )/4
wi = F ( wi у S F ( w j )
-
4.3. Evaluating the course effect by FIS
-
4.3.1. Membership functions for inputs and outputs
The number of rules increases significantly when the number of the preconditions goes up. Suppose that there are m preconditions and the evaluation scale of preconditions is p level, then the number of rules is pm . If there are three preconditions and the scale is of 3 levels, there are 27 rules in total. If there are 4 preconditions and other settings remain unchanged, there will be 81 rules. Therefore, this research establishes a hierarchical FIS for course effect evaluation as illustrated in Fig. 3.
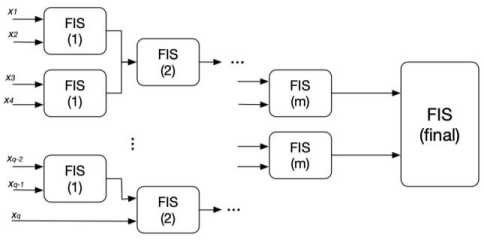
Fig. 3. The hierarchical FIS model
A 4-level linguistic rating variables are applied for both inputs and outputs, i.e. Excellent, Good, Medium and Poor, which are equivalent to the TFNs and TraFNs defined on the unit interval [0, 1]. The four levels are derived from the scale commonly used for rating the performance of students or instructors in university. Table 2 lists the correspondent fuzzy numbers for the rating. [0, 1] is the internal used for normalising the values, which makes the values of different units comparable.
Table 2. Linguistic rating variables and fuzzy number
|
Linguistic expression |
Fuzzy number |
|
Excellent |
(0.9, 1, 1) |
|
Good |
(0.7, 0.8, 0.9, 1) |
|
Medium |
(0.5, 0.6, 0.7, 0.8) |
|
Poor |
(0, 0, 0.5, 0.6) |
-
4.3.2. Fuzzy rules for the model
-
4.3.3. Inference process
The fuzzy IF-THEN rules map the inputs to the outputs. The rules are constructed based on two principles. The first one is on the basis of averaging concept. If the performance against indicator i is good and that against indicator j is poor, then output of the FIS is medium. The second one considers the weights of the indicators of the corresponding inputs. The output is inclined towards the one with more weight. For example, in case that indicator i weights more than indicator j, the output is good, if the performance against indicator i is good and that against indicator j is medium. Table 3 presents the fuzzy rules in this research. w f stands for the weight of the first input whereas w s is for the weight of the first input.
Table 3. Fuzzy rules for the model
|
The second input |
|||||
|
Excellent |
Good |
Medium |
Poor |
||
|
The first input |
Excellent |
Excellent |
Excellent ( w f > w s ); Good ( w f ≤ w s ) |
Good |
Medium |
|
Good |
Good ( w f > w s ); Excellent ( w f ≤ w s ) |
Good |
Good ( w f > w s ); Medium ( w f ≤ w s ) |
Medium |
|
|
Medium |
Good |
Medium ( w f > w s ); Good( w f ≤ w s ) |
Medium |
Medium ( w f > w s ); Poor w f ≤ w s ) |
|
|
Poor |
Medium |
Medium |
Poor ( w f > w s ); Medium ( w f ≤ w s ) |
Poor |
|
The inference process deduces the aggregated result. The Mamdani’s inference engine is adopted, the procedure of which is as follows. Suppose the i th rule is
IF x 1 is A AND x 2 is A THEN y i is B
In the rule, x 1 and x 2 are the two crisp inputs; y i stands for the consequence; A , A and B are the predefined fuzzy sets of linguistic expressions for the two inputs and the consequence correspondingly.
Step 1 : Calculate the rule strength for each rule. The rules strength is
-
s . = ^ ( x 1 , x 2 ) = min( ^ ( x 1 ), ^ ( x 2 )) (15)
Where цА (xt ) and цА ( x 2) are the membership functions of the two fuzzy sets for inputs, i.e. An and An .
Step 2: Deduce the consequence of the ith rule as ri = min(s., MBi (y)) (16)
Where ^ ( y ) is the membership function of the fuzzy set for consequence Вг .
Step 3 : Produce the overall fuzzy output as
R = max( r ), i = 1,2,..., n
Where n is the number of the fuzzy IF-THEN rules.
4. 3.4 Defuzzification
5. Illustrative Case
Compared with a fuzzy value, a crisp value is more intuitive for the final result. This research applies the Centroid method, also called as centre of area (COA) or centre of gravity (COG), for defuzzification, which is the most prevalent defuzzification method [32] . Equation (19) explains the underlying principle where x* is the defuzzified value, x indicates the element, and μ ( x ) is its associated membership function.
* x
J ц ( x ) x d x J ц ( x )d x
This section presents an illustrative case to demonstrate the application of proposed model. The case is from the university where the authors work. Computer operating system is a compulsory course for undergraduates in the School of Computer Science and Technology. It provides the theoretical foundation for system software development and is considered as a core professional course in the curriculum. Questionnaire is usually used to collect student satisfaction for analysing the course effect. However, it could not provide an objective and comprehensive profile. The proposed model is applied to evaluate the course instead of the traditional questionnaire-based way. Table 4 lists the indicators used for evaluation.
Table 4. The indicators used in the case
|
No. |
Indicator |
Explanation |
Original evaluation scale |
|
I1 |
Clarity |
The clarity level on what should be learned |
1 to 5 for very unclear, not clear, medium, clear, very clear |
|
I2 |
Achievement |
The achievement level on what has been learned from the lecture regarding the learning goal |
1 to 5 for very poor, poor, medium, good, very good |
|
I3 |
Responsiveness |
The level of responsiveness of the instructor to the students |
1to 5 for very insufficient, insufficient, medium, sufficient, very sufficient |
|
I4 |
Attendance |
The overall attendance rate |
Percentage from 0 to 100% |
|
I5 |
Activity |
The level of students participating in the class activities |
Unit interval [0, 1] |
|
I6 |
Score |
The average score of the students in the final exam |
0 to 100 points |
-
5.1 . The Case Data
Student satisfaction in the studied case was analysed from three aspects, i.e. clarity (I1), achievement (I2) and responsiveness (I3), which were all analysed from the perspective of students. Questionnaire were sent out to the students who were asked to rate the course based on the 5-level Likert scale. Attendance (I4) and score (I6) are objective indicators, the value of which came from the statistics. Activity (I4) is a subjective indicator judged by the instructor. The values against the indicators are calculated as follows.
-
• Clarity , achievement and responsiveness . The investigation results are shown in Fig. 4. The percentage represent how many students choose the corresponding statement. For example, ‘83.96%’ in Figure 4 (a) means that 83.96% of the students considered the learning goal very clear. The five linguistic expressions correspond to the numbers from 1 to 5 (the higher the better). The value against each indicator is calculated by equation (20). p i is the percentage of students and s i is the number corresponding to the linguistic expression. The values of Clarity, achievement and responsiveness are 4.79, 4.91 and 4.9 respectively.
V = E p i x s i = 1
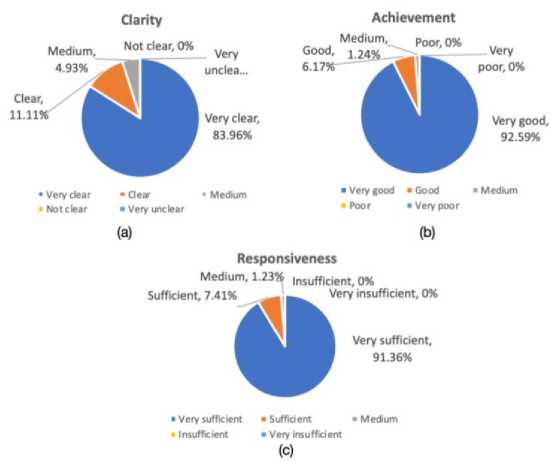
Fig. 4. The investigation result of (a) Clarity, (b) Achievement and (c) Responsiveness
-
• Attendance . The attendance rate of each lecture is the ratio of the number of the students who have attended over the number of the students who should attend. The overall rate is then calculated by taking the average. In the case, it is 99.5%
-
• Activity. It is judged by the lecturer according to the performance of the students during the lecture, for example, whether the students are active to answer the questions. The value is 0.85.
-
• Score . It is calculated by taking the average score of the students in the final exam, i.e. the sum of the score of each individual student divided by the number of the students. The value is 78.58.
-
5.2 The Course Effect Measurement
All the values are normalised into the unit interval, as listed in the column of ‘normalised value’ in Table 5. Linear normalisation method is applied.
Table 5. The data used in the case
|
No. |
Indicator |
Original value |
Normalised value |
Weight |
|
I1 |
Clarity |
4.79 |
0.958 |
0.131 |
|
I2 |
Achievement |
4.91 |
0.982 |
0.285 |
|
I3 |
Responsiveness |
4.9 |
0.98 |
0.121 |
|
I4 |
Attendance |
99.5% |
0.995 |
0.047 |
|
I5 |
Activity |
0.85 |
0.85 |
0.076 |
|
I6 |
Score |
78.58 |
0.7858 |
0.34 |
The indicators are firstly weighted by fuzzy AHP, the results of which are shown in the last column of Table 4. The fuzzy weights are calculated by equation (13) and then translated to crisp weights by equation (14). The hierarchical fuzzy inference system is then built with help of the fuzzy tool box in Matlab, as shown in Fig. 5.
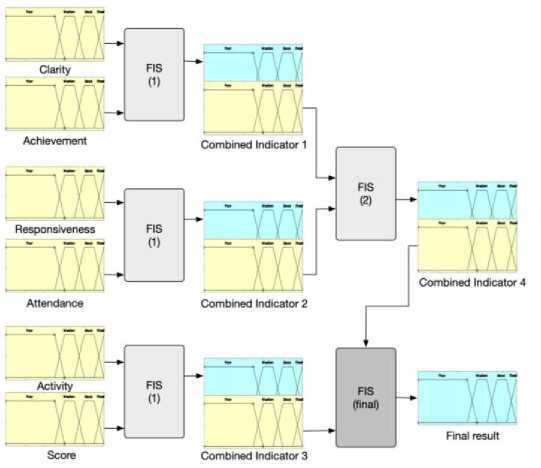
Fig. 5. The hierarchical FIS model for evaluation
The obtained data are passed into the first level FIS engines, the outputs of which are used as the inputs into the engines of the next level. Fig. 6 presents the structure of rules viewer in the model and the output result with Clarity and Achievement in the case. There are 16 rules in total for each FIS engine to produce the output since a four-level scale is applied.
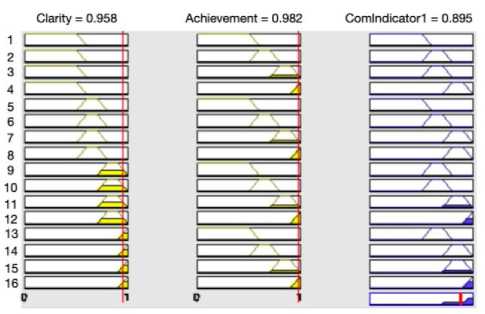
Fig. 6. Rule viewer and result with input Clarity and Achievement
The final result is obtained by integrating the input values of the two combined indicators as shown in Fig. 7, which is 0.85. This value lies in the both the range of ‘Good’ with the membership degree of 1.
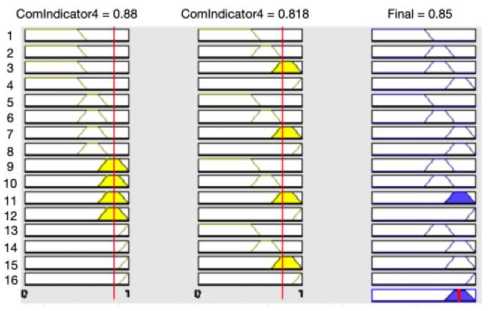
Fig. 7. The final result
The output result increases as the input values increase. Fig. 8 illustrates the two input variables (i.e. ComIndicator 3 and ComIndicator 4) and one output variable (i.e. the final), which all vary from 0 to 1. As the values of the combined indicators go up, the value measured for the course effect also get larger.
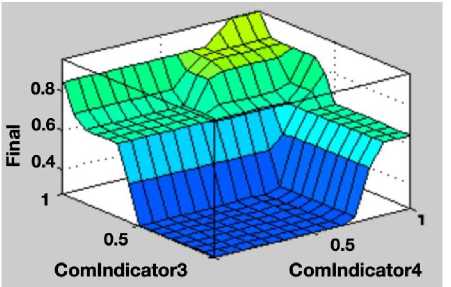
Fig. 8. The 3-D surface view of the final output
5.3 Result Discussion
6. Conclusions
According to the weight analysis, the rank of the six indicators is Score > Achievement > Clarity > Responsiveness > Activity > Attendance. Score is the foremost indicator for course effect. This is reasonable for that it can objectively reflect to what extent the students have mastered what they have been taught. Achievement ranks in the second but the weight is much higher than the rest four. These top 2 indicators are related to the knowledge level the students have obtained. This indicates that knowledge attainment of the students plays a key role in evaluating the course. Activity and Attendance are of the least weights. This corresponds to the reality of the following considerations. On one hand, there are not many activities for students during the class due to the limit of lecture hours of the course of Operating Systems. This situation actually happens to most courses in the school. On the other, though high quality of teaching attracts more students, they could still fully attend hoping to the part of the score of the attendance, even if the course is not so attractive.
The final evaluation result shows the course effect of Operating Systems is good. The value under indicator Score is in both range of ‘Good’ and ‘Medium’ with a higher membership degree in ‘Good’, which is the lowest among the all. The values under Achievement, Clarity and Responsiveness, whose weights are relatively large, are quite high. This adds up the overall result.
Compared with a traditional FIS, the calculation efficiency of the proposed model is greatly improved by reducing the number of the fuzzy rules. In the illustrative case, there are five FIS engines through hierarchy, each of which has 16 rules. Totally 16*5 (i.e. 80) rules are applied. However, there would be 46 rules without the hierarchy. Moreover, more conditions in the rule would lead to the difficulty in designing the fuzzy rules in traditional FIS. For example, if the Clarity is Good, Achievement is Medium, Responsiveness is Excellent, Attendance is Good, Activity is Poor, and Score is Medium, it would be difficult to determine the consequence.
Course evaluation has attracted much attention when designing the curriculum. Different from most research in course evaluation, this paper considers this problem as a multiple criteria decision-making problem and proposes a hybrid evaluation model for course effect. The first part of the model weights the indicators by fuzzy AHP method. It helps the decision-makers to consider which indicators would play a more important role in the evaluation, especially the pairwise comparison procedure. The other part is the hierarchical FIS to calculate the effect score. The combination of fuzzy AHP and FIS, on one hand, avoid the problem of rank reversal of AHP. On the other, it greatly reduces the number of the rules through the design of hierarchy. In addition, using fuzzy numbers instead of crisp numbers handles the uncertainty of subjective judgement. The application to the case of evaluating the effect of Operating Systems Course validates the proposed model. The model can also be extended to rank multiple courses or instructors by passing their data into the model and comparing their output values.
This research takes a four-level scale to rate the performance against each indicator, which is represented by four fuzzy numbers. Though this choice corresponds to the scale commonly adopted to rate the performance of students or instructors in university, it would be an interesting piece of future work to apply different scales and analyse the results.
References Evaluating the Undergraduate Course based on a Fuzzy AHP-FIS Model
- I. A. Khan et al., "Redesign and validation of a computer programming course using Inductive Teaching Method," PloS one, vol. 15, no. 6, p. e0233716, 2020, doi: 10.1371/journal.pone.0233716.
- M. Goos and A. Salomons, "Measuring teaching quality in higher education: assessing selection bias in course evaluations," Research in Higher Education, vol. 58, no. 4, pp. 341-364, 2016, doi: 10.1007/s11162-016-9429-8.
- M. Nicolaou and M. Atkinson, "Do student and survey characteristics affect the quality of UK undergraduate medical education course evaluation? A systematic review of the literature," Studies in Educational Evaluation, vol. 62, pp. 92-103, 2019, doi: 10.1016/j.stueduc.2019.04.011.
- J. Dai and J. Blackhurst, "A four-phase AHP–QFD approach for supplier assessment: a sustainability perspective," International Journal of Production Research, vol. 50, no. 19, pp. 5474-5490, 2012, doi: 10.1080/00207543.2011.639396.
- G. R. Faramarzi, M. Khodakarami, A. Shabani, R. Farzipoor Saen, and F. Azad, "New network data envelopment analysis approaches: an application in measuring sustainable operation of combined cycle power plants," Journal of Cleaner Production, vol. 108, pp. 232-246, 2015, doi: 10.1016/j.jclepro.2015.06.065.
- M.-Y. Liao, C.-W. Wu, and J.-W. Wu, "Fuzzy inference to supplier evaluation and selection based on quality index: a flexible approach," Neural Computing and Applications, vol. 23, no. S1, pp. S117-S127, 2013, doi: 10.1007/s00521-012-1266-x.
- I. J. Orji and S. Wei, "An innovative integration of fuzzy-logic and systems dynamics in sustainable supplier selection: A case on manufacturing industry," Computers & Industrial Engineering, vol. 88, pp. 1-12, 2015, doi: 10.1016/j.cie.2015.06.019.
- R. K. Singh, N. Chaudhary, and Nikhil Saxena "Selection of warehouse location for a global supply chain: A case study," IIMB Management Review, 2018, doi: 10.1016/j.iimb.2018.08.009.
- B. C. Balusa and A. K. Gorai, "Sensitivity analysis of fuzzy-analytic hierarchical process (FAHP) decision-making model in selection of underground metal mining method," Journal of Sustainable Mining, vol. In press, 2018, doi: https://doi.org/10.1016/j.jsm.2018.10.003.
- E. Antonanzas-Baztan et al., "Design, implementation and evaluation of an education course to promote professional self-efficacy for breastfeeding care," Nurse education in practice, vol. 45, p. 102799, May 2020, doi: 10.1016/j.nepr.2020.102799.
- G. Na, S. Shankarb, and S. G. Bb, "Structured Evaluation of Laboratory Course Content for Better Attainment of Program Outcomes," Procedia Computer Science, vol. 172, pp. 869-874, 2020.
- B. G. Emiroglu and S. Sahin, "Analysis of Students’ Performances during Lab Sessions of Computer Networks Course," Educational Technology & Society, vol. 16, no. 3, 2013.
- P.-T. Oon, B. Spencer, and C. C. S. Kam, "Psychometric quality of a student evaluation of teaching survey in higher education," Assessment & Evaluation in Higher Education, vol. 42, no. 5, pp. 788-800, 2016, doi: 10.1080/02602938.2016.1193119.
- K. Young, J. Joines, T. Standish, and V. Gallagher, "Student evaluations of teaching: the impact of faculty procedures on response rates," Assessment & Evaluation in Higher Education, vol. 44, no. 1, pp. 37-49, 2018, doi: 10.1080/02602938.2018.1467878.
- M. Kaushik, "Evaluating a First-Year Engineering Course for Project Based Learning (PBL) Essentials," Procedia Computer ence, vol. 172, pp. 364-369, 2020.
- N. Ramli, D. Mohamad, and N. H. Sulaiman, "Evaluation of Teaching Performance with Outliers Data using Fuzzy Approach," Procedia - Social and Behavioral Sciences, vol. 8, pp. 190-197, 2010, doi: 10.1016/j.sbspro.2010.12.026.
- J.-F. Chen, H.-N. Hsieh, and Q. H. Do, "Evaluating teaching performance based on fuzzy AHP and comprehensive evaluation approach," Applied Soft Computing, vol. 28, pp. 100-108, 2015, doi: 10.1016/j.asoc.2014.11.050.
- Y. Liu, C. M. Eckert, and C. Earl, "A review of fuzzy AHP methods for decision-making with subjective judgements," Expert Systems with Applications, vol. 161, p. 113738, 2020/12/15/ 2020, doi: https://doi.org/10.1016/j.eswa.2020.113738.
- W. Zhu, M. Wan, Y. Zhou, and W. Pan, "Fuzzy computation of teaching performance based on data envelopment analysis method," Cognitive Systems Research, vol. 52, pp. 351-358, 2018, doi: 10.1016/j.cogsys.2018.07.018.
- R. Fuentes, B. Fuster, and A. Lillo-Bañuls, "A three-stage DEA model to evaluate learning-teaching technical efficiency: Key performance indicators and contextual variables," Expert Systems with Applications, vol. 48, pp. 89-99, 2016, doi: 10.1016/j.eswa.2015.11.022.
- T. L. Saaty, "The analytic hierarchy process: planning, priority setting, resources allocation," New York: McGraw, 1980.
- N. Subramanian and R. Ramanathan, "A review of applications of Analytic Hierarchy Process in operations management," International Journal of Production Economics, vol. 138, no. 2, pp. 215-241, 2012, doi: 10.1016/j.ijpe.2012.03.036.
- A. Emrouznejad and M. Marra, "The state of the art development of AHP (1979–2017): a literature review with a social network analysis," International Journal of Production Research, vol. 55, no. 22, pp. 6653-6675, 2017, doi: 10.1080/00207543.2017.1334976.
- "1-s2.0-S1877050920313855-main.pdf."
- M. Ebrahimi and M. Taheri, "Selection of Database Management System with Fuzzy-AHP for Electronic Medical Record," I.J. Information Engineering and Electronic Business, vol. 5, pp. 1-6, 2015.
- R. Nagpal, D. Mehrotra, Pradeep, K. Bhatia, and A. Sharma, "Rank University Websites Using Fuzzy AHP and Fuzzy TOPSIS Approach on Usability," International Journal of Information Engineering & Electronic Business, vol. 7, no. 1, pp. 29-36, 2015.
- S. Mustapha, K. M. Fayçal, and S. Mohammed, "Sequential Adaptive Fuzzy Inference System Based Intelligent Control of Robot Manipulators," International Journal of Intelligent Systems & Applications, vol. 6, no. 11, pp. 49–78, 2014.
- F. Boufera, F. Debbat, N. Monmarché, M. Slimane, and M. F. Khelfi, "Fuzzy Inference System Optimization by Evolutionary Approach for Mobile Robot Navigation," International Journal of Intelligent Systems and Applications, vol. 10, no. 2, pp. 85-93, 2018.
- L. A. Zadeh, "Fuzzy sets," Information and control, vol. 8, no. 3, pp. 338-353, 1965.
- A. Kaufmann and M. Gupta, Introduction to Fuzzy Arithmetic. Theory and Applications. New York: Van Nostrand Reinhold, 1991.
- G. Klir and B. Yuan, Fuzzy sets and fuzzy logic. Prentice Hall New Jersey, 1995.
- T. J. Ross, Fuzzy Logic with Engineering Applications, 2nd Edition ed. John Wiley & Sons Ltd, 2004, p. 78.
