Evaluation of different machine learning methods for caesarean data classification

Author: O.S.S. Alsharif, K.M. Elbayoudi, A.A.S. Aldrawi, K. Akyol
Journal: International Journal of Information Engineering and Electronic Business @ijieeb
Article in issue: 5 vol.11, 2019.
Free access
Recently, a new dataset has been introduced about the caesarean data. In this paper, the caesarean data was classified with five different algorithms; Support Vector Machine, K Nearest Neighbours, Naïve Bayes, Decision Tree Classifier, and Random Forest Classifier. The dataset is retrieved from California University website. The main objective of this study is to compare selected algorithms’ performances. This study has shown that the best accuracy that was for Naïve Bayes while the highest sensitivity which was for Support Vector Machine.
Caesarean data, machine learning, Decision Tree, K-Nearest- Neighbours, Naïve Bayes, Support Vector Machine, Random Forest Classifier
Short address: https://sciup.org/15016188
IDR: 15016188 | DOI: 10.5815/ijieeb.2019.05.03
Text of the scientific article Evaluation of different machine learning methods for caesarean data classification
Published Online September 2019 in MECS DOI: 10.5815/ijieeb.2019.05.03
The point of this examine is to investigate the execution various techniques on caesarean dataset which is a main issue in bioinformatics examination of medical sciences. In this paper the proposed study was performed using 'scikit-learn' as the back-end learning library in the Python 2.7 programming language on the Anaconda system platform and generally various experiment are well-done that incorporate gathering of generous scale data. These test systems are said to be basic with a view to accomplish a complete assurance. Be that as it may, then again, such many tests could entangle the primary determination process and lead to the trouble in getting the outcome. This kind of inconvenience could be settled with the guide of machine acknowledging which could be used explicitly to get the last item with help of a few computerized reasoning techniques [1]. Artificial Intelligence is the upgrade of the computer activities to implement endeavours that normally demand the human intercession, for example, decision making. Settling on the correct choice for an explicit issue is the fundamental factor for accomplishing our objectives. Therefore, numerous machine learning strategies are used for both classification and regression issues. Classification is used when the expectation objective is a discrete regard or a class stamp. At the point when the expectation objectives continuous, regression is the suitable technique to utilize. There is a diverse application for Machine Learning, the most critical of which is data mining. Individuals are regularly inclined to committing errors amid investigations. This makes it troublesome for them to discover answers for specific issues each instance in any data-set utilized by machine learning algorithms is spoken to utilizing a similar arrangement of features. The features might be continuous, categorical or binary. On the off chance that occasions are given with known marks (the identical correct outputs) the learning is called supervised, rather than unsupervised realizing, where examples are untagged. By applying these unsupervised calculations, specialists would like to find obscure, but advantageous, classes of items [2].
The main objective of this study is to evaluate several machine learning algorithms classify the caesarean section.
The rest of this study is organized as follows; Section 2 introduces the dataset, and methodology used in this study. Section 3 addresses the experiments and results carried out on the dataset. Finally, Section 4 draws the conclusion.
-
II. Dataset
The dataset is retrieved from the "University of California, Irvine Machine Learning Repository". It contains about 80 pregnant women with the most important characteristics of delivery problems in the medical field. The dataset contains 80 instances and 5 attributes; the Table 1 below illustrates the properties of the data (6 attributes). (5 represents the
Table 1. Caesarean data attributes
-
III. Methodology
-
3.1. Machine learning
-
Its aim is to arrange the information and get results that can be useful for different fields in our life. Through the experience, we will explore data by the program that can be the help to get good decisions. For instance, Google Maps exam for speed traffic through unknown area information from cell phones. This enables Google to lessen travel time by suggesting the fastest routes. The input data in Google outline, Maps accomplices, Road see Satellites, Area administrations, and Google Maps producers [3].
Classification is an important process in machine learning as well as in data mining. In addition, it used to compose our classifier set of training with class labels. In our study, we have only two output result: + (the positive class) or - (the negative class).
The machine learning algorithms used in this study were introduced below briefly.
Support Vector Machines ( SVM): SVMs spin around “margin" thought both sides of hyperplane which isolates two classes of data. The expansion of the margin and the greatest possible separation between the isolating hyper-plane and the instances for either side of it showed that the uppermost bound to the regular speculation error was diminished [4].
K-Nearest-Neighbours (k-NN): K-NN means a case of occurrence-based inclining and usually utilized for order where the assignment is to arrange the inconspicuous precedents dependent on the databases. Dimensional space using to display the comprehension, where the digits of attributes or properties of the observation are present. From another point of view, it is described by its similarity to any data centred in the structure. K-NN selects a new point category through selecting the nearest K indicates the new instance and selects the most common class by means of a plurality vote to be the new point class [5-6].
Naïve Bayes (NB): Naïve Bayes induction algorithms were earlier explained to be amazingly accurate on many classification duties even when the limited autonomy assumption on which they are based is disrupted.
Naïve Bayes is a perfect performance to the zero-one model used in classification [7]. The incorrect predictions had been defined as the error production in the Naïve Bayes. In contrast to many other loss tasks, like the squared mistake, this does not penalize the incorrect probability evaluation as long because as the best possibility is allocated to the right class [8].
Decision Tree (DT): DT supports the most widely used statistical and ML classifiers. It is a dynamic construction executes and overcomes the partition approach. It is a non-parametric classification and regression technique. It can be easily represented as if-then rules. Its realistic description makes the issue clear to the follower and ready to decipher the outcome and clear [9, 10].
Random Forest (RF): Successive trees increase the load to key points incorrectly expected by previous forecasters. The forecast for the weighted vote, in the end, will be taken. They do not rely on previous trees; where each is freely created by using a dataset "Bootstrap test". Each node in each random forest makes the typical use of a subset of indicators haphazardly selected at that node. This rather counterintuitive strategy is better than number of other classifiers, including discriminant examination, support vector machines and neural frameworks [11].
-
3.2. Confusion matrix
It is an error matrix related to the problem of statistical classification in machine learning. Confusion Matrix table, Table 2, related with the descript the classifier in by testing the data which the true values are known. It allows the imagination of the performance of an algorithm. Confusion’s confirmation allows between classes e.g.one class is ordinarily mislabelled as the other. Parameters of confusion matrix are given in Table 3.
Table 2. Confusion matrix.
|
Actual Values |
|||
|
Yes |
No |
||
|
Predicted |
Yes |
TP |
FN |
|
values |
No |
FP |
TN |
Table 3. Parameters of confusion matrix
|
Abbreviations |
Explanation |
|
TP |
The number of pregnant women that the program predicts to have caesarean among the pregnant women had a caesarean by gynecologist. |
|
TN |
The total of pregnant women which the classifier algorithm predicts to do not the time to caesarean among the pregnant women had not caesarean by gynecologist. |
|
FP |
The total of pregnant women which predicted classifier algorithm that it is the time of caesarean, while the gynecologist decided to reverse that. |
|
FN |
The number of pregnant women that predicted by the program that it's not the time of caesarean, while the gynecologist decided to reverse that. |
Most of the performance measures figured by confusion matrix. Where, True Positive (TP), True Negative (TN), False Positive (FP) and False Negative (FN) represents the precision parameters (as illustrated in the Table 2). There are diverse ways for measures to getting results for sensitivity, accuracy one of that measurements are the following equations :
Sensitivity = TP/(TP + FN) (1)
Accuracy = ( TP + TN ) / ( TP + FP + TN + FN ) (2)
-
IV. Experiments and results
Flowchart of the proposed study is introduced in Figure 1.
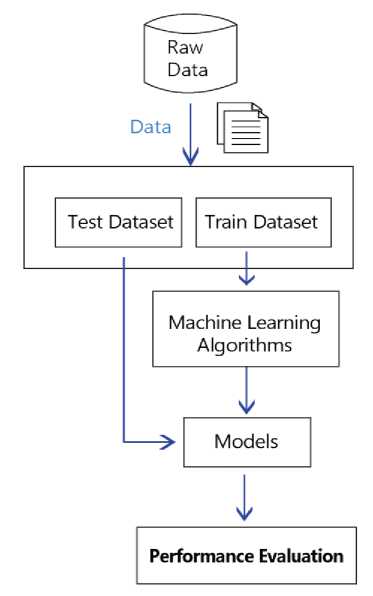
Fig.1. A flowchart of the proposed study.
Before obtaining our results, the dataset split into two sections; the training dataset is 70% and the test is 30%.
The train data sent to as input data machine learning algorithms to classification of caesarean data. After, successes of the models were evaluated on test data. The performance evaluations were presented in confusion matrix structure. Five classifiers algorithms are tested. The outcomes are demonstrated in Tables 4-8.
We executed the programming code several times, but we got slightly different results for each executing operation. Sometimes the Naïve Bayes algorithm had the best accuracy, but in other operation execution, the Support Vector Machine algorithm got the best accuracy. The values of precisions are shown in the following tables (Table 4 to Table 8).
Table 4. The results of the Support Vector Machine
|
TP = 4 |
FN = 1 |
5 |
|
FP = 9 |
TN = 10 |
19 |
|
13 |
11 |
24 |
Table 4 contains the results of the Support Vector Machine classification algorithm. Based on Table 4, through 5 data point that the gynaecologist considered as actual, four were positive and one was negative, the Support Vector Machine found. In addition, out of 19 data considered passive by gynaecologist, the Support Vector Machine found that 10 were passive and 9 were actual. The Support Vector Machine, therefore, gave values of accuracy of 58.33%, sensitivity of 90.90%.
Table 5. The results of the K-Nearest-Neighbors
|
TP=2 |
FN=3 |
5 |
|
FP=5 |
TN=14 |
19 |
|
7 |
17 |
24 |
Table 5 contains the results of the k-NN classification algorithm. Based on Table 5, through 5 data point that the gynaecologist considered as actual. Two were positive and Three was negative, the k-NN found. In addition, out of 19 data considered passive by gynaecologist, the Support Vector Machine found that 14 were passive and 5 were actual. The k-NN, therefore, gave values of accuracy of 66.66%, sensitivity of 82.35%.
Table 6. The results of the Naïve Bayes
|
TP=3 |
FN=2 |
5 |
|
FP=5 |
TN=14 |
19 |
|
8 |
16 |
24 |
Table 6 contains the results of the Naïve Bayes classification algorithm. Based on Table 6, through 5 data point that the gynaecologist considered as actual. Three were positive and two was negative, the Naïve Bayes found. In addition, out of 19 data considered passive by gynaecologist, the Naïve Bayes found that 14 were passive and 5 were actual. The Naïve Bayes, therefore, gave values of accuracy of 70.83%, sensitivity of 87.50%.
Table 7. The results of the Naïve Bayes
|
TP=3 |
FN=2 |
5 |
|
FP=9 |
TN=10 |
19 |
|
12 |
12 |
24 |
Table 7 contains the results of the Decision Tree Classifier classification algorithm. Based on Table 7, through 5 data point that the gynaecologist considered as actual. Three were positive and two was negative, the Decision Tree Classifier found. In addition, out of 19 data considered passive by gynaecologist, the Decision Tree Classifier found that 10 were passive and 9 were actual. The Decision Tree Classifier, therefore, gave values of accuracy of 54.16%, sensitivity of 83.33%.
Table 8. The results of the Random Forest Classifier
|
TP = 3 |
FN = 2 |
5 |
|
FP = 9 |
TN = 10 |
19 |
|
12 |
12 |
24 |
Table 8 contains the results of the Random Forest Classifier classification algorithm. Based on Table 8, through 5 data point that the gynaecologist considered as actual. Three were positive and two was negative, the Random Forest Classifier found. In addition, out of 19 data considered passive by gynaecologist, the Random Forest Classifier found that 10 were passive and 9 were actual. The Random Forest Classifier, therefore, gave values of accuracy of 54.16%, sensitivity of 83.33%.
Lastly, all results are combined and illustrated in Table 9, and their graphic exhibit is shown in Figure 2.
Table 9. Results of the used methods. Best outcomes highlighted in bold.
|
Algorithms |
(%) Accuracy |
(%) Sensitivity |
|
SVM |
58.33 |
90.90 |
|
k-NN |
66.66 |
82.35 |
|
NB |
70.83 |
87.50 |
|
DT |
54.16 |
83.33 |
|
RF |
54.16 |
83.33 |
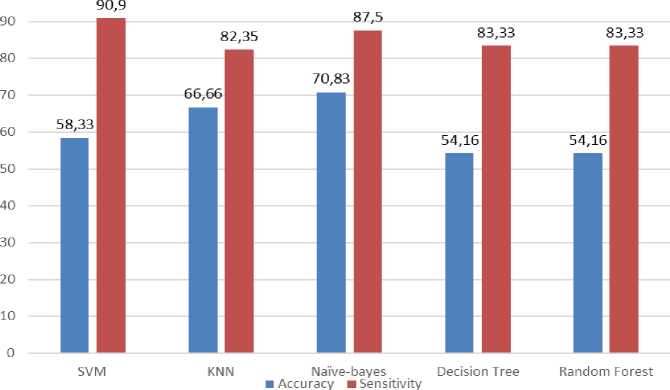
Fig.2. Graphical results of the classifications
-
V. Conclusions
This paper has shown the results of accuracy for different five classification algorithms. The study carried out to explore which the best algorithm between that technique of classifier algorithms, Support Vector Machine, K-Nearest-Neighbors, Naïve Bayes, Decision Tree Classifier, and Random Forest Classifier. As we know; the nature of the dataset usually affecting the performance of any learning algorithm. We have compered the performances of different classifier algorithms. We got the best accuracy that was for Naïve Bayes while the highest sensitivity which was for Support Vector Machine.
Acknowledgment
The authors thank the UCI Machine Learning Repository for providing publically available caesarean dataset.
References Evaluation of different machine learning methods for caesarean data classification
- Nilsson N.J. (2019). Introduction to Machine Learning: An Early Draft of a Proposed Textbook Robotics Laboratory, Department of Computer Science, Stanford University, (Access Time: January, 2019).
- Jain A.K., Murty M.N. and Flynn P.J. (1999). Data clustering: a review, ACM computing surveys, Volume 31, 1999, pp. 264-323.
- Alpaydin E. (2014). Introduction to machine learning, MIT press.
- Jakkula V. (2006). Tutorial on support vector machine,” School of EECS, Washington State University.
- Sutton O., (2012). Introduction to k nearest neighbour classification and condensed nearest neighbour data reduction, University lectures, University of Leicester.
- Jain A.K. (2010). Data clustering: 50 years beyond K-means, Pattern recognition letters, Volume 31, pp. 651-666.
- Domingos P. and Pazzani M. (1997). On the optimality of the simple Bayesian classifier under zero-one loss, Machine learning, Volume 29, pp.103-130.
- Friedman N., Geiger D. and Goldszmidt M. (1997). Bayesian network classifiers, Machine learning, Volume 29, pp. 131-163.
- Mitchell T.M. (1997). Machine learning, McGraw Hill Series in Computer Science, Volume 45, pp. 870-877.
- Myles A.J., Feudale R.N., Liu Y., Woody N.A. and Brown S.D. (2004). An introduction to decision tree modeling, Journal of Chemometrics: A Journal of the Chemometrics Society, Volume 18, pp. 275-285.
- Breiman, L. (2001). Random forests, Machine learning, Volume 45, pp. 5-32.
