Evaluation of different routing protocols for mobile ad-hoc networks in scenarios with high-speed mobility

Author: Antonio Russoniello, Eric Gamess
Journal: International Journal of Computer Network and Information Security @ijcnis
Article in issue: 10 vol.10, 2018.
Free access
The current communication requirements are moving quickly to mobile ad-hoc networks, mainly because of the decreasing cost of wireless networking technology and the increasing capacity to integrate into embedded devices technologies such as WiFi, ZigBee, Bluetooth, and WAVE. It is important to understand the limitation or the strength of each protocol and standard in order to make a better selection decision at the moment of implementing a specific scenario. This paper evaluates how routing protocols perform in mobile scenarios when the speed of nodes is relatively high. Our research shows that reactive routing protocols have a better packet delivery ratio (PDR) than proactive routing protocols. However, proactive routing protocols have a smaller end-to-end delay and hops count.
Network, Ad-hoc Routing Protocols, Mobile Ad-hoc Networks, 802.11, Simulation, OMNeT++
Short address: https://sciup.org/15015640
IDR: 15015640 | DOI: 10.5815/ijcnis.2018.10.06
Text of the scientific article Evaluation of different routing protocols for mobile ad-hoc networks in scenarios with high-speed mobility
Published Online October 2018 in MECS DOI: 10.5815/ijcnis.2018.10.06
Mobile Ad-hoc Networks (MANETs) are becoming very popular with the trading of many new devices such as smartphones, tablets, notebooks, etc. Moreover, the emerging Vehicular Ad-hoc Networks (VANETs) are quickly spreading in the car industry and are mainly aimed to improve the physical security of drivers and passengers, as well as to enhance the comfort and quality of trips. These kinds of networks require outstanding routing protocols which must guarantee selfconfiguration, auto-initialization, dynamic adaptation to topology changes, rapid convergence, minimal administration overhead, and escalation to a high number of nodes.
Since the MANETs lack of a fixed infrastructure and wireless nodes are moving and are not always within the range of each other, the nodes should cooperate in order to establish the routes of the packets. Topology is changing dynamically due to the mobility of nodes which implies that routes must frequently be rediscovered.
In this paper, we show how some proactive and reactive protocols [1-4] are affected by the speed of the nodes in scenarios with relatively high speed. Our simulations indicate that the efficiency of the protocols degrades when the speed of the nodes is increased and give some insight on which protocols perform better as the speed changes.
The rest of this paper is organized as follows. Section II introduces the related works. An introduction to the proactive and reactive routing protocols is done in Section III. Section IV presents the simulation tool (OMNeT++ [5]) used, the common parameters of our simulations, and the metrics considered to assess the routing protocols. In Section V, we give and discuss the results of our simulations. Finally, Section VI concludes the paper and specifies directions for future work.
-
II. Related Works
A considerable number of works have been done in the area of performance analysis of routing protocols for MANETs [6-13]. For example, Saadi, Kafhali, Haqiq, and Nassereddine [6] analyzed the AODV (Ad hoc On-demand Distance Vector), DSDV (Destination-Sequenced Distance Vector), and DSR (Dynamic Source Routing) protocols with the ns-2 network simulator [14] using the Manhattan Grid Mobility Model. The authors reported results for the Packet Delivery Ratio (PDR), average end-to-end delay, and throughput. In [7], Shankara, Jagadeeswararao, Priyanka, and Proya assessed the DSDV, DSR, AODV, and AOMDV (Ad-hoc On-demand Multipath Distance Vector) protocols based on some Quality of Service metrics (PDR, packet loss, delay, the overhead of control packets, and throughput) using ns-2 [14]. Gite and Thakur [8] measured the performance of the DSDV, DSR, and AODV protocols through simulations with ns-2 [14]. The metrics used by the authors included the throughput, PDR, routing overhead, and packet drop. Mumtaz and Niaz [9] evaluated the performance of the ADV (Adaptive Distance Vector), AODV, and DSDV protocols using the NCTUns 6.0 simulator, comparing packet dropped, packet collision, and throughput. Goel and Goyal [10] studied the performance of the DSDV, AODV, and OLSR (Optimized Link State Routing) protocols, using various performance differential metrics like the PDR, total energy consumption, and throughput, with ns-3 [15]. In [11], Geetika and Tyagi performed a comparative analysis of the DSR, DSDV, AODV, ZRP (Zone Routing Protocol), and TORA (Temporally Ordered Routing Algorithm) protocols. They reported metrics such as the PDR, throughput, average end-to-end delay, packets dropped, sending jitter, and receiving jitter using a maximum of 50 nodes.
Unlike our research, in all the previous works, the nodes were moving at relatively low speed. Also, most of the research done in the area are simulations with a very low number of nodes.
-
III. Background
There are three classes for routing protocols for MANET: (1) the proactive routing protocols or table-driven which maintain an updated list of destination nodes with their routes, (2) the reactive routing protocols or on-demand protocols where the routes are discovered on demand by flooding the network with route request packets, and (3) the hybrid routing protocols using a mixture of the proactive and reactive protocols. The latter ones can be used to find a balance between the proactive and reactive protocols. Some of the most popular hybrid protocols are the Core Extraction Distributed Ad-hoc Routing Protocol (CEDAR) [16], Zone Routing Protocol (ZRP) [16], and Zone based Hierarchical Link State Routing Protocol (ZHLS) [16].
As we will be focused in this paper on proactive and reactive protocols, let us mention and briefly describe some of these protocols.
-
A. Proactive Routing Protocols
Proactive routing protocols actively maintain fresh lists of destinations and their routes. Hence, the routing information is periodically distributed which implies a considerable administration overhead over the data network to maintain routes. However, when a node needs to send a packet, the route to the destination is already known, which minimizes the route discovery delay. A brief description of the proactive protocols (DSDV, OLSR, and BATMAN [17]) that we selected for our research is presented below. It is worth mentioning that we selected these proactive routing protocols since they are implemented in OMNeT++/INET [5] and they are popular in the community.
Destination Sequenced Distance Vector (DSDV): this protocol is based on the Bellman-Ford routing mechanism. It maintains loop free routes and minimizes the number of hops. The routing information is exchanged just when significant information has to be propagated [18]. The routing tables have entries for all the destination nodes and the hops to reach them.
Optimized Link State Routing (OLSR): it is also called the table-driven protocol because it stores and updates the routing table periodically. The protocol maintains track of routing tables to provide a route when it is needed. Whenever a change in the topology is presented, all the nodes will be informed by flooding the network. OSLR is very efficient to reduce the route discovery delay.
Better Approach To Mobile Ad-hoc Networking (BATMAN): periodically, every node sends a broadcast message to all nodes in the network informing its presence. Later, the neighbors relay this message to their own neighbors. Finally, all nodes in the network share the same information and can find the best way to reach a specific destination node.
-
B. Reactive Routing Protocols
In reactive routing protocols, routes are discovered when they are needed, resulting in a higher latency compared to proactive routing protocols. Also, the continuous flooding of the discovery process combined with a very dynamic topology can temporarily clog the network and increase the packet loss. A short introduction of the reactive protocols (DYMO, DSR, and AODV) that we selected for our research is given next. It is worth to clarify that we selected these reactive routing protocols for their popularity and their availability in OMNeT++/ INET.
Dynamic MANET On-demand (DYMO): determines unicast routes between nodes in the network. When a node wants to transmit information to another node, a route request (RREQ) is transmitted to all nodes in the range. When a node receives a route reply (RREP), it appends information about itself in the RREP and sends it as a unicast packet to all nearby nodes [19].
Dynamic Source Routing (DSR): is an on-demand routing protocol that supports self-organizing and selfconfiguration. The protocol is composed of route discovery and route maintenance.
Ad-hoc On-Demand Distance Vector (AODV): supports unicast and multicast packet transmission. It is the unique of the on-demand algorithms that incorporates multicast communication [18]. AODV has a lower overhead when compared to DSR, since the packet contains only the destination address [18].
-
IV. Simulations
In order to simulate the scenarios, we used the OMNeT++ [5] simulator due to its robust implementation, high number of networking models, and helpful GUI [20]. Additionally, it is worth to mention that OMNeT++ supports a considerable number of protocols used in MANET, it is well documented, and it has been debugged for years.
Table 1 shows the common parameters defined in our simulations. We used these values unless otherwise specified. For the transmission standard, we selected IEEE 802.11b with a range of frequencies centered around 2.4 GHz, and a bit rate of 11 Mbps. We chose the mass mobility model [21], intended to model node movement during which the nodes have momentum, and thus do not start, stop, or turn abruptly. When a node hits a wall of the grid, it reflects off the wall at the same angle. For all our simulations, the total simulation time was 30 sec. During the simulations, each node was periodically sending UDP datagrams, with a payload size between 100 and 500 bytes (referred as Message Length in Table 1). The free space propagation model selected allows the signal to travel from the source to the destination by following a straight line, without encountering neither absorbing obstacles nor reflecting surfaces.
Table 1. Simulation Parameters
|
Parameter |
Value |
|
Simulator |
OMNeT++ (version 4.4.1) / INET |
|
Protocols |
AODV, DSR, DSDV, BATMAN, DYMO, OLSR |
|
MAC Layer Protocol |
IEEE 802.11b |
|
Number of Nodes |
100 |
|
Simulation Time |
30 sec |
|
Grid |
850x850 |
|
Mobility Model |
Mass Mobility |
|
Speed of Nodes |
0, 5, 10, 15, 20, 25, 30 mps |
|
Transport Protocol |
UDP |
|
Message Length |
Different values were used in the simulations depending on the scenario: 100, 200, 300, 400, 500 bytes |
|
Send Interval between Consecutive Data Packets |
0.125 s |
|
Propagation Model |
Free Space Propagation |
|
Frequency |
2.4 GHz |
|
Bit Rate |
11 Mbps |
|
Thermal Noise |
-110 dBm |
|
Radio SNIR Threshold |
4 dB |
To calculate the radio sensitivity in dBm, we used Formula (1). D is the desired transmission range in meters. F is the frequency in Hz, in our case 2.4 GHz. C is the speed of light in the vacuum in mps (meters per second), that is 300,000,000 mps. Tp is the transmission power in mW, for our research we took Tp = 2.0 mW.
R, = 1Wo9u [r , (j^], (1)
Table 2 shows the radio transmission power, the radio sensitivity, and the frequency per each transmission range used in the simulations:
Table 2. Radio Sensitivity for Transmission Ranges of 100, 150, and 200 Meters
|
Transmission Range |
|||
|
Transmission Range ( D ) |
100 m |
150 m |
200 m |
|
Frequency ( F ) |
2.4 GHz |
2.4 GHz |
2.4 GHz |
|
Radio Transmission Power (Tp) |
2.0 mW |
2.0 mW |
2.0 mW |
|
Radio Sensitivity (R , ) |
-77.03 dBm |
-80.55 dBm |
-83.05 dBm |
In order to assess the performance of each protocol, we used three metrics in this paper:
-
• Packet Delivery Ratio (PDR): the ratio of the number of data packets delivered to destinations over the number of packets generated by the sources [22-23].
-
• Average Hops Count: average number of hops for data packets delivered to destinations [22-23].
-
• Average End-to-End Delay: includes all possible delays caused by route discovery, queuing at the interface queue, retransmission delays at the MAC layer, propagation and transmission times [22-23].
-
V. Results
The packet delivery ratio, the average hops count, and the average end-to-end delay were measured initially for three scenarios (A, B, and C).
-
A. Scenario A
This scenario defines a network with 100 nodes and a transmission range of 100 m. The message length was fixed to 500 bytes. We varied the speed of the nodes from 0 to 30 mps in steps of 5 mps (0, 5, 10, 15, 20, 25, and 30 mps).
For our simulations, Figs. 1, 2, and 3 depict the PDR, hops count, and end-to-end delay, respectively. We can see how the increasing speed affects the metrics for all the routing protocols.
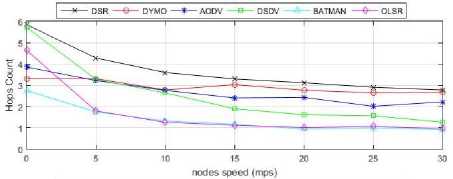
Fig.2. Average Hops Count vs Node Speed - 100 Nodes - Transmission Range 100 m
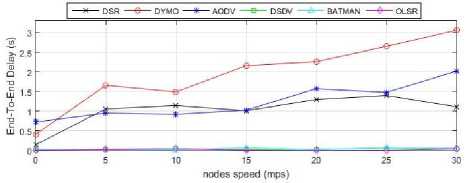
Fig.3. Average end-to-end delay vs node speed - 100 nodes -transmission range 100 m
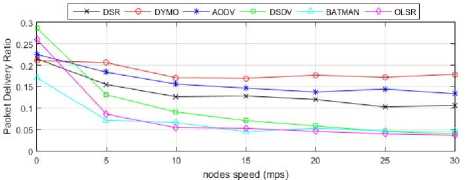
Fig.1. PDR vs Node Speed - 100 Nodes - Transmission Range 100 m
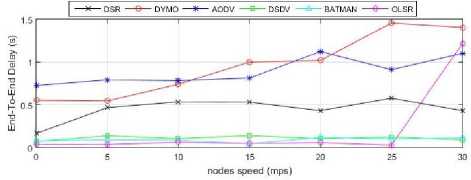
Fig.6. Average End-to-end Delay vs Node Speed - 100 Nodes -Transmission Range 150 m
-
B. Scenario B
This scenario defines a network with 100 nodes and a transmission range of 150 m. The message length was fixed to 500 bytes. We varied the speed of the nodes from 0 to 30 mps in steps of 5 mps.
Figs. 4, 5, and 6 show the PDR, hops count, and end-to-end delay, respectively, for our simulations. As can be observed, a better performance of the network is obtained when compared with the previous scenario due to the extended transmission range.
-
C. Scenario C
This scenario defines a network with 100 nodes and a transmission range of 200 m. The message length was fixed to 500 bytes. We varied the speed of the nodes from 0 to 30 mps in steps of 5 mps.
Figs. 7, 8 and 9 depict the PDR, hops count, and end-to-end delay, respectively, for our simulations. When increasing the transmission range from 150 m to 200 m, the PDR and hops count metrics do not have a better performance. Also, it is worth to notice that the end-to-end delay has been incremented.
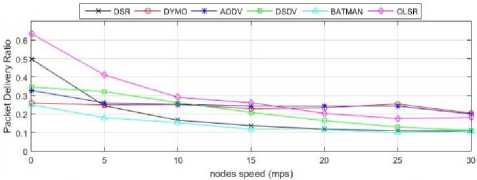
Fig.7. PDR vs Node Speed - 100 Nodes - Transmission Range 200 m
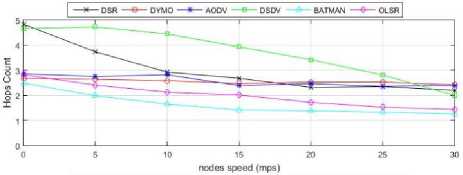
Fig.8. Average Hops Count vs Node Speed - 100 Nodes - Transmission Range 200 m
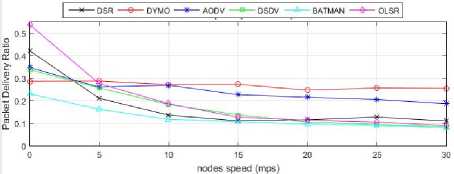
Fig.4. PDR vs Node Speed - 100 Nodes - Transmission Range 150 m
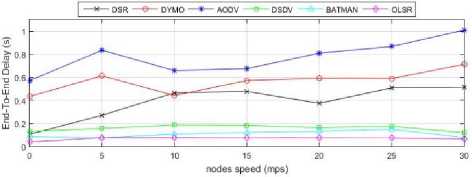
Fig.9. Average End-to-end Delay vs Node Speed - 100 Nodes -Transmission Range 200 m
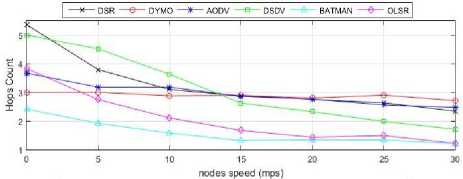
Fig.5. Average Hops Count Vs Node Speed - 100 Nodes - Transmission Range 150 m
In order to measure the impact of the message length and the send interval on the performance of each protocol in the network, we simulated two additional scenarios (D and E).
-
D. Scenario D
This scenario defines a network with 100 nodes, a speed of 25 mps for the nodes, and a transmission range of 100 m. The message length was varied from 100 to 500 bytes in steps of 100 bytes (100, 200, 300, 400, and 500 bytes). The message interval was fixed to 1 s.
Figs. 10, 11, and 12 depict the PDR, hops count, and end-to-end delay, respectively, for our simulations. For the three metrics (PDR, hops count, and end-to-end delay), the variation in message length from 100 to 500 bytes has no impact on the performance.
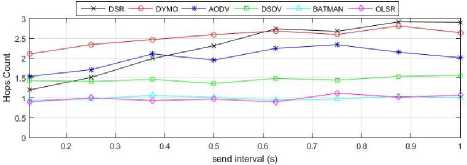
Fig.14. Average Hops Count vs send Interval - 100 Nodes -Transmission Range 100 m - Nodes Speed 25 mps - Message Length 500 bytes
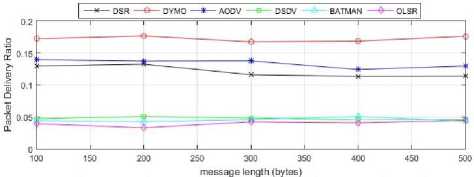
Fig.10. PDR vs Message Length - 100 Nodes - Transmission Range 100 m - Nodes Speed 25 mps - Send Interval 1 s
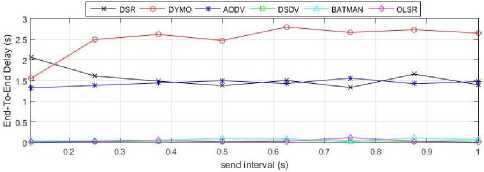
Fig.15. Average End-to-end delay vs send Interval - 100 Nodes -Transmission Range 100 m - Nodes Speed 25 mps - Message Length 500 bytes
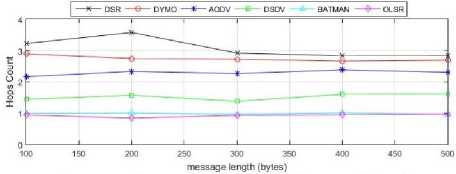
Fig.11. Average Hops Count vs Message Length - 100 Nodes -Transmission Range 100 m - Nodes Speed 25 mps - Send Interval 1 s
Figs. 13, 14, and 15 show the PDR, hops count, and end-to-end delay, respectively, for our simulations. The simulations show that incrementing the send interval from 0.1 s to 1 s tends to improve very slightly the PDR (compare with Fig. 1) and hops count (compare with Fig. 2). The end-to-end delay is not affected (compare with Fig. 3).
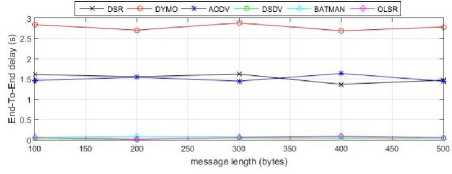
Fig.12. Average End-to-end delay vs Message Length - 100 Nodes -
Transmission Range 100 m - Nodes Speed 25 mps - Send Interval 1 s
-
E. Scenario E
This scenario defines a network with 100 nodes, a speed of 25 mps for the nodes, a transmission range of 100 m, and a message length of 500 bytes. The send interval was changed from 0.1 s to 1 s in steps of 0.125 s.
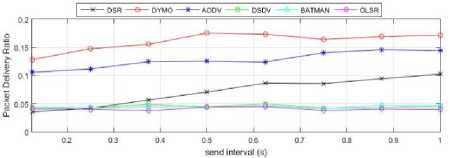
Fig.13. PDR vs send Interval - 100 Nodes - Transmission Range 100 m - Nodes Speed 25 mps - Message Length 500 bytes
-
VI. Conclusions and Future Work
This paper analyzed the performance of proactive and reactive routing protocols using the IEEE 802.11 standard in scenarios with high speed mobility. We varied several parameters in our simulations, such as the nodes speed, transmission range, messages length, and send interval.
From scenarios A, B, and C, we can conclude that the OLSR and BATMAN proactive protocols present better values for the end-to-end delay and hops count, than the other studied protocols. The AODV, DSR, and DYMO reactive routing protocols perform very well for PDR. A particular situation is happening with DSDV, which has the worst values for the hops count in all the cases. DYMO and AODV present the poorest results for the end-to-end delay in all scenarios.
According to our simulations, the network performance is improved when the radio transmission range is extended from 100 m to 200 m.
When the speed is increased, DSDV, BATMAN, and OLSR are barely affected, maintaining their end-to-end delay values almost constant. It is not the case for DYMO, DSR, and AODV, where the end-to-end delay deteriorates as the speed increases. For all the protocols, the speed factor affects the PDR and hops count, decreasing the efficiency.
In scenario D, varying the message length from 100 to 500 bytes did not affect notoriously the network performance.
In scenario E, as the send interval is increased (the period of time between sending two consecutive datagrams), the performance of the PDR is getting better. This is an expected behavior since the load over the network is reduced. According to our simulations, the variation of the send interval from 0.1 s to 1 s barely affected the end-to-end delay.
As future work, we propose to further increase the number of nodes and their speed to evaluate how performance metrics are affected in each routing protocol. Additionally, we plan to include the bio-inspired routing protocols in our scenarios in order to compare their performance with proactive and reactive protocols.
References Evaluation of different routing protocols for mobile ad-hoc networks in scenarios with high-speed mobility
- M. Bheemalingaiah, M. Naidu, D. Rao, and G. Varaprasad, Energy Aware Node Disjoint Multipath Routing in Mobile Ad Hoc Network, Journal of Theoretical and Applied Information Technology, Vol. 5, No. 4, pp. 416-431, 2009.
- A. Penttinen, Research on Ad Hoc Networking: Current Activity and Future Directions. Networking Laboratory, Helsinki University of Technology, Finland, pp. 1-10, 2015.
- K. Rakesh and D. Mayank, A Comparative Study of Various Routing Protocols in VANET. International Journal of Computer Science Issues, Vol. 8, No. 1, pp. 643-648, July 2011.
- R. Gupta and H. Aggarwal, Network Density based Analysis of MANET Routing Protocols, International Journal of Computer Applications, Vol. 77, No. 10, pp. 33-39, September 2013.
- T. Chamberlain, Learning OMNeT++, Packt Publishing, September 2013.
- Y. Saadi, S. Kafhali, A. Haqiq, and B. Nassereddine, Simulation Analysis of Routing Protocols using Manhattan Grid Mobility Model in MANET, International Journal of Computer Applications, Vol. 15, No. 23, pp. 24-30, May 2012.
- G. Shankara, E. Jagadeeswararao, U. Jyothsna Priyanka, and T. Indira Proya Darsini, Performance Analysis of MANET Routing Protocols – DSDV, DSR, AODV, AOMDV using ns-2, Global Journal of Computer Science and Technology, Vol. 15, No. 6, pp. 9-18, 2015.
- P. Gite and S. Thakur, Comparative Study and Simulation Based Analysis of MANET Routing Protocols Using ns-2, International Journal of Emerging Science and Engineering, Vol. 2, No. 3, pp. 29-33, January 2013.
- W. Mumtaz and B. Niaz, Performance Evaluation of Ad Hoc Routing Protocols through NCTUns 6.0, International Journal of Computer Applications, Vol. 19, No. 5, pp. 1-4, April 2011.
- S. Goel and N. Goyal, MANET: Simulation Analysis and Performance Evaluation of Routing Protocol Using ns-3, International Journal of Advanced Research in Computer Science and Software Engineering, Vol. 7, No. 4, April 2017.
- D. Geetike and S. Tyagi, Performance Analysis of various Routing Protocols in Mobile Ad-Hoc Networks, International Journal of Applied Engineering Research, Vol. 13, No. 10, pp. 7378-7382, 2018.
- M. Shaffatul, A. Riaz, and M. Tarique, Performance Analysis of the Routing Protocols for Video Streaming over Mobile Ad Hoc Networks, International Journal of Computer Networks & Communication, Vol. 4, No. 3, pp. 133-150, May 2012.
- N. Vetrivelan and A. Reddy, Performance Analysis of Three Routing Protocols for Varying MANET Size, In Proceeding of the 2008 International Multiconference of Engineers and Computer Scientists, Vol. II, Hong Kong March 2008.
- T. Issariyakul and E. Hossain, Introduction to Network Simulator ns-2, Second Edition, Springer, December 2012.
- J. Burbank, An Introduction to Network Simulator 3, First Edition, Wiley-IEEE Press, March 2018.
- S. Agrawal, S. Jain, and S. Sharma, A Survey of Routing Attacks and Security Measures in Mobile Ad-Hoc Networks, Journal of Computing, Vol. 3, No. 1, pp. 41-48, January 2011.
- A. Sharma and N. Rajagopalan, A Comparative Study of BATMAN and OLSR Routing Protocols for MANETs, International Journal of Advanced Trends in Computer Science and Engineering, Vol. 2, No. 5, pp. 13-17, India, 2013.
- V. Bhat and P. Shah, Performance Comparison of Ad-Hoc VANET Routing Algorithms, International Journal of Computational Engineering & Management, Vol. 15, No. 2, pp. 13-19, March 2012.
- J. Train and S. Savita, Analysis of OLSR, DSR, DYMO Routing Protocols in Mobile Ad-Hoc Networks using OMNeT++ Simulation, Global Journal of Computer Science and Technology: Network, Web & Security, Vol. 14, No. 1, pp. 7-10, 2014.
- E. Gamess and C. Veracoechea, A Comparative Analysis of Network Simulation Tools, In Proceedings of the 2010 International Conference on Modeling, Simulation and Visualization Methods (MSV’10), Las Vegas, Nevada, USA, July 2010.
- T. Camp, J. Boleng, and V. Davies, A Survey of Mobility Models for Ad Hoc Network Research, Wireless Communication & Mobile Computing. Vol. 2, No. 5, pp. 483-502, 2002.
- E. Gamess, L. Acosta, and D. Hernández. Analyzing Routing Protocol Performance versus Bitrate in Vehicular Networks. In proceedings of the IEEE Global Information Infrastructure and Networking Symposium 2012 (GIIS 2012), Choroni, Venezuela, December 2012.
- E. Gamess and M. Chachati. Analyzing Routing Protocol Performance with NCTUns for Vehicular Networks. Indian Journal of Science & Technology, Vol. 7, No. 9, pp. 1391-1402, September 2014.
