Evaluation of groundwater quality using WQI models and its application to plants vulnerable to ecological stress

Author: Rajabova Nilufar, Sherimbetov Vafabay
Journal: Журнал стресс-физиологии и биохимии @jspb
Article in issue: 3 т.21, 2025.
Free access
This study focuses on the groundwater found at depths of 10-20 meters in the Amudarya district of the Republic of Karakalpakstan, within Uzbekistan. The primary objective of the research is to determine the suitability of this water for irrigating plants that are not resistant to environmental stress. Water samples were collected from 12 wells over the period of 2020-2024, and laboratory analyses were conducted based on four key indicators: Total Dissolved Solids (TDS), chloride (Cl⁻), potential of Hydrogen (pH), and nitrate (NO₃⁻). To assess the overall water quality, the “Weighted Arithmetic Water Quality Index (WA-WQI)” and the “Canadian Council of Ministers of the Environment (CCME)” models were used. According to the research findings, the overall quality of groundwater in the Amudarya district falls under the “Unsuitable for drinking and fish culture” category according to the WA-WQI model and the “poor” category according to the CCME WQI model, limiting its use for irrigating plants with low tolerance. The novelty of this study lies in the confirmation that groundwater is unsuitable for irrigating plants that are not resistant to environmental stress. However, it can be used for irrigating certain semi-tolerant and tolerant plant species.
Groundwater, ecological stress, salinity, water quality index (wqi), fao guidelines, sensitive and insensitive crops, agricultural productivity
Short address: https://sciup.org/143184737
IDR: 143184737
Text of the scientific article Evaluation of groundwater quality using WQI models and its application to plants vulnerable to ecological stress
Water is one of the most crucial natural resources on Earth, and ensuring and managing its quality is particularly important for maintaining the continuity of life in the biosphere. Water pollution can lead to significant ecological and economic problems in agricultural, industrial, and domestic use. Assessment of groundwater quality plays a major role in improving their ecological and economic efficiency. This article examines the agrotechnical and ecological characteristics of water based on laboratory results from 12 groundwater well samples located in the Amudarya district. The water quality was analyzed through indicators including Total Dissolved Solids (TDS), chloride (Cl ’ ), nitrate (NO 3“ ), and pH levels.
In the arid regions of Uzbekistan, particularly in the Amudarya district of the Republic of Karakalpakstan, groundwater serves as an effective irrigation source for plants and is used to irrigate various crops. However, groundwater quality, especially in arid and semi-arid regions, can negatively impact the development of different ecological groups of plants due to salinity and other ecological stresses. Therefore, for efficient water use, it is necessary to properly assess water quality and consider plants’ water requirements (Vineis et al. , 2011; Katel et al. , 2023; Yue et al. , 2020; Ullah et al. , 2021; Garcia-Caparros et al. , 2023; Rajabova et al. , 2024).
The article conducts analyses based on methods for assessing key water quality indicators, as well as methodology regarding plant water requirements corresponding to these indicators, and the FAO water quality guidelines from 1976. Additionally, the overall state of water quality is analyzed through the Water Quality Index (WQI) methodology. The article presents scientific approaches aimed at optimizing water resources for efficient water use and obtaining high yields from phytocenoses (Rajabova et al. , 2024; Owens, 2001).
MATERIALS AND METHODS
Water samples were collected according to the ISC-31861 (primary methodology) (Interstate Council for
Standardization, Metrology and Certification, 2012). Sterilized plastic containers of 1 liter capacity were used for this purpose. The sampling locations consisted of 12 points in total, with water samples collected four times per year - in February (winter), May (spring), August (summer), and November (autumn) from designated stations. The designated locations are situated in various corners of the Amudaryo province. Table 1 presents the location and numbering of the sampling stations (S) within the province. Additionally, the geographic locations of the wells from which these water samples were collected can be observed on the map presented in Figure 1.
The wells are formed at depths ranging from 10-20 meters relative to ground level, and such groundwater is utilized by the local population for various purposes (potable water, food preparation, sanitation, crop irrigation, and others). Under laboratory conditions, water samples were analyzed for 4 parameters - Total Dissolved Solids (TDS), chloride (Cl ’ ), hydrogen index (pH), and nitrate (NO 3- ) (GOST 18164 - 72; GOST 4245 - 72; ISO 10523:2008; GOST 4192-82). The masses of these 4 indicators in 1 liter of water were analyzed according to the methodologies presented in Table 2 below.
The FAO developed a methodology based on its 1976 water quality guidelines. This methodology primarily proposes effective irrigation strategies for crops in arid, semi-arid, and agriculturally-oriented regions. This methodology provides opportunities for temporary but effective crop management using water resources, particularly in conditions of intensifying climate change and water scarcity (Ayers & Westcot, 1985; Noori et al. , 2020; Shannon & Grieve, 1998; Munns & Gilliham, 2015; Abdelrhman et al. , 2024; Bahlool et al. , 2014; Roussi et al. , 2024).
This approach helps maximize yields under limited water resources and establish productive agrocenoses in efficient agriculture in areas with challenging growth conditions. The advantage of this methodology is that it has been developed based on recent scientific research results and is oriented toward analyzing water quality with moderate and severe restrictions and their practical application. It takes into account the optimal water requirements for different classes of plants. For tolerant plants, even when water quality severe restrictions are within the specified values under conditions of high pollution and other ecological stresses, high yields can be obtained through effective management and specific plant selection. These guidelines can be successfully applied in irrigation for tolerant plants. However, for plants with low tolerance, under conditions of deteriorated water quality, a high level of management and practice is required. This includes conducting field trials, rigorous analysis of results, and in-depth analysis of laboratory indicators (Garcia-Caparros et al., 2023; Owens et al., 2001; Noori et al., 2020; Ueda et al., 2016). According to FAO guidelines, in assessing plants’ adaptability to water quality indicators, their tolerance level (resistance to salinity and other ecological stress factors) is crucial (Abadi et al., 2020).
Water supply management is crucial for optimizing growth conditions based on the water requirements of each plant species. While some plants are droughtresistant, others require regular irrigation. Table 3 presents a list of plants categorized by their resistance levels to various ecological stresses. Tolerant plants are resistant to high TDS and chloride levels, and they can develop even under high salinity conditions. For example, Hordeum vulgare, Gossypium spp., Cyamopsis tetragonoloba and others (Ojukwu et al. , 2021; Mohseni et al. , 2024; Alexakis, 2022; Uddin et al. , 2023.
Semi-tolerant plants represent an ecological group that can adapt to moderate salinity conditions, requiring moderate levels of water and salinity for proper development.
Sensitive (low tolerance level) plants are susceptible to high levels of salt, chloride, or nitrate, and their growth slows or ceases with increasing salinity (for example, Citrus spp., Pisum sativum, Allium sativum ) (Abadi et al. , 2020).
Mechanism of Using WQI Models
The Weighted Arithmetic Water Quality Index (WA-WQI) Model
The WA-WQI model determines weight and quality ratings based on designated quality indicators and expresses overall water quality in a single number. The WQI calculation process in this model consists of 4 stages (Ueda et al. , 2016; Ojukwu et al. , 2021; Alexakis et al. , 2022).
Stage 1: Calculation of relative weight ( k i ) for designated or desired water quality indicators.
k-S vi - quantity of desired indicators (weights of desired quality parameters present in 1 l volume of water)
Si - ideal or standard value for desired indicators ki - relative weight indicator for desired indicators, where if the ki value is close to 1, the weight of the desired parameter is close to the ideal or optimal value
Stage 2: Calculation of the weight for each quality parameter.
In other words, this stage determines the role of each designated indicator in overall Water Quality (WQ).
- k^
w' i> i-1
w i - the significance level of the relative weight;
k i - the relative weight (calculated value in the 1 st stage, representing the relative importance indicator or relative weight);
n
^ ki - the total sum (the sum of the relative weights i-1
of all defined indicators).
Stage 3: Calculating the quality level of each indicator.
v
Q = i × 100 iSi
Q i - the quality level of any parameter. This quality level ranges from 0 to 100 percent (100%). The closer the measured amount of quality indicators in laboratory analysis results is to the ideal value, the better the water quality, achieving up to 100% positivity.
-
v i - the quantity of any indicator (the weight of any quality parameter present in 1 liter of water).
S i - the ideal or standard value for any indicator (as defined in Uz ISC 133:2024).
Stage 4: Calculation of the Weighted Arithmetic Water Quality Index (WA-WQI).
n
WQI = E wQi i = 1
w i – Determines the relative weight significance of a given quality parameter within the overall water quality value (the sum of the weights for all specified parameters must equal 1).
Q i – The quality level of a given parameter, expressed as a percentage (%) within a range of 0 to 100.
WQI - The overall Water Quality Index, calculated as the sum of the quality levels of all parameters weighted by their relative significance. A higher WQI value indicates positive water quality (better water quality), while a lower value indicates negative water quality (poorer water quality). The values derived from the WA-WQI model are classified into ranges between 0 and 100, as shown in Table 4.
Canadian Council of Ministers of the Environ (CCME) WQI
This model is primarily designed to assess the quality of surface water. The calculation of the WQI in this method is based on the combination (root mean square) of the following three factors:
Calculation of the Index
Step 1: F 1 - ercentage of parameters exceeding the standard (Scope).
■ p _ Number of parametres exceeding the standard ^qq
-
1 Total number of parametres
Step 2: F2- ercentage of tests exceeding the standard (Frequency).
-
„_Number of test results deviating from the norm , г 2-- X1 U U
-
3.1. Excursion – This measures the magnitude by which individual test results exceed the standard value:
-
3.2. Normalized Sum of Excursions nse : This represents the normalized measurement of the deviation of water parameters from the standard values:
Total number of test results
Step 3: F 3 - the extent to which test results deviate from the standard (Amplitude). The calculation of Amplitude involves three steps:
. The i-test result deviating from the standard - excursion = ------------------------1 i- test standard
J”=i excursiorii nse = —---;-----;--------------7—
Total number of test results
n
Here, ^ excursio n i - represents the deviation of i = 1
the parameter from its normative (standard) value; Normalized Sum of Excursions ( nse ) is the normalized measure of these deviations.
-
3.3. The express the value of the nse as a percentage, the value of F 3 is calculated as in Table 5.
RESULTS AND DISCUSSION
Based on the results of samples taken from the observation wells, the use of the water for irrigation of various crops is found to be limited. For instance, it was determined that the water is unsuitable for irrigating plants with low tolerance to environmental stresses. Such water types can not only act as limiting factors for the optimal range of plant growth but may also negatively impact the overall soil condition within agroecosystems. The composition of water from all 12 wells does not meet the required standards for chloride, nitrate, and TDS indicators, as per FAO guidelines. Table 6 below presents the laboratory analysis results obtained from 2020 to 2024.
lants with typically low tolerance thresholds cannot adapt to adverse ecological stresses or may experience reduced overall productivity. rimary indicators manifest initially in morphological parameters (Anjum et al., 2003).
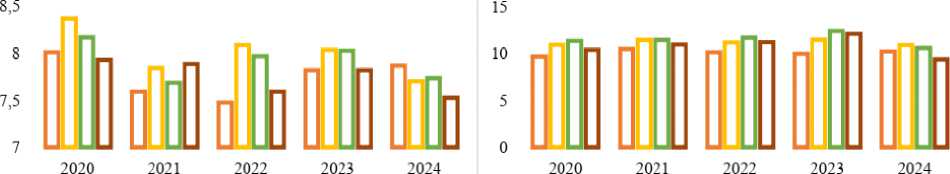
For instance, as shown in Table 6, three parameters in water composition - NO₃ ⁻ , TDS, and Cl ⁻ - do not create unfavorable conditions for tolerant plant development. However, these factors may become limiting for stress-sensitive plants’ growth and yield potential. Figure 3 illustrates the fluctuating trends of each quality parameter measured in water samples from 12 wells.
As evident from the diagram above, the TDS value is higher compared to other parameters. This may create unfavorable conditions for stress-sensitive plants, as TDS encompasses various salts and minerals that may be unnecessary or detrimental to plant growth. High pH combined with elevated TDS can impede nutrient absorption through the root system. Conversely, highly acidic water (low pH) can also negatively impact nutrient uptake. High chloride content in water can similarly create adverse conditions for plants. While chloride is an essential micronutrient, excessive amounts can be harmful, potentially causing morphological changes such as leaf reduction and thickening, decreased plant growth, premature leaf chlorosis, and defoliation. Chloride toxicity primarily disrupts plant metabolism, photosynthesis, respiration, and ionic balance (e.g., sodium, potassium, calcium, and nitrates). Excessive chloride levels can hinder nutrient uptake (particularly nitrates and phosphates) through roots, compromising plant health (Carillo & Rouphael, 2022; Ismoilova et al., 2024).
Elevated nitrate concentrations can adversely affect root system development and growth, specifically reducing root length and limiting lateral root development. Nitrates can modify plant hormones “auxin” and “cytokinin” inhibiting or slowing root growth. Furthermore, excess nitrates intensify oxidative stress, reducing plants' nutrient absorption capacity. Therefore, managing water nitrate levels is crucial for creating optimal growth conditions.
Determining overall water quality is essential for irrigating various crops in agrocenoses. Different WQI models are used to determine water quality indices. Their advantage lies in synthesizing quality indicators based on significance levels, expressing water quality in a single number. In this study, groundwater quality indices were developed primarily for ecologically stresssensitive plants (Di Rubbo et al. , 2013; Ueda et al. , 2016; Ojukwu et al. , 2021; Alexakis et al. 2022). Specifically, plants with low tolerance levels or “sensitive crops”. WA-WQI and CCME WQI models were used to calculate WQIs (Table X), using FAO standards for both sensitive and insensitive crops, as shown in Table 3 above.
Table 1. Water Sampling Stations
|
Numbering of stations |
Abbreviations |
|
Station 1 |
S1 |
|
Station 2 |
S2 |
|
Station 3 |
S3 |
|
Station 4 |
S4 |
|
Station 5 |
S5 |
|
Station 6 |
S6 |
|
Station 7 |
S7 |
|
Station 8 |
S8 |
|
Station 9 |
S9 |
|
Station 10 |
S10 |
|
Station 11 |
S11 |
|
Station 12 |
S12 |
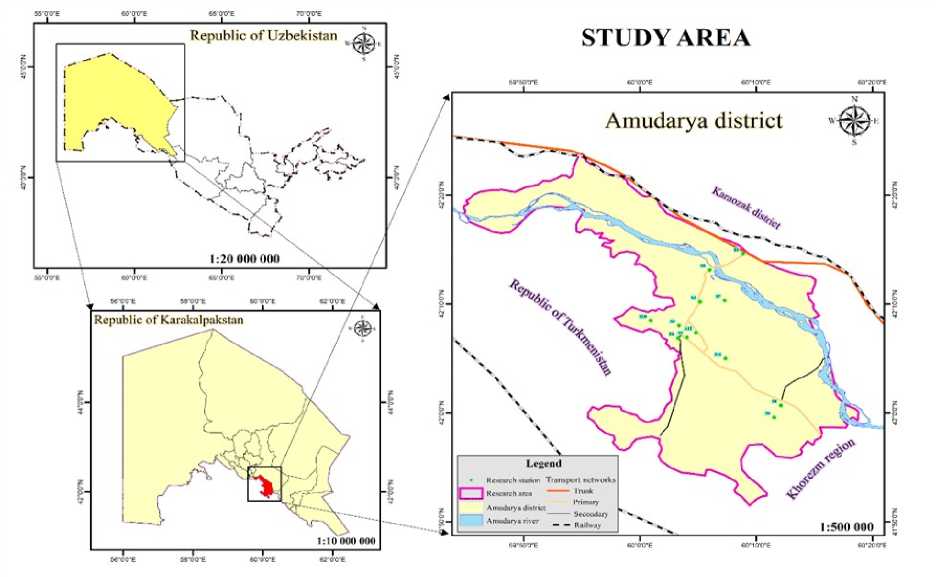
Figure 1: The geographical distribution of a total of 12 monitoring wells located in the Amudarya district of the Republic of Karakalpakstan, within the Republic of Uzbekistan.
Table 2. Methods and Equipment for Determining Water Quality Indicators in Laboratory Conditions and Guidelines for Evaluating Water Quality in Irrigation Systems
|
Quality indicators |
Methods and equipment used in laboratory conditions |
Units |
Extent of Usage Restrictions |
||
|
None |
Slight to Moderate |
Severe |
|||
|
Total Dissolved Solids (TDS) |
Drying and weight measurement (gravimetric method) |
mg/l |
0-450 |
450-2000 |
>2000 |
|
Chloride (Cl ⁻ ) |
Titration method using silver nitrate (AgNO 3 ) solution |
mEq/l |
0-4 |
4-10 |
>10 |
|
pH (power of hydrogen) |
Using a pH meter (Electrochemical method) |
pH |
6.5-8.4 |
6.5-8.4 |
6.5-8.4 |
|
Nitrate (NO 3 ⁻ ) |
Spectrophotometric method |
mg/l |
0-5 |
5-30 |
>30 |
Table 3. Ecological groups of plants by degree of the salinity tolerance
|
Tolerant |
Semi-tolerant |
Sensitive |
Semi-Sensitive |
|
Barley ( Hordeum vulgare ) |
Sunflower ( Helianthus annuus ) |
Citrus ( Citrus spp .) |
ea ( Pisum sativum ) |
|
Sugar beet ( Beta vulgaris ) |
Wheat, Sorghum ( Triticum aestivum ) |
Cowpeas ( Vigna unguiculata ) |
Broccoli ( Brassica oleracea var. italica ) |
|
Cotton ( Gossypium spp .) |
Maize ( Zea mays ) |
Gram ( Cicer arietinum ) |
Cauliflower ( Brassica oleracea var. botrytis ) |
|
Spinach ( Spinacia oleracea ) |
Rice ( Oryza sativa ) |
eas ( Pisum sativum ) |
Cucumber ( Cucumis sativus ) |
|
Triticale ( Triticosecale ) |
omegranate ( Punica granatum ) |
Guar ( Cyamopsis tetragonoloba ) |
Tomato ( Solanum lycopersicum ) |
|
Rye ( Secale cereale ) |
otatoes ( Solanum tuberosum ) |
Lentil ( Lens culinaris ) |
Corn ( Zea mays ) |
|
Beets ( Beta vulgaris ) |
Oats ( Avena sativa ) |
Mung ( Vigna radiata ) |
Garlic ( Allium sativum ) |
|
Sorghum ( Sorghum bicolor ) |
Rice ( Oryza sativa ) |
|
Soybean ( Glycine max ) |
Beans ( Phaseolus spp .) |
Table 4. Classification of observed water based on the WA- WQI model
|
Water Quality Index Level |
Water Quality Status |
Grade |
Possible usage |
|
0-25 |
Excellent water quality |
A |
Drinking, Irrigation and Industrial |
|
26-50 |
Good water quality |
B |
Domestic, Irrigation and Industrial |
|
51-75 |
oor water quality |
C |
Irrigation and Industrial |
|
76-100 |
Very poor water quality |
D |
Irrigation |
|
>100 |
Unsuitable for drinking and fish culture |
E |
Restricted use for irrigation |
Table 5. Water quality classification by the CCME WQI model
|
QI range |
Ranking of water quality |
Remarks |
|
95-100 |
Excellent |
Water quality is protected with a virtual absence of threat or impairment; conditions very close to natural or pristine levels. |
|
80-94 |
Good |
Water quality is protected with only a minor degree of threat or impairment; conditions rarely depart from natural or desirable levels. |
|
65-79 |
Fair |
Water quality is usually protected but occasionally threatened or impaired; conditions sometimes depart from natural or desirable levels. |
|
45-64 |
Marginal |
Water quality is frequently threatened or impaired; conditions often depart from natural or desirable levels. |
|
0-44 |
oor |
Water quality is almost always threatened or impaired; conditions usually depart from natural or desirable levels. |
Table 6. General physico - chemical indicators of underground water
|
Samples |
Data |
рН |
NO ₃ ⁻ |
TDS |
Cl ⁻ |
Samples |
Data |
рН |
NO ₃ ⁻ |
TDS |
Cl ⁻ |
|
ф g |
2020-02 |
7.9 |
9.3 |
1386.4 |
5.93 |
CXI ф g |
2020-02 |
7.7 |
9.1 |
950 |
6.41 |
|
2020-05 |
7.9 |
9.9 |
1589.2 |
7.75 |
2020-05 |
7.8 |
10.3 |
1567 |
10.68 |
||
|
2020-08 |
7.7 |
9.6 |
1522.8 |
7.39 |
2020-08 |
7.5 |
9.7 |
1480 |
9.01 |
||
|
2020-11 |
8.3 |
9.5 |
1569.9 |
7.61 |
2020-11 |
7.7 |
9.6 |
1540 |
7.39 |
||
|
2021-02 |
7.6 |
9.7 |
1022.3 |
6.22 |
2021-02 |
6.8 |
9.1 |
1180 |
8.73 |
||
|
2021-05 |
7.8 |
9.8 |
1580.1 |
7.49 |
2021-05 |
7.9 |
8.4 |
1830 |
5.3 |
||
|
2021-08 |
7.7 |
9.8 |
1428.7 |
8.37 |
2021-08 |
7.9 |
10.2 |
1400 |
6.84 |
||
|
2021-11 |
8.7 |
9.6 |
1479.2 |
8.3 |
2021-11 |
7.4 |
9.5 |
1180 |
8.73 |
||
|
2022-02 |
7.4 |
10.8 |
1590 |
8.38 |
2022-02 |
7.6 |
10.8 |
1590 |
8.38 |
||
|
2022-05 |
8.2 |
12.5 |
1543.2 |
1.28 |
2022-05 |
8.5 |
12.6 |
1580 |
7.44 |
||
|
2022-08 |
7.6 |
14.2 |
1560 |
10.03 |
2022-08 |
7.9 |
8.6 |
1524.6 |
7.39 |
||
|
2022-11 |
6.9 |
10.3 |
1548.4 |
7.32 |
2022-11 |
7.8 |
9.6 |
1080.7 |
8.73 |
||
|
2023-02 |
7.5 |
9.9 |
1510.3 |
5.8 |
2023-02 |
7.2 |
10.1 |
1250 |
5.72 |
||
|
2023-05 |
7.8 |
13.2 |
1545 |
5.91 |
2023-05 |
7.6 |
13.5 |
1680 |
9.23 |
||
|
2023-08 |
7.7 |
13.6 |
1570 |
4.04 |
2023-08 |
6.9 |
15.7 |
1570 |
6.76 |
||
|
2023-11 |
7.9 |
12.4 |
1690 |
3.96 |
2023-11 |
6.9 |
14.5 |
1280 |
9.01 |
||
|
2024-02 |
7.3 |
10.1 |
1433.1 |
6.49 |
2024-02 |
7.5 |
9.1 |
1820.3 |
13.11 |
||
|
2024-05 |
7.6 |
9.8 |
1536.1 |
7.78 |
2024-05 |
7.5 |
11.6 |
2370 |
21 |
||
|
2024-08 |
7.8 |
9.6 |
1522.1 |
10.9 |
2024-08 |
8.1 |
8.6 |
1878.1 |
18.51 |
||
|
2024-11 |
7.2 |
6.8 |
940 |
6.41 |
2024-11 |
7.3 |
9.4 |
1210.0 |
8.28 |
||
|
00 ф g |
2020-02 |
7.8 |
9.1 |
1030 |
5.91 |
ф g |
2020-02 |
7.9 |
8.8 |
1420.4 |
7.79 |
|
2020-05 |
8.5 |
9.8 |
1610 |
6.41 |
2020-05 |
8.8 |
9.7 |
1566.7 |
9.47 |
||
|
2020-08 |
8.9 |
9.4 |
1578 |
7.77 |
2020-08 |
7.8 |
9.9 |
1710.5 |
10.35 |
||
|
2020-11 |
7.6 |
9.2 |
1060 |
8.34 |
2020-11 |
7.5 |
9.4 |
1360.4 |
8.4 |
||
|
2021-02 |
7.6 |
9.7 |
1490 |
6.2 |
2021-02 |
7.7 |
9.7 |
1426 |
6.21 |
||
|
2021-05 |
8.6 |
9.5 |
1568 |
8.06 |
2021-05 |
7.8 |
9.9 |
1600 |
8.7 |
||
|
2021-08 |
8.7 |
9.9 |
1530 |
5.01 |
2021-08 |
8.3 |
9.4 |
1595 |
10.04 |
|
2021-11 |
8.3 |
9.5 |
1166 |
8.06 |
2021-11 |
7.9 |
7.8 |
1470 |
8.36 |
||
|
2022-02 |
6.9 |
8 |
1010.6 |
4.1 |
2022-02 |
7.3 |
9.4 |
1479.5 |
5.76 |
||
|
2022-05 |
7.8 |
8.7 |
1460.4 |
5.91 |
2022-05 |
8.7 |
8.3 |
1890.7 |
9.73 |
||
|
2022-08 |
7.6 |
8.4 |
1480.4 |
4.03 |
2022-08 |
8.8 |
7.8 |
1010.7 |
9.75 |
||
|
2022-11 |
7.8 |
10 |
1307.5 |
8.34 |
2022-11 |
7.7 |
10.6 |
1312.4 |
6.7 |
||
|
2023-02 |
7.2 |
10.5 |
1250.6 |
6.65 |
2023-02 |
7.4 |
10.2 |
1540 |
5.68 |
||
|
2023-05 |
7.9 |
10.7 |
1550.5 |
5.03 |
2023-05 |
7.8 |
11.3 |
1505.2 |
5.03 |
||
|
2023-08 |
8.4 |
9.8 |
1590.7 |
4.84 |
2023-08 |
7.7 |
12.4 |
1546.7 |
4.04 |
||
|
2023-11 |
7.7 |
10.2 |
1420.5 |
5.75 |
2023-11 |
7 |
8.5 |
1496.4 |
5.03 |
||
|
2024-02 |
7.4 |
10.3 |
1376.1 |
9.47 |
2024-02 |
7.8 |
10.3 |
1556.1 |
6.57 |
||
|
2024-05 |
8.1 |
12.1 |
1487.1 |
7.64 |
2024-05 |
7.7 |
11.5 |
1587.3 |
5.03 |
||
|
2024-08 |
7.6 |
14.1 |
1334.1 |
7.97 |
2024-08 |
7.1 |
10.3 |
1433.1 |
5 |
||
|
2024-11 |
7.4 |
8.6 |
780 |
4.04 |
2024-11 |
7.4 |
12.9 |
1780 |
13.9 |
||
|
ID Ф g |
2020-02 |
7.9 |
13.7 |
1720 |
4.97 |
CD Ф g |
2020-02 |
7.8 |
10.1 |
1430.5 |
5.91 |
|
2020-05 |
8.5 |
13.6 |
1976 |
9.3 |
2020-05 |
8.6 |
13.5 |
1620.6 |
7.75 |
||
|
2020-08 |
8.8 |
12.5 |
1710 |
9.91 |
2020-08 |
8.8 |
14.7 |
1671.3 |
9.89 |
||
|
2020-11 |
8.2 |
10.3 |
1569.8 |
9.19 |
2020-11 |
8.5 |
13.4 |
1560.1 |
8.4 |
||
|
2021-02 |
7.6 |
15.6 |
1522.6 |
6.23 |
2021-02 |
7.9 |
10.6 |
1540.4 |
7.76 |
||
|
2021-05 |
8.6 |
17.9 |
1567.9 |
8.69 |
2021-05 |
7.3 |
13.9 |
1430.6 |
8.61 |
||
|
2021-08 |
8.2 |
15.6 |
1578.5 |
11.2 |
2021-08 |
8.5 |
14.3 |
1527.1 |
9.3 |
||
|
2021-11 |
7.6 |
16.3 |
1446.6 |
6.61 |
2021-11 |
8.7 |
11.4 |
1585.3 |
9.74 |
||
|
2022-02 |
7.7 |
10.7 |
1488 |
5.24 |
2022-02 |
7.5 |
11.5 |
1450.6 |
5.8 |
||
|
2022-05 |
7.8 |
11.6 |
1980.6 |
5.03 |
2022-05 |
8.4 |
13.5 |
1550.3 |
5.03 |
||
|
2022-08 |
8.7 |
13.7 |
1510.6 |
6.2 |
2022-08 |
8.6 |
14.6 |
1567.6 |
10.21 |
||
|
2022-11 |
7.8 |
12.8 |
1515.7 |
8.34 |
2022-11 |
7.6 |
12.5 |
1470.7 |
8.31 |
||
|
2023-02 |
7.5 |
8.7 |
1581.1 |
7.84 |
2023-02 |
8.1 |
10.2 |
1510 |
7.39 |
||
|
2023-05 |
8.6 |
10.4 |
1526.6 |
8.24 |
2023-05 |
8.6 |
13.5 |
1580.4 |
9.13 |
||
|
2023-08 |
8.8 |
11.6 |
1586.6 |
9.2 |
2023-08 |
8.3 |
14.6 |
1567.3 |
10.66 |
||
|
2023-11 |
8.4 |
13.6 |
1561.5 |
7.96 |
2023-11 |
8.4 |
13.5 |
1456.3 |
8.15 |
||
|
2024-02 |
7.6 |
10.3 |
918.9 |
7.23 |
2024-02 |
7.6 |
10.1 |
1564.5 |
6.8 |
||
|
2024-05 |
7.7 |
11.5 |
1100.3 |
6.11 |
2024-05 |
7.4 |
7.6 |
1566.5 |
7.22 |
||
|
2024-08 |
7.8 |
11.3 |
1000.1 |
6.42 |
2024-08 |
7.7 |
9.1 |
1000 |
6.7 |
||
|
2024-11 |
7.3 |
10.7 |
1490.0 |
10.55 |
2024-11 |
7.5 |
9.1 |
1460.0 |
10.25 |
||
|
ф g |
2020-02 |
7.8 |
9.1 |
1516.2 |
6.41 |
co Ф g |
2020-02 |
8.3 |
10.2 |
1460.4 |
5.53 |
|
2020-05 |
8.6 |
10.7 |
1576.5 |
7.56 |
2020-05 |
8.8 |
13.2 |
1576.5 |
6.48 |
||
|
2020-08 |
8.8 |
11.3 |
1710.3 |
9.89 |
2020-08 |
8.6 |
15.3 |
1710.2 |
9.89 |
||
|
2020-11 |
7.7 |
10.1 |
1564.7 |
5.42 |
2020-11 |
8.5 |
12.3 |
1460.3 |
8.4 |
||
|
2021-02 |
7.7 |
10.3 |
1440.4 |
4.95 |
2021-02 |
7.7 |
10.3 |
1442.4 |
7.76 |
||
|
2021-05 |
7.3 |
12.5 |
1540.4 |
5.76 |
2021-05 |
8.4 |
12.5 |
1520.3 |
6.9 |
||
|
2021-08 |
7.4 |
13.4 |
1588.7 |
5.28 |
2021-08 |
7.6 |
13.6 |
1580.2 |
8.74 |
||
|
2021-11 |
7.8 |
11.6 |
1597.3 |
6.01 |
2021-11 |
7.5 |
14.7 |
1420.3 |
7.56 |
||
|
2022-02 |
7.4 |
9.6 |
1490.3 |
5.04 |
2022-02 |
8.5 |
10.4 |
1100.6 |
5.27 |
||
|
2022-05 |
8.6 |
10.3 |
1534.2 |
7.84 |
2022-05 |
7.9 |
12.6 |
1491.5 |
6.09 |
||
|
2022-08 |
8.7 |
12.4 |
1642.5 |
6.93 |
2022-08 |
7.8 |
13.7 |
1567.3 |
6.04 |
||
|
2022-11 |
8.5 |
10.2 |
1578.3 |
5.46 |
2022-11 |
6.9 |
13.3 |
1567.8 |
8.4 |
||
|
2023-02 |
8.3 |
10.3 |
1467.3 |
6.6 |
2023-02 |
7.7 |
10.4 |
1550.5 |
6.43 |
||
|
2023-05 |
8.5 |
11.4 |
1589.3 |
7.45 |
2023-05 |
8.7 |
11.1 |
1545.7 |
6.33 |
||
|
2023-08 |
8.8 |
13.5 |
1554.3 |
7.87 |
2023-08 |
8.6 |
12.5 |
1567.2 |
5.03 |
||
|
2023-11 |
8.2 |
12.7 |
1458.2 |
6.6 |
2023-11 |
7.7 |
13.5 |
1547.3 |
4.16 |
||
|
2024-02 |
7.8 |
6.5 |
1100 |
5.13 |
2024-02 |
7.8 |
11.3 |
730 |
6.6 |
||
|
2024-05 |
7.5 |
9.1 |
1300 |
5.86 |
2024-05 |
6.1 |
8.3 |
1270 |
8.08 |
||
|
2024-08 |
7.1 |
8.6 |
1560 |
7.42 |
2024-08 |
7.3 |
9.3 |
1456.1 |
7.78 |
||
|
2024-11 |
7.6 |
7.6 |
970.0 |
5.42 |
2024-11 |
7.8 |
8.0 |
1020.0 |
8.1 |
||
|
О) ф g |
2020-02 |
8 |
8.8 |
1760.8 |
5.54 |
о Ф g |
2020-02 |
8.7 |
8.8 |
1460.3 |
5.52 |
|
2020-05 |
7.8 |
9.7 |
1676.6 |
6.49 |
2020-05 |
8.8 |
9.7 |
1576.3 |
6.48 |
||
|
2020-08 |
7.8 |
12.6 |
2140.4 |
10.66 |
2020-08 |
7.8 |
9.9 |
1710.7 |
9.89 |
||
|
2020-11 |
7.6 |
8.8 |
1254.7 |
8.08 |
2020-11 |
7.7 |
9.3 |
1540.8 |
7.39 |
||
|
2021-02 |
7.5 |
10.2 |
1443 |
8.68 |
2021-02 |
7.7 |
10.3 |
1569.2 |
6.25 |
||
|
2021-05 |
8.3 |
11.3 |
1580.3 |
7.24 |
2021-05 |
7.5 |
10.6 |
1550.5 |
6.21 |
||
|
2021-08 |
7.4 |
10.2 |
1650.5 |
7.63 |
2021-08 |
6.4 |
11.3 |
1580.4 |
8.74 |
||
|
2021-11 |
7.7 |
11.5 |
1480.6 |
7.22 |
2021-11 |
7.6 |
11.6 |
1570.3 |
6.64 |
||
|
2022-02 |
6.9 |
11.6 |
1410.5 |
4.1 |
2022-02 |
6.9 |
10.2 |
1810.5 |
4.1 |
||
|
2022-05 |
8.9 |
12.7 |
1460.6 |
5.13 |
2022-05 |
7.6 |
11.4 |
1560.4 |
5.22 |
||
|
2022-08 |
7.8 |
14.6 |
1565.3 |
6.07 |
2022-08 |
7.6 |
12.6 |
1561.4 |
7 |
||
|
2022-11 |
7.9 |
13.8 |
1445.7 |
8.08 |
2022-11 |
7.6 |
11.5 |
1546.1 |
7.22 |
||
|
2023-02 |
7.7 |
9.9 |
1450.5 |
6.42 |
2023-02 |
8.4 |
9.9 |
1405.7 |
5.29 |
||
|
2023-05 |
7.8 |
10.7 |
1590.5 |
5.91 |
2023-05 |
6.9 |
10.2 |
1567.2 |
4.46 |
||
|
2023-08 |
7.6 |
10.4 |
1530.1 |
5.03 |
2023-08 |
7.7 |
11.3 |
1567.2 |
4.04 |
||
|
2023-11 |
7.9 |
11.5 |
1420.5 |
4.43 |
2023-11 |
7.9 |
10.3 |
1456.2 |
4.43 |
||
|
2024-02 |
8.3 |
10.3 |
1456.1 |
8.03 |
2024-02 |
8.4 |
10.3 |
1533.1 |
4.4 |
□Winter I Spring □ Summer DAutumn □ Winter E Spring □ Summer □ Autumn
TDS СГ
□Winter I Spring DSummer DAutumn DWinter E Spring □ Summer DAutumn
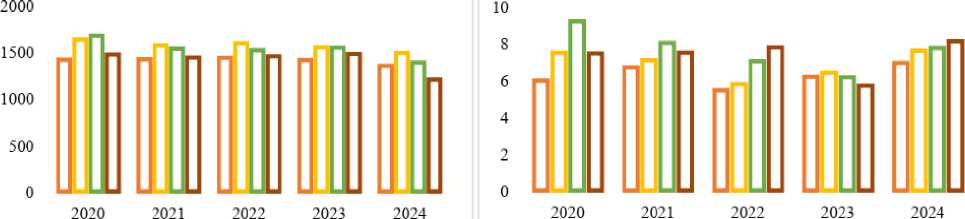
Figure 2: Quantitative changes in water quality indicators (pH, NO₃ ⁻ , TDS, Cl ⁻ ) during the seasons
Table 7. Overall Water Quality Index for sensitive crops
|
Data |
Samples |
WA-WQI |
Grade |
CCME WQI |
||
|
Index |
Water quality |
Index |
Water quality |
|||
|
о CM о CM |
S1 |
238.51 |
Unsuitable for drinking and fish culture |
E |
32.17 |
Poor |
|
S2 |
229.76 |
Unsuitable for drinking and fish culture |
E |
32.13 |
oor |
|
|
S3 |
214.59 |
Unsuitable for drinking and fish culture |
E |
18.54 |
Poor |
|
|
S4 |
246.74 |
Unsuitable for drinking and fish culture |
E |
19.55 |
oor |
|
|
S5 |
281.51 |
Unsuitable for drinking and fish culture |
E |
16.33 |
oor |
|
|
S6 |
262.89 |
Unsuitable for drinking and fish culture |
E |
14.50 |
oor |
|
|
S7 |
250.58 |
Unsuitable for drinking and fish culture |
E |
17.48 |
oor |
|
|
S8 |
258.32 |
Unsuitable for drinking and fish culture |
E |
14.69 |
oor |
|
|
S9 |
265.53 |
Unsuitable for drinking and fish culture |
E |
31.25 |
oor |
|
|
S10 |
245.04 |
Unsuitable for drinking and fish culture |
E |
17.74 |
oor |
|
|
S11 |
236.20 |
Unsuitable for drinking and fish culture |
E |
18.54 |
oor |
|
|
S12 |
262.90 |
Unsuitable for drinking and fish culture |
E |
31.15 |
oor |
|
|
о см |
S1 |
224.86 |
Unsuitable for drinking and fish culture |
E |
26.18 |
Poor |
|
S2 |
224.73 |
Unsuitable for drinking and fish culture |
E |
32.58 |
oor |
|
|
S3 |
228.01 |
Unsuitable for drinking and fish culture |
E |
18.22 |
Poor |
|
|
S4 |
243.18 |
Unsuitable for drinking and fish culture |
E |
31.83 |
oor |
|
|
S5 |
282.73 |
Unsuitable for drinking and fish culture |
E |
18.21 |
oor |
|
|
S6 |
259.73 |
Unsuitable for drinking and fish culture |
E |
16.72 |
oor |
|
|
S7 |
249.05 |
Unsuitable for drinking and fish culture |
E |
32.00 |
oor |
|
|
S8 |
253.21 |
Unsuitable for drinking and fish culture |
E |
31.13 |
oor |
|
|
S9 |
248.16 |
Unsuitable for drinking and fish culture |
E |
31.55 |
oor |
|
|
S10 |
250.09 |
Unsuitable for drinking and fish culture |
E |
31.68 |
oor |
|
|
S11 |
239.86 |
Unsuitable for drinking and fish culture |
E |
32.38 |
oor |
|
|
S12 |
236.39 |
Unsuitable for drinking and fish culture |
E |
32.43 |
oor |
|
|
см см о см |
S1 |
253.37 |
Unsuitable for drinking and fish culture |
E |
33.46 |
Poor |
|
S2 |
236.92 |
Unsuitable for drinking and fish culture |
E |
19.83 |
oor |
|
|
S3 |
206.20 |
Unsuitable for drinking and fish culture |
E |
33.81 |
Poor |
|
|
S4 |
229.24 |
Unsuitable for drinking and fish culture |
E |
18.04 |
oor |
|
|
S5 |
260.60 |
Unsuitable for drinking and fish culture |
E |
19.44 |
oor |
|
|
S6 |
255.09 |
Unsuitable for drinking and fish culture |
E |
19.21 |
oor |
|
|
S7 |
245.33 |
Unsuitable for drinking and fish culture |
E |
15.52 |
oor |
|
|
S8 |
468.51 |
Unsuitable for drinking and fish culture |
E |
19.82 |
oor |
|
|
S9 |
248.58 |
Unsuitable for drinking and fish culture |
E |
19.72 |
oor |
|
|
S10 |
256.34 |
Unsuitable for drinking and fish culture |
E |
31.76 |
oor |
|
|
S11 |
243.00 |
Unsuitable for drinking and fish culture |
E |
32.24 |
oor |
|
|
S12 |
240.35 |
Unsuitable for drinking and fish culture |
E |
48.21 |
oor |
|
|
со см о см |
S1 |
255.08 |
Unsuitable for drinking and fish culture |
E |
34.23 |
Poor |
|
S2 |
253.19 |
Unsuitable for drinking and fish culture |
E |
31.10 |
oor |
|
|
S3 |
229.58 |
Unsuitable for drinking and fish culture |
E |
32.80 |
Poor |
|
|
S4 |
448.40 |
Unsuitable for drinking and fish culture |
E |
32.70 |
oor |
|
|
S5 |
254.40 |
Unsuitable for drinking and fish culture |
E |
17.08 |
oor |
|
|
S6 |
262.37 |
Unsuitable for drinking and fish culture |
E |
18.76 |
oor |
|
|
S7 |
248.89 |
Unsuitable for drinking and fish culture |
E |
17.34 |
oor |
|
|
S8 |
249.37 |
Unsuitable for drinking and fish culture |
E |
17.76 |
oor |
|
|
S9 |
236.51 |
Unsuitable for drinking and fish culture |
E |
32.58 |
oor |
|
|
S10 |
235.28 |
Unsuitable for drinking and fish culture |
E |
33.00 |
oor |
|
|
S11 |
235.83 |
Unsuitable for drinking and fish culture |
E |
20.61 |
oor |
|
|
S12 |
226.25 |
Unsuitable for drinking and fish culture |
E |
17.05 |
oor |
|
|
о см |
S1 |
192.66 |
Unsuitable for drinking and fish culture |
E |
32.60 |
Poor |
|
S2 |
305.16 |
Unsuitable for drinking and fish culture |
E |
28.79 |
oor |
|
|
S3 |
188.36 |
Unsuitable for drinking and fish culture |
E |
28.74 |
Poor |
|
|
S4 |
195.15 |
Unsuitable for drinking and fish culture |
E |
31.29 |
oor |
|
|
S5 |
162.55 |
Unsuitable for drinking and fish culture |
E |
32.94 |
oor |
|
|
S6 |
180.36 |
Unsuitable for drinking and fish culture |
E |
32.55 |
oor |
|
|
S7 |
161.09 |
Unsuitable for drinking and fish culture |
E |
34.27 |
oor |
|
|
S8 |
166.28 |
Unsuitable for drinking and fish culture |
E |
33.53 |
oor |
|
|
S9 |
200.54 |
Unsuitable for drinking and fish culture |
E |
30.74 |
oor |
|
|
S10 |
179.19 |
Unsuitable for drinking and fish culture |
E |
20.81 |
oor |
|
|
S11 |
201.40 |
Unsuitable for drinking and fish culture |
E |
19.34 |
oor |
|
|
S12 |
173.26 |
Unsuitable for drinking and fish culture |
E |
20.98 |
oor |
|
WA-WQI
CCMB-WQI
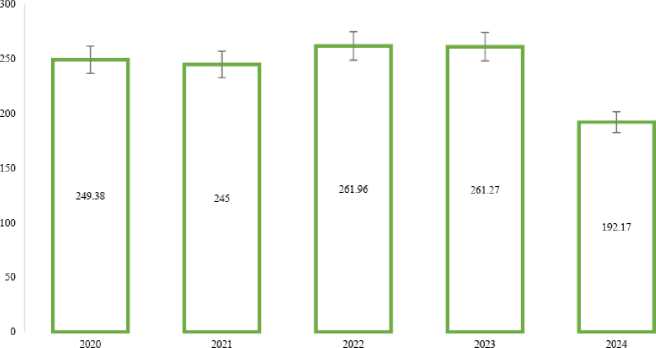
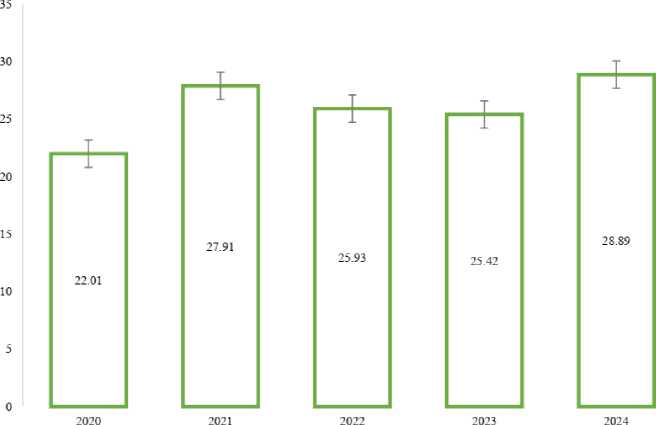
Figure 3: Water Quality Indices of Water Samples Taken from a Total of Twelve Wells
According to results from WA-WQI and CCME WQI models, the potential for irrigating low-tolerance plants is nearly 100 % restricted. The major parameters negatively affecting water quality are TDS, NO₃⁻, and Cl⁻, with values significantly exceeding FAO standards. Groundwater typically has high mineral content, with its qualitative variations potentially attributable to agricultural activities and geological rock formations (Ojukwu et al., 2021; Alexakis et al., 2022; Uddin et al., 2023; Mohseni et al., 2024). Figure 3 illustrates the mean values obtained from WA-WQI and CCME WQI models. Both models indicate extremely low water quality indices.
However, this water can be used for irrigating highly tolerant crops under limited water availability conditions, as tolerant plants can adapt to various challenging ecological conditions.
CONCLUSIONS
The overall water quality index of groundwater formed in the Amudarya region is very low, limiting its direct use for irrigating low-tolerance crops. According to FAO guidelines, improving water quality requires managing irrigation and growth conditions while considering each plant's ecological tolerance level. Additionally, agricultural water conservation and ecological sustainability can be achieved by planting salt-tolerant crops. So according to our results we can make following recommendations:
-
1 .To improve groundwater quality in the Amudarya region, it is necessary to enhance irrigation systems, select salt-tolerant plants, and implement optimal water usage in irrigation.
-
2 . Agricultural water conservation, water quality improvement, and agrocenosis sustainability can be achieved through planting salt-tolerant species. Therefore, establishing plantations with high-tolerance crops is essential.
CONFLICTS OF INTEREST
The authors declare that they have no potential conflicts of interest.
