Evaluation of Message Dissemination Techniques in Vehicular Ad Hoc Networks using Node Movement in Real Map

Author: Sanjoy Das, D.K.Lobiyal
Journal: International Journal of Computer Network and Information Security(IJCNIS) @ijcnis
Article in issue: 5 vol.8, 2016.
Free access
In this paper, we have evaluated the performance of flooding and probabilistic flooding broadcast methods in a VANET using real city map. A comparative analysis between the performance of these methods with varying traffic density and nodes speed has been conducted. Here, we have considered real city maps extracted from US census TIGER database. Node movements are generated using Intelligent Driving Model for lane Changing (IDM_LC) through VanetMobiSim mobility generator. A different probability for message dissemination is considered for the probabilistic broadcast method to investigate an appropriate probability value that may give best results. Different node densities, Sparse, Intermediate and Dense are considered. The results obtained show that in dense traffic scenario probabilistic flooding method achieves maximum packet delivery ratio for a specific value of p (i.e. 0.1). In sparsely populated network, the PDR is low as compared to other traffic conditions. In a sparse traffic density both the method perform better at high node mobility. But in intermediate and dense traffic scenario performance of both the methods is better in low node mobility.
Flooding, Probabilistic Flooding, Packet Delivery Ratio, Traffic, Traffic Light
Short address: https://sciup.org/15011525
IDR: 15011525
Text of the scientific article Evaluation of Message Dissemination Techniques in Vehicular Ad Hoc Networks using Node Movement in Real Map
Published Online May 2016 in MECS
Over the last decade there is unexpected increases in personnel, public, utility vehicles on the road. The existing roads are almost saturated everywhere and unable to accommodate this growth. An efficient traffic management is a major concern among car manufacturing organization, researchers and academicians. The advent of VANET is how to manage traffic efficiently. This is a novel class of Mobile Ad hoc Network (MANET), where nodes are vehicles and their movements are confined to the road structure. There are two types of communication supported, one form is Vehicle to Vehicle (V2V) and the other is Vehicle to fixed road side infrastructure (V2R).
In both the methods, vehicles can communicate to other vehicles or road side units either directly or through multiple hops. It depends on the position of the vehicles. Further, the road side units (RSU) can also communicate with other RSU via single or multi hop. The RSU supports numerous applications like road safety, message delivery; maintaining connectivity by sending, receiving or forwarding data in the network. There is wide variety of services supported by VANET and they are categorized into two areas - safety and non-safety. The safety messages are always delivered to intended destination with higher priority than non-safety information. Some of the safety services are collision warnings, road sign alarms, blind turn warning, congested road notification etc. Some of the non-safety services are free flow tolling, parking availability notification, parking spot locator, internet connections facility, electronic toll collection, and a variety of multimedia services etc. [1], [2]. Timely dissemination of messages and proper action executed by drivers can save many lives. So, data dissemination to all affected vehicles can avoid fatal accidents on the road.
In this paper, we have evaluated VANET in a city scenario, where the city is well planned and follows traffic rules. The node movements are generated in real city map which is extracted from TIGER database. The network is tested and evaluated with varying node density (i.e. sparse to dense) and node movements. The well-known flooding and probabilistic broadcast methods are used to disseminate messages. The city considered for the simulation works considered the traffic lights and multilane. The number of traffic lights is fixed i.e. 6. The results obtain through simulation shows that, when probability of dissemination is 0.1the network performance is maximum.
The rest of paper is structured as follows: In, Section II we presented related works and evaluation of VANET based on realistic models. In section III proposed network model, an overview of flooding, probabilistic broadcasting methods and Intelligent Driver Model with lane Changing (IDM_LC) model are presented. Section
IV consists of simulation and result analysis. The paper is concluded in section V.
-
II. Related Works
There is leaps and bounds growth in the sensor and wireless communication technologies. The merging of these technologies with vehicles make vehicular network more and more attractive among researchers, and car manufacturing organizations. Many works have been carried out in the context of message dissemination to a particular geographical location. There are several projects completed and some are ongoing based on safety and non- safety messages dissemination. Some of them are Car Talk, Fleet Net–Internet on the Road, NoW (Network on Wheel) [1], [2] with the emphasis on deployment in the real world. The main focus of all these projects is to provide better safety, comfort to human beings and timely dissemination of message from one location to another location. Some of the message delivery protocols proposed for VANET attempt to deliver a message to a geographic region rather than to a node. These protocols are called geocast routing [26]. In [3] authors use flooding method but it limits the flooding to a small geographic region called forwarding zone instead of whole network area. The forwarding zone is computed based on the position of sender and geocast region. In [4] authors have improved the method proposed in [3] and incorporate it with TORA. The simulation study shows that their method reduces overhead of geocast message delivery, and maintain high accuracy in data delivery. The protocol above only uses simple flooding technique for message dissemination inside the geocast region. The flooding technique is the simplest and guaranteed broadcasting method to deliver message to a particular geographical region i.e. geocast region. Further, in simple flooding technique [5], [6] a vehicle that receives a broadcast message for the first time has the responsibility to rebroadcast the message for its onward transmission. In this method, number of transmissions increases with increasing number of nodes in the network. In [7] authors have shown an extensive analysis of Geographic Source Routing (GSR) with DSR, AODV for VANET in city scenarios. They have evaluated these protocols on realistic vehicular traffic for a particular city scenario. The real city map is considered and converted to graph for the analysis. Their result shows that GSR performs better than DSR and AODV in terms of end-to-end delivery of messages and throughput. In [8] a probabilistic and opportunistic flooding algorithm (POFA) is proposed to control rebroadcasts and retransmissions opportunistically in a sensor network. In this protocol every node only selects its one hop neighbors to rebroadcast the message [8]. The criterion for rebroadcasting the message depends on link error rate among neighbor nodes. The sender of a message controls the retransmission of the message opportunistically by checking the reception of the message by its neighbors. The simulation results show that the protocol performs better than flooding and increases the lifetime of the network. Authors in [10] addressed the spatial broadcast problem that occurs due to unwanted rebroadcast message at the same time in a dense traffic scenario. This situation may lead to high channel contention and collisions. The probabilistic Inter Vehicle Geocast (p-IVG) is a better solution to this problem. The rebroadcasting of messages follows a probabilistic approach which depends on the traffic density surrounding the vehicles. The result obtain shows that receptions rate is high, lower channel contention and faster dissemination of message to distant vehicles. In [15] only energy consumption parameter is considered for performance analysis of LAR1 protocol with DSR and AODV in densely populated ad hoc networks. The results show that LAR1 performs better than DSR and AODV protocol in highly dense network. But in low density, the performance of DSR protocol shows better than others. In [23] authors have proposed a realistic model for VANET based on vehicular motion. For the modeling of the network, real street data is considered. They have done performance analysis with DSR protocol, and has compared their model with random way point mobility model. In [24] authors considered real map of Zurich from TIGER database and evaluated performance of AODV and GPSR routing protocols on highway and city scenarios. They have evaluated packet delivery ratio, normalized routing load etc. In [11] authors have analyzed performance of LAR1 protocol in a city scenario with Manhattan mobility model. The results obtained shows that end-to-end delay is high in sparsely populated network, but in densely populated network it is low. The works discussed above, are mostly uses random waypoint mobility model for performance analysis of VANET. But, random way mobility model is unfit for modeling of nodes in a VANET. Therefore, we have considered real map extracted from US census TIGER database, and nodes mobility generated in the presence of traffic lights and multilane supports.
-
III. Network Model
We have considered a network model that is well-structured for city scenario. In this scenario, roads are well organized and follow traffic rules. In this proposed model we make an effort to imitate a real city scenario as shown in Fig.1.The city structure has some constraints like presence of high rise buildings and other physical obstacle that may be responsible for poor visibility and limited connectivity among vehicles on the road. Further, this badly affects the radio signal propagation. The city structure is divided into different sectors and they are connected via roads available. The area restricted by road is denoted as sector. The movement of vehicles depends on city road structure and traffic signs available on the road. It is very seldom that source and destination fall in each other transmission range [25]. The message transmission in the city scenario mostly follows multihop environment. In this scenario, intermediate vehicles play important role in routing the message. Further, it depends on the traffic densities on the road that always vary. During late night, only few vehicles plying on the road and during office hours roads have heavy traffic volume. We have adhered varying traffic density with respect of time into our proposed model. We have considered different traffic density as shown in Table-1.
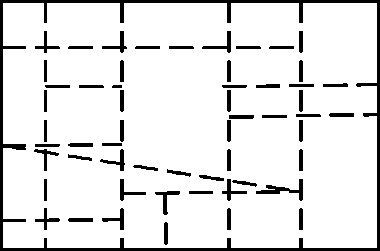
Fig.1. Structured City Scenario
Table 1. Different types of Traffic
|
Traffic Density |
No. of nodes |
|
Sparse |
10,20,30,40,50 |
|
Intermediate |
100 |
|
Dense |
150 |
-
A. Overview of Broadcasting Techniques and Mobility Model
The flooding [6] is the simplest method to deliver a message to all nodes present in a specific area. This is the most guaranteed geocasting mechanism. Here, a node that receives a message for the first time; will retransmit the message to all its neighbors. This method only guarantees that, a message will be definitely delivered to the destination in a connected network. Here, the packet delivery ratio is high, but the overhead is also very high. Suppose n nodes are participating in message dissemination in a geocast region. As the number of nodes n increases, no. of packet to be transmitted also increases. It causes redundant data transmission and inefficient use of network resources [26]. This method ensures that, nodes present in the geocast region receive the copy of a geocast packet. Sometimes it leads to broadcast storm problem [12] due to high contention, collisions and redundant rebroadcast of messages. To mitigate the broadcast storm problem some solutions related to VANET is proposed in [13].
Flooding Algorithm [6], [14], [15]
Pseudo code:
Source (S) node send packet (Pkt)
IF node ni received Pkt for first time // i= 1, 2, 3…
{
IF (neighbour of n i !=NULL)
{ broadcast (Pkt) to its neighbour node
}
} ELSE DISCARD Pkt EXIT
The Probabilistic technique of broadcast [6] is a type of restricted flooding. To mitigate the shortcoming of flooding this method was introduced. In this method, upon receiving a non-duplicate packet nodes further rebroadcast it with probability p [26]. where (0 < p ≤ 1).
Probabilistic Broadcast Algorithm [6], [11], [15] Pseudo code:
Source node(S) sends packet (pkt)
IF node n i received Pkt for first time // i= 1, 2, 3…
{
IF (neighbour n i ! =NULL) {
Choose value probability of P // 0 < p ≤ 1 Broadcast (pkt) to its neighbour node with P }
}
ELSE
DISCARD Pkt
EXIT
-
B. Description of Mobility Generator
VanetMobiSim is an extension of CANU Mobility Simulation Environment (CanuMobiSim) [16], a flexible framework for user mobility modeling. The VanetMobiSim [17, 18] extension focuses on vehicular mobility, and features new realistic automotive motion models at both macroscopic and microscopic levels. The most important features supported are multi-lane roads, separate directional flows, differentiated speed constraints and traffic signs at intersections. At macroscopic level, it provides realistic communication between Vehicle-to-Vehicle (V2V) and Vehicle to Roadside (V2R) infrastructure [27]. There are various factors which regulate vehicle speed, speed of nearby vehicles, and overtake each other, traffic signs and stop signs on road intersections.
Intelligent Driving Model with Lane Changing (IDM_LC)
The IDM_LC [16, 17, 18] model, vehicles movement is controlled by smart intersection management. This model supports the multilane road and vehicles that are able to change lane if multilane is present. Vehicles can over take each other; behave according to the traffic lights sign. At the intersection point vehicles moves on the same lane if it is exist, otherwise vehicles moves on their right approach to a merging point. If a vehicle is unable to move through merging point due to heavy traffic, it will wait until the point becomes free. We have considered real city map for generation of vehicular movement. The city map considered for the simulation is extracted from United States Census Bureau, TIGER [22] (Topologically Integrated Geographic Encoding and
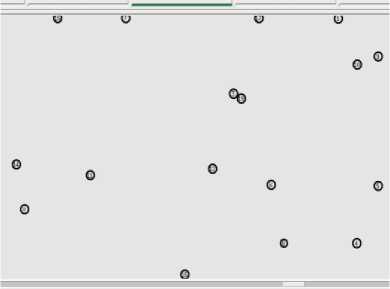
Referencing) database of geographic and cartographic information. This database consists variety of data e.g. roads, water, buildings, borders etc. The vehicular movement generated through VanetMobiSim [19] of different traffic density is shown in Fig.2, Fig.3.These figures shows the node movements generated with the help of city maps. The Fig. 2 shows the snapshot of simulation of 10 nodes at speed 20m/s at simulation time 100.843 s. Fig.3 shows the snapshot of simulation of 50 nodes at speed of 30m/s at simulation time 410.242 s.
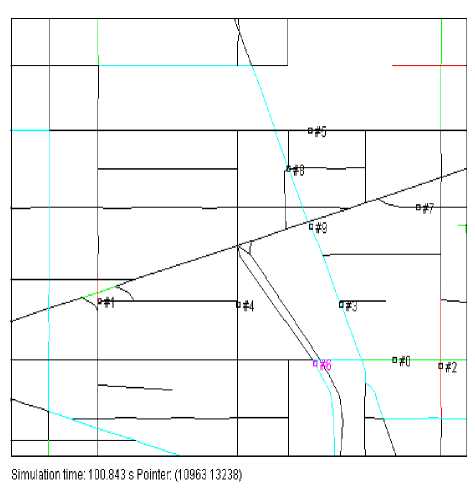
Fig.2. Node Movements of 10 Nodes at Speed of 20m/s.
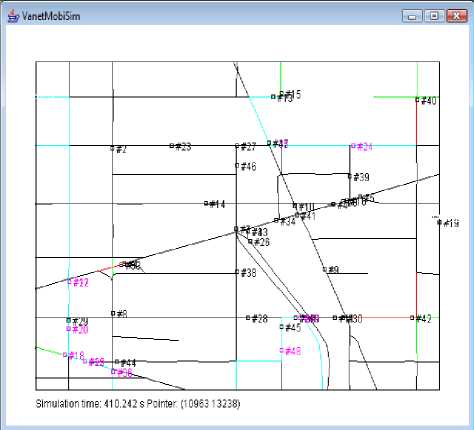
Fig.3. Node Movements of 50 Nodes at Speed of 30m/s.
-
IV. Simulation and Result Analysis
The simulation has been carried out in network simulator NS-2 [20] to evaluate the performance of simple flooding and probabilistic broadcast protocols for
VANETs. Table 2, shows different simulation parameters with their specification and Table 3, shows the parameter values considered for simulation. The Mobility model IDM_LC is considered with traffic lights and multilane support. The results obtained for probabilistic broadcast and flooding have been presented in Table 4. For performance evaluation packet delivery ratio is computed for both the protocols. Further, awk programming and Matlab [21] are used for analyzing the simulation results and plotting the graphs. Fig.4 (a),(b) and (c) shows the various snapshots of node movements during simulation conducted in NS-2. Fig.4 (a) shows node movements of probabilistic broadcast with probability 0.4 of 10 nodes at speed 20 m/s. Fig.4 (b) shows node movements of probabilistic broadcast with probability 0.2 of 20 nodes at speed 20 m/s. Fig.4 (c) shows snapshot of node movements of probabilistic broadcast with probability 0.2 of 50 nodes at speed 30 m/s.
-
Table 2. Simulation Parameters
Parameter
Specifications
MAC Protocol
IEEE 802.11
Radio Propagation Model
Two-ray ground reflection model
Channel type
Wireless channel
Antenna model
Omni-directional
Mobility Model
Intelligent Driver Model with Lane Changing (IDM-LC)
City Map
Tiger Database
-
Table 3. Values of Simulation Parameters
Parameter
Values
Simulation Time (Ns-2)
1000s
Simulation Time (VanetMobiSim)
1000s
Simulation Area (X *Y )
1000 m x 1000 m
Number of Traffic Lights
6
Number of lane
2
Transmission Range
250 m
No of Nodes (Vehicles)
10,20,30,40,50,100,150
Bandwidth
2 Mbps
Speed of nodes ( m/s)
10 ,20,30
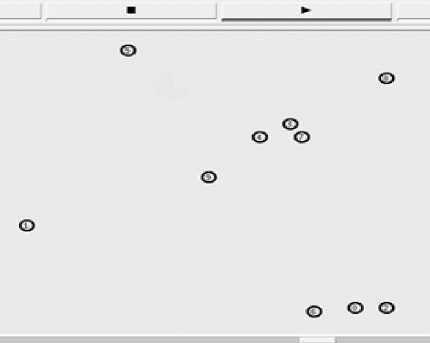
(a) Node = 10, speed =20, p=0.4
(b) Node= 20, speed=20, p=0.2
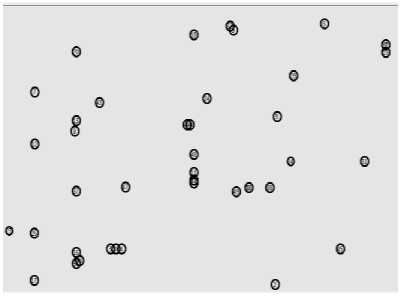
(c) Node= 50, speed=30, p=0.2
Fig.4.(a-c). Snapshot of Various Simulation Runs and Node Movements during Simulation in NS-2.
Packet Delivery Ratio
Packet delivery ratio is a very important metric for evaluating performance of any routing protocol. The overall performance of a protocol depends on various parameters chosen for the simulation. The packet size, no of nodes, node speed, transmission range and the terrains structure of the network considered in the simulation are some of the factors contribute in the performance evaluation of routing protocol. The packet delivery ratio can be obtained from the total number of data packets arrived at destinations divided by the total data packets sent from the sources.
Packet Delivery Ratio = T total packets received by all destination node /T total packet send by all source node.
Fig.5 shows the packet delivery ratio of both the protocols for sparse traffic density. Simulation has been carried for 10 nodes each with variable speed. The results obtained here shows that both the protocol flooding and probabilistic method results obtained are very close to each other. At a node speed of 20 m/s, the maximum achievable PDR obtained is 14.0345 when p=0.7, but flooding achieved 14. The trends show that PDR increases from the speed of 10 m/s up to the node speed of 20 m/s. However, at the node speed of 30 m/s marginal decreases is noticed in PDR. This variation in PDR occurs due to city structure and node connectivity. The connectivity among nodes depends on the road structure and moving directions of nodes. From fig. 4(a) it is clearly visible that nodes are scattered throughout the simulation area.
Fig. 6 shows the packet delivery ratio of flooding and probabilistic broadcasting method in a sparse traffic scenario of 20 nodes with varying nodes speed. At the initial speed of 10 m/s, the maximum value of PDR is 18.6207 when message is broadcast with p=0.2. At the node speed of 20 m/s PDR decreases for all value of p. Further, at 30 m/s PDR value increases. The maximum value of PDR achieved is 18.9655 for p=0.1 at the speed of 30 m/s.
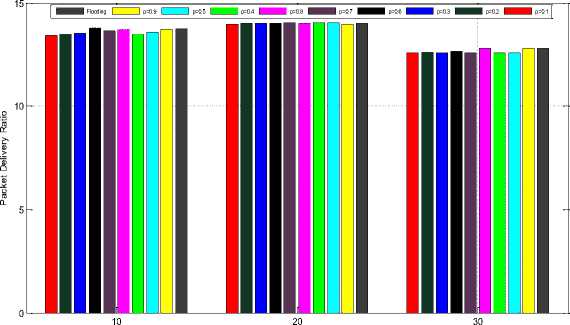
Fig. 7 shows the PDR for sparse traffic condition for 30 nodes for both the broadcasting techniques. The maximum value of PDR is 27.55652that is achieved at node speed of 30 m/s and p=0.4. Both the protocol performs better when node speed is 20 m/s and 30 m/s. The performance of these protocols is good at node speed of 30 m/s. Here, also the performance of flooding is very close to probabilistic method.
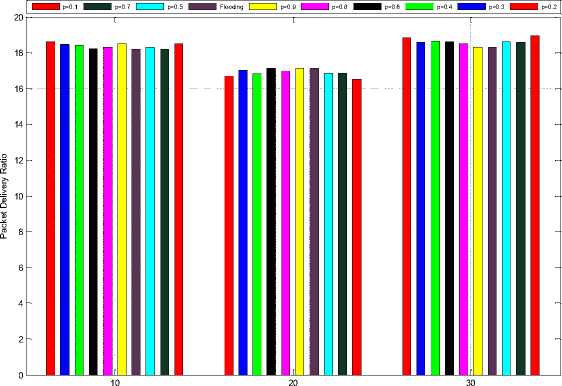
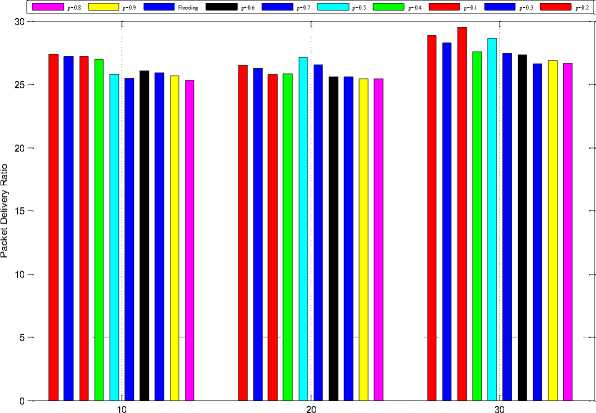
Fig. 8 shows the PDR for sparse traffic condition with 40 nodes for both broadcasting techniques. It is observed that at the speed of 10 m/s, the maximum and minimum values of PDR is 27.3636 and 25.322 where p=0.2 and 0.8, respectively. The maximum value of PDR achieved is 29.5185 at the speed of 30 m/s and p=0.1. Both the protocols perform better at node speed of 30 m/s.
Fig. 9 shows the PDR for sparse traffic density with 50 nodes for both broadcasting techniques. At the speed of 10 m/s, maximum value of PDR40.2979 is achieved when message is broadcast with p=0.4. At the node speed of 20 m/s performance decreases. At node speed of 30 m/s PDR again increases. Here, probabilistic method outperforms flooding at different node speeds. The maximum achieved PDR is 41.0612 at the node speed of 30m/s and p=0.1. Both the protocols perform better at node speed of 30 m/s.
Fig. 10 shows PDR for intermediate traffic density with 100 nodes for both the broadcasting techniques. The performance is good at the node speed 10 m/s. At others node speeds performance of the protocols is varying but maximum PDR is achieved at the node speed 10 m/s and its value is 65.641 when p=0.2. Similarly, the minimum PDR is 49.5905for flooding at the node speed of 30 m/s and broadcasting probability is 0.4.
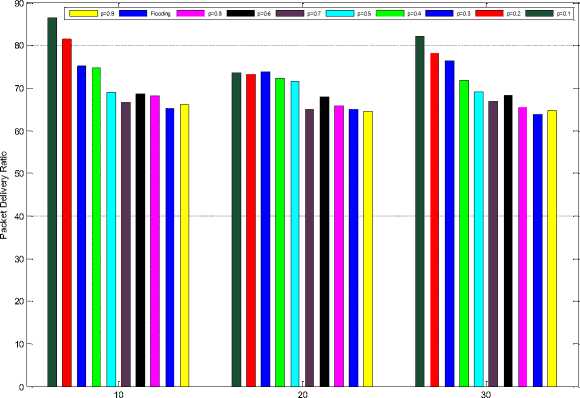
Fig. 11 shows PDR for high traffic density with 150 nodes for both the broadcasting techniques. The performance is good at the node speed of 10 m/s. At other node speeds, performance is varying but maximum PDR is achieved at the node speed of 10 m/s. The PDR is almost constant at the node speed of 20 m/s, 30 m/s achieved. The maximum value of PDR obtained is 86.475 when p=0.1 at the speed of 10 m/s. In flooding method maximum achievable PDR is 49.5905.
-
V. Conclusion
We have analyzed the performance of flooding and probabilistic flooding protocols to deliver messages in a geocast region. We have considered real city map for this evaluation. The performance of these protocols is analyzed with varying node density and speed. From the result analysis, it is clearly evident that when the network is sparsely populated, packet delivery ratio is low as compared to other two scenarios. But in sparse network, both the protocols perform better for high node mobility, but for intermediate and dense traffic scenario they perform better for lower node mobility. In densely populated network the highest value of PDR achieved is 86.475 when nodes are moving at speed of 10 m/s with p= 0.1. Further, we have concluded that probabilistic broadcast protocol performs better than flooding for intermediate and dense traffic scenario. It is also observed that for better delivery ratio, message broadcasting should be done with minimum value of p. The overall study indicates that for intermediate and dense traffic, the performance of both the methods is better for low node mobility.
Speed
Fig.5. Packet Delivery Ratio for 10 nodes
Speed
Fig.6. Packet Delivery Ratio for 20 nodes
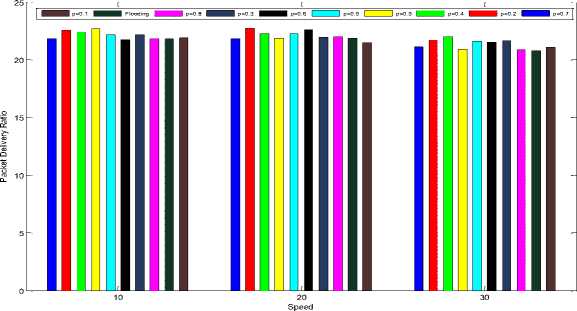
Fig.7. Packet Delivery Ratio for node 30
Speed
Fig.8. Packet Delivery Ratio for 40 nodes

Speed
Fig.9. Packet Delivery Ratio for 50 nodes
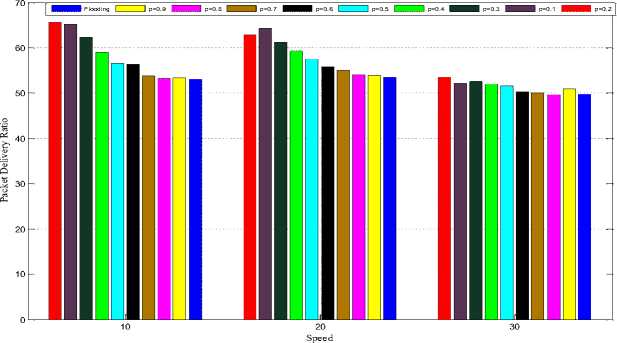
Fig.10. Packet Delivery Ratio for node 100
Speed
Fig.11. Packet Delivery Ratio for node 150
Table 4. Value of Packet Delivery Ratio for Flooding and Probabilistic Method.
|
Probability |
Speed (in m/s) |
No of node |
||||||
|
10 |
20 |
30 |
40 |
50 |
100 |
150 |
||
|
0.1 |
10 |
13.4231 |
18.4815 |
21.9032 |
27.2121 |
40 |
65.2353 |
86.475 |
|
20 |
13.9615 |
16.5385 |
21.4643 |
25.7931 |
36.7037 |
64.325 |
73.5537 |
|
|
30 |
12.5555 |
18.9655 |
21.0741 |
29.5185 |
42.6429 |
52.1333 |
82.1591 |
|
|
0.2 |
10 |
13.4815 |
18.6207 |
22.5746 |
27.3636 |
40.2 |
65.641 |
81.5741 |
|
20 |
14 |
16.6671 |
22.7613 |
26.4706 |
37.7027 |
62.9535 |
73.332 |
|
|
30 |
12.5862 |
18.8571 |
21.7097 |
28.8649 |
42.2 |
53.5283 |
78.1591 |
|
|
0.3 |
10 |
13.5185 |
18.4643 |
22.1765 |
27.1892 |
40.2439 |
62.28 |
75.2609 |
|
20 |
14 |
17 |
21.9697 |
26.25 |
37.5143 |
61.2807 |
73.7105 |
|
|
30 |
12.5766 |
18.5806 |
21.6486 |
28.22857 |
41.878 |
52.5094 |
76.3226 |
|
|
0.4 |
10 |
13.4839 |
18.4167 |
26.9524 |
26.9524 |
40.2979 |
59.0923 |
74.7209 |
|
20 |
14.0333 |
16.8333 |
25.8 |
25.8 |
37.2182 |
59.26197 |
72.23 |
|
|
30 |
12.5517 |
18.6364 |
27.55652 |
27.55652 |
41.0612 |
51.9437 |
71.7284 |
|
|
0.5 |
10 |
13.5714 |
18.3056 |
22.1429 |
25.75 |
39.1698 |
56.5316 |
69.0283 |
|
20 |
14.03333 |
16.8611 |
22.2444 |
27.14558 |
36.8125 |
57.5362 |
71.5684 |
|
|
30 |
12.5517 |
18.6286 |
21.6216 |
28.5814 |
40.2308 |
51.6216 |
69.1068 |
|
|
0.6 |
10 |
13.7647 |
18.2452 |
21.7805 |
26.0833 |
39.3966 |
56.4368 |
68.6727 |
|
20 |
14 |
17.1351 |
22.625 |
25.6111 |
36.9434 |
55.8488 |
68 |
|
|
30 |
12.65552 |
18.6286 |
21.5345 |
27.3148 |
39.9286 |
50.3023 |
68.319 |
|
|
0.7 |
10 |
13.6452 |
18.186 |
21.8 |
25.4717 |
39.0923 |
53.7732 |
66.5971 |
|
20 |
14.0345 |
16.8684 |
21.8 |
26.5517 |
37.1852 |
54.9796 |
64.9565 |
|
|
30 |
12.5806 |
18.575 |
21.1136 |
27.4545 |
40.2698 |
50.0588 |
66.8455 |
|
|
0.8 |
10 |
13.6857 |
18.3145 |
21.8085 |
25.322 |
38.8636 |
53.2 |
68.156 |
|
20 |
14 |
16.975 |
22.0196 |
25.4167 |
36.6308 |
54.0183 |
65.8444 |
|
|
30 |
12.7941 |
18.5116 |
20.9038 |
26.6833 |
39.8971 |
49.5905 |
65.589 |
|
|
0.9 |
10 |
13.6876 |
18.4815 |
22.7 |
25.6721 |
39.1667 |
53.39 |
66.205 |
|
20 |
13.9708 |
17.1136 |
21.8491 |
25.4032 |
36.9583 |
53.918 |
64.5617 |
|
|
30 |
12.7879 |
18.3111 |
20.9455 |
26.918 |
39.4091 |
50.8534 |
64.6626 |
|
|
Flooding |
10 |
13.75 |
18.1957 |
21.8364 |
25.2879 |
39.1053 |
53.11 |
65.1818 |
|
20 |
14 |
17.1136 |
21.8929 |
25.5909 |
36.4474 |
53.5635 |
64.9773 |
|
|
30 |
12.79431 |
18.3211 |
20.77321 |
26.6061 |
38.4459 |
49.8175 |
63.9043 |
|
References Evaluation of Message Dissemination Techniques in Vehicular Ad Hoc Networks using Node Movement in Real Map
- Moustafa H., Mohammed S. S., and Jerbi M., "Vehicular networks: techniques, standards, and applications", Editor Moustafa H. and Zhang Y., pp.1-28, CRC Press, Taylor & Francis Group, Boca Raton London, New York, 2009.
- Krishnan H. and Bai F., "Vehicular networking automotive applications and beyond", Editor Emmmemann M., Bochow B., Kellum C., pp.2-25., A John Wiley and Sons, Ltd, Publication, United Kingdom, 2010.
- Ko Y. B., and Vaidya N., "Geocasting in mobile Ad-hoc Networks: location-based multicast algorithms", In 2nd IEEE Workshop on Mobile Computing Systems and Applications, New Orleans, Louisiana, pp. 101-110,1999.
- Ko Y. B., and Vaidya N., "GeoTORA: A protocol for geocasting in Mobile Ad Hoc Networks", In IEEE International Conference on Network Protocols, Osaka, Japan, pp.240-250, 2000.
- Ko Y. B., and Vaidya N., "Flooding-based geocasting protocols for Mobile Ad Hoc Networks", Journal of Mobile Networks and Applications, Vol. 7, No. 6, pp. 471-480, 2002.
- Zheng J., and Jamalipour A., "WIRELESS SENSOR NETWORKS A Networking Perspective", pp-166, John Wiley & Sons, Inc., Hoboken, New Jersey, 2009.
- Lochert C., et al "A Routing strategy for vehicular Ad Hoc Networks in city environments", Proceedings of IEEE Intelligent Vehicles Symposium, pp.156–161, 2003.
- Chang D. et al "A probabilistic and opportunistic flooding algorithm in wireless sensor networks", Computer Communications, Volume 35, Issue 4, pp.500–506, 15 February 2012.
- Ahvar E., and Fathy M., "Performance evaluation of routing protocols for high density ad hoc networks based on energy consumption by GlomoSim simulator" in the Proceedings Of World Academy Of Science, Engineering And Technology, Volume 23, pp. 97-100, August 2007.
- Ibrahim K., C. Weigle M., and Abuelela M., "p-IVG: Probabilistic Inter-Vehicle Geocast for Dense Vehicular Networks," in the proceeding of the IEEE Vehicular Technology Conference, VTC Spring 2009, Barcelona, Spain, pp.1-5, 26-29 April 2009.
- Das S., and Lobiyal D.K., "A Performance analysis of LAR protocol for Vehicular Ad Hoc Networks in city scenarios", Proc. of International Conference on Advances in Computer Engineering, pp.162-166, August, 2011.
- N. Sze-Yao et al, "The broadcast storm problem in a Mobile Ad Hoc Network", in Proceedings of ACM MOBICOM ' 99 , Seattle, WA , pp. 151–162, August. 1999.
- Wisitpongphan N., et al, "Broadcast storm mitigation techniques in vehicular ad hoc networks", IEEE Wireless Communications. Vol. 14, pp. 84-94, 2007.
- S. Y., Cavin D., and Schiper A., "Probabilistic broadcast for flooding in wireless mobile ad hoc networks", In the Proceedings IEEE Wireless Communications & Networking Conference (WCNC 2003), pp.1124-1130, March 2003.
- S. Y., Cavin D., and Schiper A., "Probabilistic broadcast for flooding in wireless mobile ad hoc networks", EPFL Technical Report IC/2002/54, Swiss Federal Institute of Technology(EPFL), 2002.
- Harri J., and Fiore M., "VanetMobiSim- vehicular ad hoc network mobility extension to the CanuMobiSim framework", manual, Institute Eurecom/Politecnico di Torino, Italy, 2006.
- Fiore M.,et al, "Vehicular mobility simulation for VANETs", 40th IEEE/SCS Annual Simulation Symposium (ANSS- 40 2007), Norfolk, VA, pp.301-309, 2007.
- Härri J., Fiore M., and Filali F., "Vehicular Mobility Simulation with VanetMobiSim", Simulation, Vol.87, Issue.4, pp.275-300, 2011.
- VanetMobiSim URL: http://vanet.eurecom.fr/
- The Math Works: http://www.mathworks.com
- The Math Works: http://www.mathworks.com
- Valery Naumov, Rainer Baumann and Thomas Gross, "An Evaluation of InterVehicle Ad Hoc Networks Based on Realistic Vehicular Traces", MobiHoc'06, Florence, Italy, pp.108-119, May 22–25, 2006.
- Sanjoy Das and D. K. Lobiyal, "An Analytical Analysis of Neighbour and Isolated Node for Geocast routing in VANET ", International journal on Ad Hoc networking Systems ( IJANS), Vol. 1, No. 2, October 2011, pp. 39-50.
- Sanjoy Das and D .K. Lobiyal, "Performance Analysis of Broadcasting Methods in Geocast Region for Vehicular Ad Hoc Networks", International Journal of Scientific and Engineering Research, Paris, France, Vol.3, Issue 4, April 2012, pp.1-6.
- Sanjoy Das and D .K. Lobiyal "Effect of realistic vehicular traces on the performance of broadcasting techniques in Vehicular Ad Hoc Networks", Research Journal of Applied Sciences, Engineering and Technology, Max well Scientific Organization, U.K, Vol.4, No.18, Sept, 2012, pp.3493-3500.
