Evaluation of morphological, physiological, biochemical responses under drought stress at vegetative stage of rice (Oryza sativa) cultivars
 cultivars")
Author: Sheikh Benazir, Rozina Yendrembam, Kananbala Sarangthem, Biseshwori Thongam
Journal: Журнал стресс-физиологии и биохимии @jspb
Article in issue: 4 т.21, 2025.
Free access
To evaluate drought stress's morphological, physiological, biochemical responses on the vegetative stage of rice cultivars, a pot experiment was carried out using a complete randomized design (CRD) with three replications during the rice growing season of three experimental years (2021 to 2023). Five rice cultivars, namely Chakhao poireiton, Chakhao angangba, Chakhao angouba, and Heitup phou, collected from Wangbal rice research Centre, Thoubal, Manipur, and drought drought-tolerant check variety, namely Sahbhagi Dhan, for comparison of tolerance to drought stress was used as a positive control, collected from International Rice Research Institute (IRRI), Odisha. The five rice cultivars were subjected to four different levels (0, 10, 15, and 20 days) of drought stress treatments. Our studies revealed that under drought stress treatment, out of the five rice cultivars, R002 and R003 cultivars were found to be significantly reduced in plant height, tiller number per hill, chlorophyll accumulation, and RWC %, whereas R001 and R004 were least affected as compared to the tolerant check cultivars(R005). Drought stress induced significant accumulation of osmolytes and antioxidant activity, while out of the five rice cultivars, maximum accumulation was observed in R001 and R004 compared to R005 cultivars. The overall conclusion from this study, in comparison to the drought-tolerant cultivar, R004 and R001cultivars possessed maximum degree of drought tolerance and showed more triggered activity antioxidant enzyme, proline content, total soluble sugar, total phenolic content, total soluble protein content, and free amino acid content, while cultivars R002 and R003 found to be more sensitive to drought stress.
Antioxidants, Drought stress, Osmolytes, Photosynthetic pigments, Rice, Oryza sativa
Short address: https://sciup.org/143185137
IDR: 143185137
Text of the scientific article Evaluation of morphological, physiological, biochemical responses under drought stress at vegetative stage of rice (Oryza sativa) cultivars
Rice is the staple food in Asian countries; however, its production is greatly threatened by changing climate conditions (Waheed et al. , 2023). Belonging to the Poaceae family, the Oryza genus has 24 species, of which 22 are wild and 2 ( O. glaberrima and O. sativa ) are cultivated (Gouda et al. , 2020). The pigmented rice of Manipur is commonly known as Chakhao, whereas Chak means rice and hao means delicious. Chakhao poireiton (purple), Chakhao angangba (Red), Chakhao angouba (white), and Heitup phao (white) are the aromatic rice varieties grown in Manipur. Pigmented rice is the primary source of numerous bioactive compounds that have anti-diabetic, anti-inflammatory properties and suppress new blood vessel formation, which induces tumor growth (Mahanta et al. ,20 6). The northeastern side of India is one of the hotspots for agro-biodiversity in the world, with more than 0,000 distinct indigenous rice cultivars, including non-aromatic and aromatic rice (Wei & Huang, 20 9). Uncertain climate patterns have affected the normal agricultural productivity and hindered food security (FAO, 2020). Developing rice cultivars that can adapt to climate variations and sustain greater yield production is the need of the hour (Hassan et al. , 2023). Drought stress during the vegetative stage reduces rice growth by 70%, resulting in a global decrease in production by 2 -50.6% (Zhang et al. ,20 8). According to (Pandey et al. ,20 5), drought is the most detrimental among all abiotic factors, limiting over 50% of rice production. Superior physiological and growth responses under vegetative stage drought stress may be associated with improved yield under reproductive stage drought stress (Pantuwan et al. ,2002) and can be employed as an early indicator for selecting drought-tolerant genotypes.
The rise in incidence of vegetative stage drought stress due to climate change has demanded the development of rice cultivars that are both tolerant to vegetative and reproductive stage drought stress, along with having high yield potential under control conditions. However, very few studies are available for the vegetative stage under drought stress screening. Screening and selection of cultivars that possess high yield potential as well as tolerance to drought at both vegetative and reproductive stages may help breeders in selecting lines with better genetic background. In the present study, a cultivar previously reported to be drought-tolerant, along with some local cultivars with unknown drought sensitivity, were evaluated for tolerance of vegetative-stage drought stress. In this study, traditional aromatic rice cultivars of Manipur were evaluated under drought stress at the vegetative growth stage of rice.
MATERIALS AND METHODS
Study site
The experiment was conducted at the Department of Life Science, Manipur University, Canchipur, Imphal (23°83'N and 25°68'N 93°03'E and 94°78'E), located in the Northeast region of India. Seeds of four local rice cultivars, namely Chakhao poireton, Chakhao angangba, Chakhao angouba, and Heitup phou , code as R00 , R002, R003, and R004, respectively, were acquired from the Wangbal rice research centre, Thoubal, Manipur, while Sahbhagi dhan, code as R005, a known drought-tolerant variety collected from the International Rice Research Institute (IRRI), Odisha, was used as a positive control for the study.
Experimental design
A pot experiment was carried out in a 0L polyvinyl chloride (PVC) pot during the rice growing season of three experimental years (202 to 2023). The pots were filled with 7.5 kg of soil collected from the cultivated field of Manipur. The experiment was laid out in a completely randomized design (CRD) with three replications and four levels of treatments (0-, 0-, 5-, and 20-day drought duration). The 5-day-old rice samplings were transplanted into different pots; two hills per pot of each cultivar were transplanted. At 35 days after transplantation, the rice plants were induced to drought stress treatment for a period of 0(D), 5(D), and 20(D), while for comparison, control (0D) plants were well watered regularly. Using a Gold Dust-3-way meter, the soil moisture level was measured regularly.
Evaluation of Morphological Parameters
All the morphological parameters were measured; plant height (PH) was measured from the base of each hill until the tip of the rice leaf. The tiller number (TN) per hill was recorded for each treatment.
Evaluation of Physiological, BiochemicalParameters
All the physiological and biochemical parameters were evaluated by randomly sampling the fully expanded youngest leaves of each cultivar after the treatment was completed.
Relative Water Content (RWC%)
The RWC was estimated according to the method of (Khan et al. , 20 7).
Freshweight - Dry weight
RWC (%) = × 00
Turgid weight - Dry weight
Estimation of Chlorophyll content
Chlorophyll content was estimated according to the method of (Arnon, 949). Final content of total chlorophyll, chlorophyll a (Chl a ), and chlorophyll b (Chl b ) was calculated by using the following formula:
Total chlorophyll (mgg- ) = [(20.2×A645+8.02×A663) V/W]
Chlorophyll ‘a’ (mgg- ) = [( 2.7×A663-2.69×A645) V/W]
Chlorophyll ‘b’ (mgg- ) = [(22.9×A645-4.68×A663) V/W]
Where,
A- Absorbance at specific wavelengths,
V- Final volume of chlorophyll extract with 80% acetone
W- Fresh weight of the tissue extracted
The chlorophyll stability index was measured by following the method of Sairam et al., ( 997) and calculated as follows:
Totalchloroph yllcontent ( heat )
CSI= X 00
Total chlorophyll content ( con trol )
Proline content
Proline content was estimated by following the methods of (Bates et al. , 973) with some modifications. The proline content was expressed as µmole g- FW using proline as a standard.
Total soluble sugar content (TSS)
The TSS was estimated according to the Anthrone method. The absorbance of the blue-green developed in the solution was read at a wavelength 630nm using a spectrophotometer against the blank. The total soluble sugar was expressed as µgg- FW using D-glucose as standard.
Total phenolic content (TPC)
The total phenolic content was estimated by Folin-Ciocalteu according to (Donald et al. , 200 ). The absorbance was recorded at a wavelength of 765nm. Using Gallic acid as a standard to calculate the total phenolic content and expressed as µgg- FW
Free amino acid content (FAA)
According to the method of Yemm ( 995), the FAA content was estimated. The absorbance was read at 570nm. The total free amino acid content was calculated using amino acid glycine as a standard and expressed in µgg- FW.
Total soluble protein content
The total protein content was estimated by Lowry’s method (Lowry et al. , 95 ) using Folin-Ciocalteau reagent. Absorbance was read at 660nm. Using Bovin serum albumin as standard the total soluble protein was calculated and expressed as µgg- FW.
Determination of antioxidant activity
To determine the activity of antioxidant enzymes (POD, SOD, and CAT), fresh leaf tissues of control and drought stress-treated rice samples were used. The extraction process was carried out by using 500 mg of fresh leaf sample, which was homogenized with cold 5ml of 50mM potassium phosphate buffer (pH 7.8) under ice-cold conditions. Then the homogenate was centrifuged at 0000 ×g at 4°C for 30 minutes. The supernatant was used as a crude extract for measuring the enzyme activity assayed.
SOD activity was assayed by following the method of Tang et al. (20 0), on the basis of the enzyme's ability to inhibit the photochemical reduction of nitro blue tetrazolium (NBT). In 0. ml of enzyme extract, .8ml of 50mM phosphate buffer (pH 7.8), 0. ml of 3mM methionine, 0.3 ml 750 µM nitro-blue tetrazolium (NBT), 0. ml 0. M medta, and 0.05ml of riboflavin were added. The reaction was initiated by adding 0.05ml riboflavin to the mixture, and then the tube was placed under a fluorescent lamp for 5min. The reaction mixture without the enzyme extract was used as a control, giving the total inhibition, calculated per microgram protein. Absorbance was measured at wavelength 560 nm, and one unit of SOD activity is the amount of enzyme required to inhibit 50 % inhibition reduction of NBT. The activity of SOD was expressed as U mg - protein FW.
POD activity was assayed by the method of Upadhyaya et al. ( 985). 0. mL enzyme extract was mixed with ml phosphate buffer (0.05M; pH 5.5), ml of freshly prepared 50mM Guaiacol, and ml of 0. M hydrogen peroxide. POD activity was recorded by measuring the increase in absorbance at wavelength 420nm. One unit of POD was defined as the change in absorbance of 0.0 per minute at 37°C.
CAT activity was determined by adding 0.2ml enzyme extract to an assay mixture containing 2ml of 50mM phosphate buffer (pH 7.5) and ml of hydrogen peroxide, then the change in absorbance was measured at a wavelength of 240nm per min.
DPPH Radical Scavenging Activity of the rice methanolic extract was determined by following the method of Blois ( 958). The absorbance was measured at 5 7 nm of each 96 well in Biotek Epoch 2 microplate reader. This activity is given as percent DPPH scavenging and is calculated as:
% DPPH scavenging =
Control absorbance - Extract absorbance
X 00
Control absorbance
Statistical Analysis
The morphological, physiological, and biochemical data of the study were analyzed using the Analysis of variance method using SPSS v20.0. DMRT (the Duncan's Multiple Range Test)-LSD test at p≤0.05 was performed to separate significantly different means of the rice cultivars for a given trait.
RESULTS
All tables and graphs indicate mean value of data collected during the three experimental years (202 to 2023).
Effect of drought stress on morphological parameters
The plant height of five rice cultivars was significantly (p≤0.05) reduced under drought stress treatment. Compared to the control condition, the highest reduction rate in plant height was observed in cultivars R002 (32.73%) followed by R003 (28.98%) while the lowest reduction rate was found in R005 ( 3.97%) followed by R004 ( 4.75%). At 20D of drought stress treatment, the highest plant height was observed in cultivar R004, followed by R005 and R00 , and the lowest was noted in cultivars R003 and R002 as shown in Table .
As compared to the control condition, the tiller number was not significantly (p≤0.05) reduced under drought stress treatment except R002 and R003 cultivars (Table ); however, the exact decrease or increase in tiller number varied among the cultivars. At 20D of drought stress treatment, the maximum tiller number was observed in cultivar R00 (7.96) followed by R005 (6.76) and minimum was observed in cultivar R003 (3.3 ).
Effect of drought stress on physiological parametersRelative water content (RWC) %
Drought stress caused a significant (p≤0.05) decrease in leaf RWC (%) of the rice cultivars, and the maximum reduction in RWC among the cultivars was observed at the severe drought stress treatment (20D) condition. At 20D of drought stress treatment condition, the highest reduction was observed in R002 (65. 9%), followed by R003 (48.25%), whereas the lowest reduction was found in cultivar R005(23.64%), followed by R004 (24.55%) and R00 (25.45%). These results indicate that, drought stress during vegetative stage, cultivars R004 and R005 were found to show lesser reduction in RWC than the other cultivars (R00 , R002, and R003) as shown in Table 2.
Chlorophyll content
Under water deficit conditions, chlorophyll content was negatively affected in the leaves of rice cultivars. However, in the control condition, the chlorophyll content was not significantly different among the five rice cultivars. Under the 20D of drought stress treatment, R004 maintained the maximum value of TCC, followed by R005 cultivar, and the minimum value of TCC was observed in R002 cultivar. The highest rate of TCC reduction was observed in R002 (64.74%) cultivars. Compared to the R005 (22.89%), less reduction was shown in cultivars R00 (27.03%) and R004 (27.53%). Similarly, the maximum Chl a and Chl b content were shown under the control condition. At 20D of drought stress treatment, the maximum Chl a and Chl b were observed in cultivar R005 and R004, respectively, whereas the minimum Chl a and Chl b content was observed in cultivar R002 (Table 2).
Chlorophyll stability index (CSI)
The response of CSI was found to be significantly (p≤0.05) reduced under drought stress as compared to the control condition, as shown in Table 2. Cultivar R004 showed the highest value of CSI, followed by R002 and R00 , while the lowest value was observed in R004 cultivar under control conditions. During 20D of drought stress treatment, the highest CSI was observed in cultivars R005 (74.85%), followed by R004 (69. 2%) and R00 (69.04%), while the lowest CSI was observed in cultivar R002 (48. 8%), followed by R003 (58.30%).
Effect of drought stress on biochemical parameters
Osmolyte content
Osmotic adjustment is a vital process which allows rice plants to effectively mitigate drought stress and enhance resilience. In the present study the content of important osmolytes such as proline, FAA, TSS, TSP and TPC were estimated in leaves of all rice cultivars under different treatment conditions. It was observed that under drought stress, the proline accumulation and FAA content were found to be significantly increased with the increase in the number of days of drought stress treatments. The maximum proline (Fig. A) and FAA (Fig. B) accumulation was shown at 20D of drought stress treatment in R005, followed by R004 and R00 cultivars, and the minimum was found in R002 and R003 cultivars. The TSS content significantly (p<0.05) increased in cultivars R00 , R004, and R005; however, cultivars R002 and R003declined significantly (p<0.05) from 5D to 20D of drought stress treatment as shown in (Fig. C). Similarly, variations in TSP content were observed across different five rice cultivars the highest protein content was observed at 20D stress treatment in R005 cultivars, followed by R004, and the minimum in R002 cultivars (Fig. D). The maximum TPC was observed at 20D of drought stress treatment in R005, followed by R004 and R00 cultivars, and minimum in R002 cultivars (Fig. E).
Antioxidant’s activity
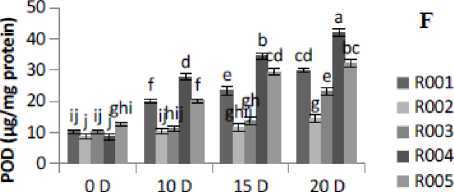
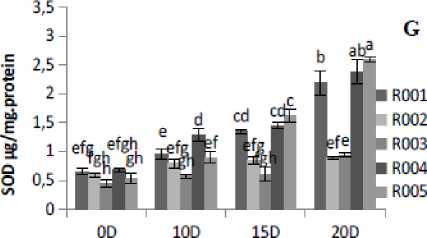
The antioxidant enzyme activities in rice plants showed a significant variation under different drought stress treatment levels. POD activity was found to be significantly (p≤0.05) increased with the increase in the number of days of drought stress treatment. POD activity was observed to be lowered under control conditions. R00 , R004, and R005 cultivars showed higher POD activities at 20D of drought stress treatment. At 20D drought stress treatment, the maximum POD activity occurred in R004, followed by R005 and R00 cultivars, and minimum activity was observed in R002 cultivar (Fig. 2F). This study showed that the drought stress treatment in rice plants increased POD activity. The SOD activity under 20D of drought stress treatment was found to be significantly (p≤0.05) increased in all cultivars as compared to the control (0D) condition (Fig. 2G). Similarly, drought stress increased CAT activity significantly (p≤0.05) in all the five rice cultivars from control (0D) to severe (20D) drought stress treatment condition (Fig. 2H). In this study, the DPPH scavenging activity was measured based on the percentage of inhibition in both control and drought stress condition. The percentage of DPPH radical scavenging activity was gradually increased as the drought severity increased. The highest fold increase was found in cultivar R00 (2.49-fold) and lowest in R002 ( .53-fold)
Pearson’s correlations
The correlations among the morpho-physiological and biochemical parameters under control and drought stress condition were analyzed by Pearson’s correlation coeffiient. It was observed that PH has significant positive correlation with TCC (r=0.645, p≤0.0 ) RWC (r=0.684, p≤0.0 ), CSI (r=0.876, p≤0.0 ) and TN (r=0.6 7, p≤0.0 ) whereas negative correlation was observed with biochemical parameters such as proline, TSS, FAA, POD and DPPH which is present in the Table 4.28TSP has significant positive TSS (r=0.948, p≤0.0 ), DPPH (r=0.876, p≤0.0 ) TPC (r=0.752, p≤0.0 ), FAA (r=0.944, p≤0.0 ), CAT (r=0.784, p≤0.0 ), POD (r=0.952, p≤0.0 ), SOD (r=0.825, p≤0.0 ). POD also exhibited significantly positive correlation with CAT (r=0.754, p≤0.0 ), TSS (r=0.93 , p≤0.0 ), FAA (r=0.934, p≤0.0 ) and SOD (r=0.826, p≤0.0 ).
Table 1 Morphological parameters studied under drought stress treatment in five rice ( Oryza sativa L.) cultivars
|
Parameters |
DST |
R001 |
R002 |
R003 |
R004 |
R005 |
|
0D |
8 .00c |
86.52a |
65.7 g |
87.63a |
85.6ab |
|
|
PH (cm) |
0D |
75. 5d |
72.33de |
55.33i |
85.40ab |
82.33bc |
|
5D |
7 .33ef |
65.73g |
50.63j |
84.67ab |
80.67c |
|
|
20D |
68.33fg |
58.27hi |
46.67k |
80.7c |
79.04c |
|
|
0D |
6.92abc |
8.02a |
5.93abcde |
6.09abcde |
5.74abcde |
|
|
TN (no.) |
0D |
7. 4abc |
6.87abc |
4.20def |
6.86abc |
5.95abcde |
|
5D |
7.39ab |
5.03cdef |
4.08ef |
5.9 abcde |
6.39abcd |
|
|
20D |
7.96a |
4. 6def |
3.3 f |
5.49bcde |
6.7abc |
Mean value within each column with a different letter is significantly different (p≤0.05) based on the Duncan test. dst: drought stress treatment, ph: plant height, tn hill: tiller number per hill
Table 2 Physiological parameters studied under drought stress treatment in five rice ( Oryza sativa L.) cultivars
|
Parameters |
DST |
R001 |
R002 |
R003 |
R004 |
R005 |
|
0D |
86.92cd |
93.4ab |
95.64a |
90.28bc |
94. 9a |
|
|
RWC (%) |
0D |
80.75e |
75. 6fg |
62.42ij |
83.59de |
86.22d |
|
5D |
74.54fg |
53.78k |
59.2 j |
76.32f |
80.9 e |
|
|
20D |
64.8hi |
32.5 m |
49.49l |
68. 2h |
7 .92g |
|
|
0D |
.48bcde |
.56abcd |
.55abcd |
.78a |
.66ab |
|
|
TCC |
0D |
.32def |
.42bcde |
.09fg |
.62abc |
.46bcde |
|
5D |
.23ef |
0.84gh |
0.92g |
.45bcde |
.35cdef |
|
|
20D |
.08fg |
0.55i |
0.59hi |
.29def |
.28def |
|
|
0D |
0.95bcde |
0.87bcde |
0.92bcde |
.05abc |
.24a |
|
|
Chl a |
0D |
0.84bcdef |
0.82bcdef |
0.68efg |
0.93bcde |
.09ab |
|
5D |
0.80cdefg |
0.54gh |
0.59fgh |
0.88bcde |
.0 abcd |
|
|
20D |
0.7defg |
0.34h |
0.39h |
0.79cdefg |
0.98abcd |
|
|
0D |
0.53bcde |
0.69ab |
0.63abc |
0.73a |
0.42cdef |
|
|
Chl b |
0D |
0.48bcde |
0.6abc |
0.4 cdef |
0.69ab |
0.37defg |
|
5D |
0.43cdef |
0.30efg |
0.33efg |
0.57abcd |
0.34defg |
|
|
20D |
0.34defg |
0.2 fg |
0.22g |
0.50bcde |
0.30efg |
|
|
0D |
90.53ab |
9 .25ab |
92.08a |
87.03bc |
89. 6ab |
|
|
CSI (%) |
0D |
84.49cd |
66.43gh |
75.6ef |
82.5 cd |
84.40cd |
|
5D |
80.85d |
52.9j |
62.5hi |
75.24f |
79.89de |
|
|
20D |
69.04g |
48. 8k |
58.3i |
69. 2g |
74.85f |
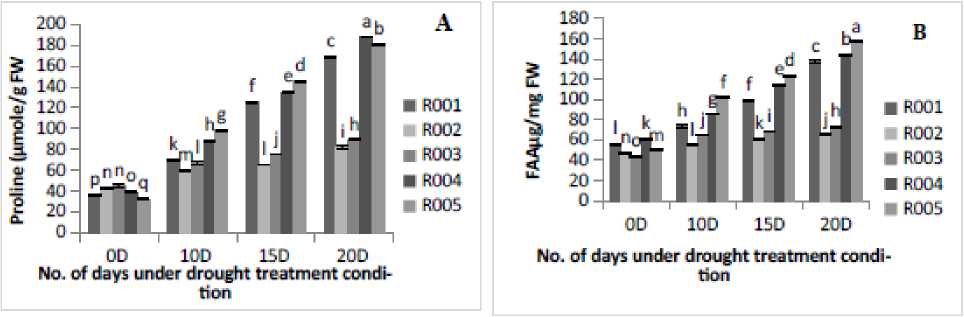
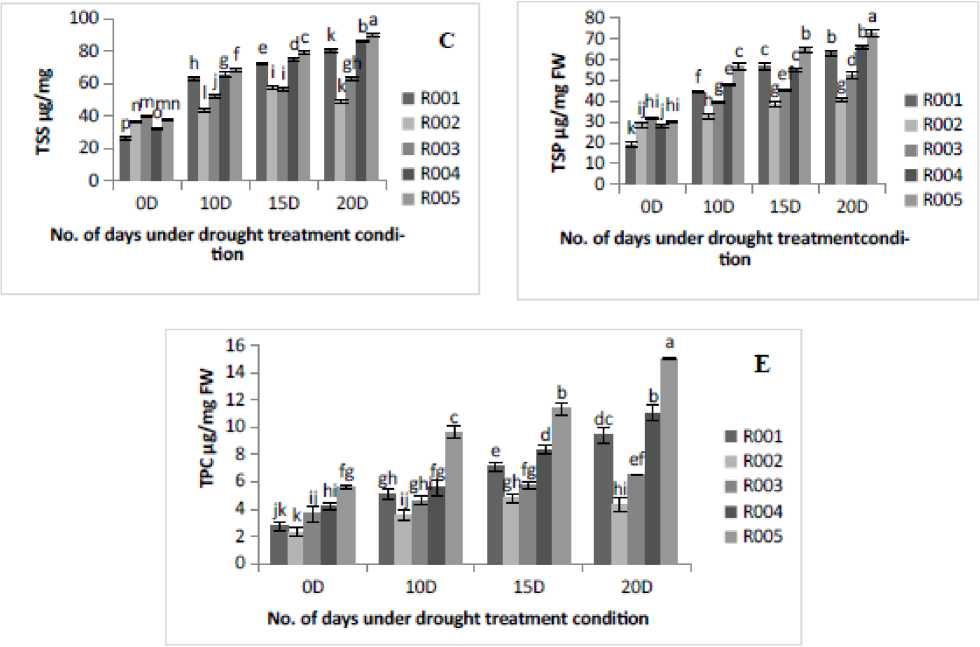
Figure 1. Effect of drought stress treatment on A- Proline content, B- Free amino acid (FAA), C-Total soluble sugar content (TSS), (D) Total soluble protein and E- Total phenolic content (TPC). Vertical bars indicate mean ±SE of three replicates
No. of days under drought treatment condition
No. of days under drought treatment condition
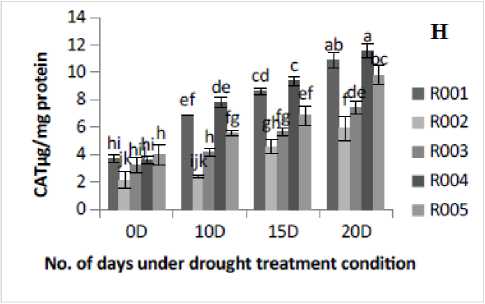
Figure 2. Effect of drought stress treatment on F- Peroxidase (POD), G-Superoxide Dismutase (SOD), H- Catalase (CAT) and I-DPPH. Vertical bars indicate mean ±SE of three replicates.
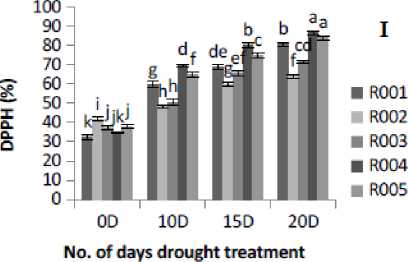
Table 3 Pearson’s Correlation coefficient among morphological, physiological and biochemical parameters of five rice cultivars under drought stress treatment
|
PH |
TN |
TCC |
RWC |
TSP |
Proline |
TPC |
TSS |
FAA |
POD |
SOD |
CAT |
DPPH |
|
|
PH |
|||||||||||||
|
TN |
.6 7** |
||||||||||||
|
TCC |
.645** |
.633** |
|||||||||||
|
RWC |
.684** |
.645** |
.88 ** |
||||||||||
|
TSP |
-.69 ** |
-.5 ** |
-.636** |
-.727** |
|||||||||
|
Proline |
-.563** |
-.5 2** |
-.707** |
-.8 5** |
.922** |
||||||||
|
TPC |
-.2 3 |
-.347* |
-.488** |
-.560** |
.752** |
.847** |
|||||||
|
TSS |
-.6 9** |
-.520** |
-.646** |
-.737** |
.948** |
.928** |
.803** |
||||||
|
FAA |
-.637** |
-.56 ** |
-.695** |
-.785** |
.944** |
.975** |
.836** |
.956** |
|||||
|
POD |
-.73 ** |
-.593** |
-.699** |
-.748** |
.952** |
.889** |
.7 3** |
.93 ** |
.934** |
||||
|
SOD |
-.484** |
-.439** |
-.676** |
-.745** |
.825** |
.930** |
.844** |
.867** |
.9 7** |
.826** |
|||
|
CAT |
-.306* |
-.262 |
-.520** |
-.655** |
.784** |
.85 ** |
.829** |
.840** |
.8 7** |
.754** |
.829** |
||
|
DPPH |
-.560** |
-.427** |
-.680** |
-.802** |
.876** |
.897** |
.754** |
.894** |
.873** |
.850** |
.8 6** |
.893** |
|
|
CSI |
.876** |
.634** |
.787** |
.824** |
-.786** |
-.734** |
-.400** |
-.7 5** |
-.750** |
-.8 8** |
-.642** |
-.503** |
-.752** |
Significant - p<0.05=*, Significant-p<0.0 =**, non-significant=ns . Plant height, 2. Tiller number, 3. Total chlorophyll content, 4. RWC, 5. Protein, 6. Proline, 7. Phenol, 8. TSS, 9. FAA, 0. POD activity, . SOD activity, 2. CAT activity
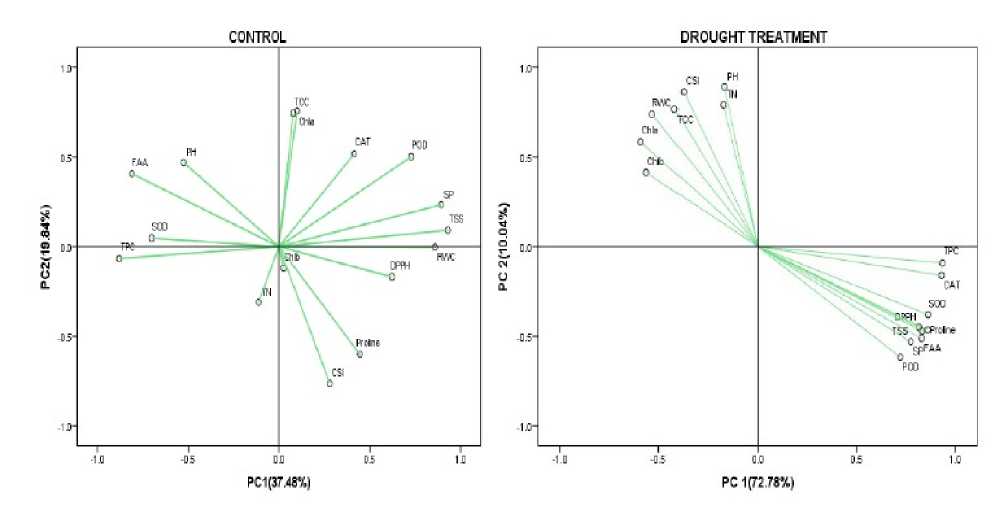
Figure 3. Principal component analysis (PCA) of 2 traits of five rice cultivars under drought stress. The parameters included in PCA analysis were PH, TN, TCC, Chl A, Chl B, RWC, protein, phenol, proline, FAA, POD, SOD and CAT activities.
Principal component analysis
In this study, principal component analysis (PCA) under control and stress condition at vegetative stage was separately performed. The two components, PC explains 37.48% and PC2 explains 9.84% of the total variations. It was observed that TCC, Chl a, CAT, POD, SP, TSS, RWC were loaded together on the upper right side of the biplot, Chl b, DPPH, Proline and CSI loaded together on right lower side of the biplot. PH, FAA, SOD was loaded together on left upper side of the biplot. TPC and TN were loaded on lower left side of the biplot. This suggests that the parameters which were loaded together had positive correlation under control condition at vegetative stage (Fig. 3 Control).
Under drought stress condition (Fig.3, B) at vegetative stage, principal component analysis (PCA) was loaded in two components – PC and PC2. PC explains 72.78% and PC2 explains 0.04%. It was observed that all the biochemical parameters were loaded on right lower side of the biplot whereas morpho-physiological parameters (RWC, TCC, CSI, Chla, PH and TN) loaded together on left upper side of the biplot. Thus, it can be concluded that under drought stress, all morpho-physiological parameters had a positive correlation among them as well as among the biochemical parameters. (Fig.3 Drought treatment).
DISCUSSION
Drought is a widely recognised environmental stress affecting every aspect of plant growth process and productivity. Drought stress causes hindrance in numerous morphological parameters, and the responses triggered by this stress depend on factors such as stress duration, crop stage, and the severity of the stress on the crop. Therefore, it is essential to understand the adaptive mechanisms of drought tolerance. Simply studying morphological or growth parameters such as shoot length, root length, and plant height would not suffice to fully comprehend plants' intricate responses under drought stress. Thus, this study employed morphological, physiological and biochemical assessments of drought stress's impact on rice cultivars. Our study focused on drought stress responses, especially on four aromatic rice cultivars of Manipur, and with one drought-tolerant check variety during the vegetative stage.
These studies showed a reduction in the RWC (%) under drought stress. It is an important trait that indicates the water status of the plant cell, and it was one of the closely connected with the drought resistance (Grzesiak et al. , 20 2). We observed a maximum reduction of RWC (%) in cultivars R002 (65. 9%) and R003 (48.25%), and the least reduction in cultivar R005 (23.64%). RWC (%) reduction under drought stress was observed in a variety of Colocasia esculenta L. (Sanket et al. , 20 2). The levels of chlorophyll in plants were strongly and positively associated with drought tolerance. This is because drought stress led to the degradation of chloroplasts in plants which have sensitive to drought stress (Gu et al. , 20 2). In this study, 20D drought stress leads to a decline in chlorophyll content in five rice cultivars; R002 and R003 were more drought sensitive than the other three cultivars. Cultivars R00 , R004, and R005 were found to be less affected by drought stress. Reduced chlorophyll content under drought stress has been observed in many species, dependent on the severity and duration of drought (Zhang et al. , 2008).
Under water deficit conditions, this study found significant (p<0.05) accumulation of all osmolytes viz: proline, TSS, FAA, TSP and TPC in all five rice cultivars. The highest proline, TSS, and FAA were shown in cultivars R004 and R00 , compared to the drought- tolerant cultivar (R005). However, as the number of days of drought stress treatment increased from 0D to 20D, a sudden decline in TSS was observed in cultivar R002. These findings align with the study by which observed a gradual increase in proline in cotton (Yi et al.,20 6), TSS in rice (Dien et al.,20 9), and FAA in wheat (Abid et al., 20 8) under severe drought stress. As shown in Fig. D, the TSP increased in all the five rice cultivars with the increase in drought duration. The highest increase in TSP was noted in R00 (3.29-fold), followed by R005 (2.42-fold) and R004 (2.39-fold). In contrast, the lowest increase was observed in R002 ( .43-fold), followed by R003 ( .65-fold) under 20D of drought stress treatment over the control condition. This study aligns with the findings of Wang et al. (20 9). It was also evident that as compared to the control condition, drought stress induced a significant (p<0.05) increase in TPC, as shown in Fig. E. Under drought stress, a slight increase in TPC was observed in cultivars R002 and R003.Our observations of elevated TPC under drought stress support previous reports in rice (Kumar et al., 2023). The findings of this study showed that osmolyte accumulation was affected by the intensity of drought and the variation in response among the five rice cultivars. Additionally, a greater ability to accumulate osmolytes was linked to improved drought tolerance in the rice cultivars.
In this study, under control condition all the five rice cultivars showed minimum antioxidant enzyme activity as compared to the drought treatment condition. Under intensified drought conditions, the four rice cultivars and tolerant check variety exhibited increased activities of POD, SOD, CAT and DPPH. The highest antioxidant activity was found in cultivars R00 and R004 as compared to the tolerant variety (R005) under drought stress treatment. Cultivars R002 and R003 found less antioxidant enzyme activity under drought stress condition. In the previous studies have shown that tolerant plant genotypes have relatively higher levels of ROS-scavenging enzymes compared to susceptible ones and it indicates that the antioxidant system is crucial for helping plants endure environmental stress (Lum et al., 20 4). SOD acts as the primary defense against oxidative damage by catalyzing the superoxide anion radical (O2- ) converting into H2O2 and subsequently, CAT and POD break down this H2O2 into H2O and O2 (Hasheminasab et al., 20 2).
CONCLUSIONS
The five rice cultivars in this study observed varietal responses in morphological, physiological and biochemical parameters. As compared to the drought tolerant cultivar R005 (Sahbhagi dhan), R004 and R00 cultivars exhibited higher proline, POD, SOD and CAT activities than the other two cultivars (R002 and R003). So, Heitup phou and Chakhao poireiton were identified the most drought tolerant cultivar. Molecular analysis and comprehensive field experiment should be carried out before recommendation the tolerant cultivar for widespread cultivation to the farmer.
AUTHOR CONTRIBUTION
SB performed the laboratory experiment, analyzed the data, and wrote the manuscript. RY helped with the laboratory work and revised the manuscript. KS guided, revised the manuscript, as well as designed the whole research work.
ACKNOWLEDGMENT:
We gratefully acknowledge the International Rice Research Institute (IRRI), Odisha, India, for providing seed of the drought-tolerant variety. This work was financially supported by UGC –JRF fellowship, Government of India,
CONFLICTS OF INTEREST
All authors declare that they have no conflicts of interest.
