Experience in agent-based modeling of interregional value chains

Author: Lukin Evgenii V., Anosova Tatyana S., Melnikov Aleksei E., Sidorov Maksim A.
Journal: Economic and Social Changes: Facts, Trends, Forecast @volnc-esc-en
Section: Modeling and forecast of socio-economic processes
Article in issue: 6 т.13, 2020.
Free access
Solving the problem of implementing powerful socio-economic breakthrough in Russia requires the formulation and implementation of the latest practices for the development of the corporate sector, civil society, and state institutions. In theory, these practices should be the product of some innovative activity in the management sphere. However, world experience shows that initiatives correlating with the current development paradigm and are its logical continuation can provide no less effective results. In particular, we are talking about the Russian policy of industrial diversification and import substitution. The country is definitely making progress in these areas, but it is too early to talk about confident results. Meanwhile, a reasonable and, most important solution of the issue, which is not contrary to the interests of the elite, has been in the focus of the scientific community for several years, this is the value chains. Handled properly, they can act as a driver for the development of territories, business, and the social sphere. The purpose of the research is the formulation and testing the tools for value chains modeling. In turn, the novelty of the tools lies in the possibility of taking into account the interregional factor of interaction and the availability of functionality for the implementation of variable calculations of the developing phenomena in the economy. The model peculiarity is provided by the synthesis of methods of intersectoral balance and agent-based modeling which, according to other research teams, provides greater accuracy and realism of modeling. In the course of the study, the authors analyze domestic and foreign experience in designing value chains, and present their characteristics in the regional context. The researchers represent a consequence assessment associated with stimulating consumer demand and the expected effect that can be caused by the value chains value chains development.
Value chains, interregional interaction, agent-based modeling, tables
Short address: https://sciup.org/147225498
IDR: 147225498 | UDC: 332.13 | DOI: 10.15838/esc.2020.6.72.6
Text of the scientific article Experience in agent-based modeling of interregional value chains
Russia has incredible opportunities that are uncompromisingly dispersed in the interregional space in favor of the interests of the export-oriented production elite. Dependence on the natural rent is undoubtedly a serious issue for the Russian economy which significantly constrains the prospects of realizing resource potential. However, given the already great attention to this topic (the notorious oil needle, its weaknesses, related threats, and other nuances of the current economic system), we will ignore it now.
Economic development can and should be carried out in completely different directions, with no need for a sharp change in the current paradigm or deliberate containment of individual sectors, thereby ensuring the diversification processes which the Russian authorities have often focused on in the last decade. Naturally, this will require certain innovations in the legislative and managerial spheres; it is necessary to work out and implement new development tools. It is significant that the scientific community has been changing conceptual results in the relevant areas for many years. In particular, we are talking about the value chains development (hereinafter referred to as VC) which can be considered a new driver of socio-economic evolution.
The relevance of these issues is given by the fact that in the recently approved Integrated Strategy for Industrial Development1, one of the priorities of industrial policy is the production diversification with access to adjacent stages of production chains. At the same time, the question whether the regional authorities have enough tools to facilitate the activation and subsequent intensification of operations in this direction remains open.
The problem is also complicated by the fact that developed (in other words, large, multifunctional) VC are rather rare practice in the Russian economy. Basically, there is a small dimension including a couple of production stages which influences on the entire state’s socio-economic system. In particular, these are low GDP growth rates, investment unattractiveness of certain industries, growing territorial disparities, deindustrialization processes, and insufficient demand for basic science.
The lack of culture of organizing full-cycle production and focusing on the production of final high-tech products, rather than the semifinished ones, does not allow leveling country’s dependence on imports with any confidence. At the same time, in recent years, the global economy has clearly identified a trend toward the implementation of protectionism tools of domestic producers including common usage of sanctions rhetoric. In such conditions, the risks associated with access to imported equipment and components significantly increase for the Russian consumer of technological products.
Accordingly, it is hard to argue with the expert community’s opinion about the need to focus on the domestic market evolution and the domestic demand formation. In this regard, the role of value chains is definitely significant: developed VC will allow shifting profit-taking from the stages of raw materials extraction and semi-finished goods production, increase the volume of value-added formation, create prerequisites for growing the state’s income, companies, and population. The emergence of questions related to understanding how it is possible to solve these problems and realizing the magnitude of the existing potential actualizes the need to analyze existing and model promising value chains in the Russian economy.
Theoretical aspects of the research
In the scientific literature, the value chain is understood as a full range of activities that are carried out by enterprises to bring a product or service from the development stage to usage by a final consumer [1]. The VC expansion process characterizes the geographical fragmentation of production in accordance with the principles of comparative advantage. The VC concept (or rather global VC) appeared in the 1970s as an attempt to find an answer to the question of why some countries were developing faster than others. For this purpose, the author analyzes the states’ participation in the global division of labor and evaluates their involvement in the process of creating value along the entire technological chain – from the moment of product design to its implementation to a final consumer [2].
Value chains are characterized by the complexity and versatility of the relationships between the subjects of economic relations among themselves, so the main problems of the VC development managing are to adequately assess the effectiveness of ongoing processes and correctly determine the degree of compliance of the results with the goals set, as well as to present potentially promising and (or) already formed relationships in an accessible form. One of the options that contribute to solving these issues is the using agent-based models in practice (hereinafter referred to as ABM).
Agent-based modeling greatly simplifies the work in terms of representing the subjects’ relationships of economic relations with each other and provides ample opportunities for conducting experiments at various management levels, in order to obtain relevant and most accurate results [3; 4]. This type of modeling involves determining the parameters of active subjects, agents (they can be people, organizations, regions, individual industries, etc.), describes the features of their behavior and, at the same time, does not have the limitations inherent in traditional modeling methods.
The key ABM advantages are their properties: autonomy (agents perform issues independently), heterogeneity (agents have their own characteristics), limited rationality (agents cannot learn something beyond the macro environment of the model), and location in space (the environment of the modeling agents’ placement).
Thus, agent-based modeling allows designing a system that is as close to reality as possible, and to carry out simulations of real phenomena in the economy. Accordingly, such ABM is perfectly suited for designing processes taking place in the interregional space. It is possible to use a large number of interacting agents, as well as to change the parameters and rules of their behavior. In our case, this is a simulation of interregional value chains.
In the scientific community, much attention is paid to ABM as a promising and rather flexible tool for designing socio-economic processes. Researchers, who reflect the nature of interregional interactions, often focus on the spatial aspect. Thus, E.D. Sushko considers an agent-based territorial model where the interaction of households and firms is presented: within the framework of two regions taking into account their localization and possible transport solutions2. He proves that various parameters, such as wages, taxes, housing costs, level of production costs, transportation costs, etc., affect the circulation of economic flows, the way products are distributed, and the choice of the region as a place of residence and work.
The spatial aspect, as a continuously changing phenomenon, is taken into account in the work of V.I. Suslov and his colleagues [5]. Traditional interregional models are unable to reflect the complex dynamic nature of economic processes, so it is proposed to use more functional agent-based models as an alternative. According to the authors’ opinion, the ABM advantage is the ability to study economic processes taking into account the spatial factor represented in this case by transport costs.
Other studies determine the nature of the space resistance influence, as measured by the level of transport costs, on the connectivity of multi-regional economy. For example, on the basis of the tables “input – output”, we reveal the nature of the cost impact on the structure of the region’s products use. With transport costs growth, there is an increase in product consumption within the region which makes regional coefficients higher and interregional coefficients lower. Accordingly, interregional cooperation is reduced. On the contrary, with a decrease in transport costs, there is an increase in mutual supplies [6; 7].
A significant advantage of the agent-based multi-regional intersectoral model is the usage of statistical elements (data from tables of “input – output”) and geoinformation approaches [8]. From practical point of view, this means that the behavior of agents and their relationships can be described with a greater degree of realism, taking into account a greater number of small nuances. Thus, it is possible to obtain more accurate modeling results.
Appealing to the foreign experience of using ABM, we note in principle a higher penetration level of models of this type in socio-economic research. The issues are very diverse, and they are considered on different scales. At the same time, in most cases, common ideas are optimization of logistics and other flows, improving the efficiency of current processes and visualizing the possible consequences of decisions made.
For example, one of the models is based on learning agents and reflects the value chain in oil industry [9]. The model is described in the ABM paradigm and consists of interactive and adaptive agents (that accommodate changes and independently determine their behavior). A distinctive feature of the ABM representation is that modeling allows showing the environment in the most reliable way by including elements that more or less correspond to real systems. The practical side of the model is related to assistance in determining the storage location and various aspects of transportation. This is especially true, as the oil production process is continuous and extremely inelastic in relation to demand in nearly all cases.
The approach to modeling agri-food supply chains in the paper [10] is interesting from the scientific and practical point of view. Chains are essentially a complex dynamic environment in it consisting of stakeholders and their relationships, as well as products, cash, and information flows. Intelligent agents can help stakeholders in the supply chain to minimize costs, increase flexibility, and avoid individual points of failure when working around the clock. The main goal of flow chain design is to create added value at each node of the network. The modeling role3 is in the creation of decentralized networks, communication mechanisms, and coordination methods.
Another promising direction of using ABM, which has become widespread in the works of foreign economists, is the design of joint value creation schemes in various spheres of economic activity. For example, these may be agricultural chains [11]. There, the value creation depends, among other things, on seasonality and such a factor as the perishable type of product. The consumer and the firm are invited to work together, as the key condition for creating value is the existence of two-way direct interaction. The most important component of the process of this type of modeling is the planning stage which determines the main parameters: the level of demand and prices, the variety and number of seeds, the periods of cultivation and harvesting, etc. So, if information about the demand is not available and the price is not set, the modeling process cannot be moved to the next stage.
At the same time, despite the growing research interest in the VC problems, there is still a wide scope for its development. In particular, it is promising to study issues related to modeling the “lengthening” of value chains and stimulating domestic demand in the Russian economy, as well as to assess the regional effects of these processes. We are trying to start moving in this direction.
Research methodology
The methodological tools of our research are based on the author’s agent-based model of interregional VC. The model includes four types of agents: firms, households, state and foreign market.
Based on the VC research task, in the model, the firms are divided into six enlarged industries by type and stage of output: mining, intermediate and final processing, construction, transport and service production. Extractive firms4 produce primary resources of the economy (various types of minerals, agricultural and forestry products) which are sent to intermediate processing firms5. In turn, they carry out the initial processing of raw materials and supply a wide range of semi-finished products to the final processing firms6 which later create goods for the final consumption. In the model, construction firms7 and firms specializing in producing services8 consume intermediate goods and supply economic agents with their products. The transportation firms9 carry out goods portage between all types of firms.
On the one hand, households provide firms with labor power, receive wages and social transfers from the state, and make decisions about their income distribution; on the other hand, they form domestic demand acting as consumers of various goods and services and paying taxes to the state.
The state has the functions of collecting taxes and redistributing them (transfers to households), as well as regulating foreign trade.
In relation to agents in the model, the external market is the markets of other regions of Russia and foreign countries. Firms can send their products either to the territory of the three regions used in the model, or to the external market (i.e., to other Russian regions and for export). Similarly, the supply of goods and services for the needs of firms and households can come from the regions represented in the model, other Russian regions and foreign countries.
The structure of agent relationships in the model is in the scheme in figure 1 (it does not include a number of relationships at this stage of the research for simplicity). We should note that an important feature of the model is taking into account the location of agents in space (all agents have geographical coordinates) which allows characterizing the transport costs for the goods portage.
Figure 1.Basic agents and relationships in the agent-based models
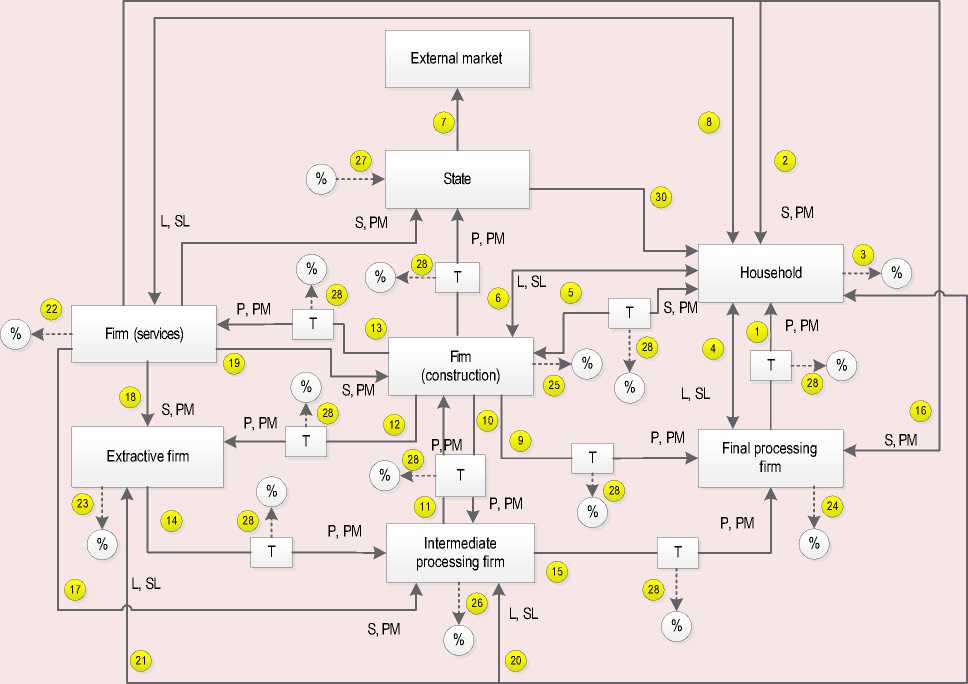
P Production
S Services
PM Payment for products / services
L Labor
SL Salary
№ Contact number

Taxes

Transportation firm
Legend in the model: 1 – households buy final products; 2 – households use firms’ services; 3 – households pay taxes; 4 – households receive salary for working in final processing firms; 5 – households buy residence; 6 – households receive salary for working in construction firms; 7 – state regulate external market; 8 – households receive salary for working in firms providing services; 9 – final processing firms buy products of construction firms; 10 – final processing firms buy products of construction firms; 11 – construction firms buy products of intermediate processing firms; 12 – extractive firms buy products of construction firms; 13 – firms providing services buy products of construction firms; 14 – intermediate processing firms buy products of extractive firms; 15 – final processing firms buy products of intermediate processing firms; 16 – final processing firms buy products of firms providing services; 17 – intermediate processing firms buy products of firms providing services; 18 – extractive firms buy products of firms providing services ; 19 – construction firms buy products of firms providing services; 20 – households receive salary for working in intermediate processing firms; 21 – households receive salary for working in extractive firms; 22 – firms providing services pay taxes; 23 – extractive firms pay taxes; 24 – final processing firms pay taxes; 25 – construction firms pay taxes; 26 – intermediate processing firms pay taxes; 27 – state collect taxes; 28 – firms pay to transportation firms for goods portage; 29 – households receive salary for working in transportation firms; 30 – state pay transfers to households.
Source: own calculations.
The model is implemented in the AnyLogic simulation environment. We describe a computational algorithm that interests us at this stage of the research issues with no details of the characteristics of the model’s capabilities – impact assessment for the regional economy from changes in consumer demand and “lengthening” of the value chains. We add that, for the most optimal solution of this problem, the methodological tools development contributes to the study of questions about stimulating the consumption of final processing products [12]. Final consumption, as an element of the reproductive system, is the most important factor in economic growth, and, in turn, regulation of final consumption implies stimulating consumer demand [13–16].
Assessing the consequences of consumer demand changes is carried out as follows. At the initial stage, the model is initialized, information is read from the databases: agents’ geographical coordinates, belonging to a particular region, intersectoral relations, income and taxes. Agents are located and interact on the built-in GIS-map, their location (latitude and longitude) is taken from the corresponding database table. Coordinates are assigned to all firms, except for transport ones (their location is a function of the location of interacting firms). Households in each region are located in the central parts of cities (it is possible to assign them a different location). An example of placing agents in one of the regions is shown in figure 2.
Households form applications for the required products (taking into account the agents’ location, transport tariffs). In this case, it becomes necessary to add customer requests as a new agent. In the agent diagram, parameters are added, and the properties indicate the type of the corresponding agent sending the request. The request for consumed products of a particular region is read from the table by adding several parameters to the agent diagram (in this case, the region in which the agent is located and the consumed products). To bind to
Figure 2. Agents’ location in Saint Petersburg
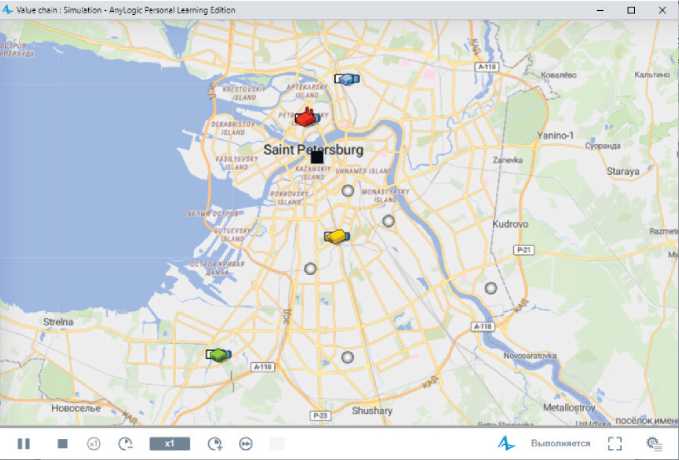
Source: own calculations are based on the AnyLogic software product.
the database, the SQL query constructor is used which allows visually generating queries to the built-in AnyLogic database. The final output value of each household agent will be directly read from the table by comparing the “region” parameter with the corresponding column. In addition, a cyclic event is added to the agent diagram which is triggered by Java code that indicates the formation of new requests from households and their sending (function send) to the agent.
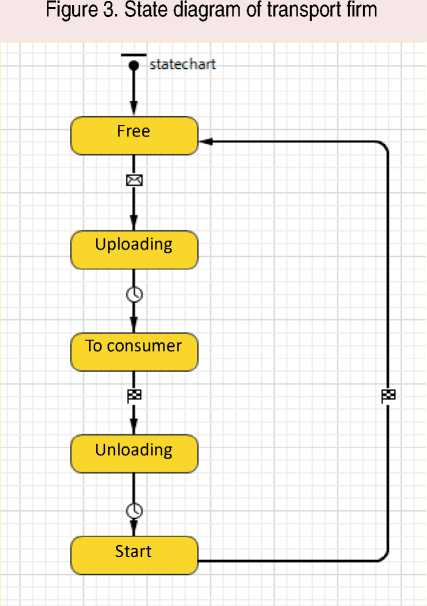
Then, agents interact through the network of contacts, and applications are received and processed by final processing firms. Using elements of system dynamics and the process modeling library, the production process is launched along the entire technological chain (taking into account the technological coefficients from the tables “input – output”). After manufacturing, a final product is transported to a consumer. As soon as the required quantity of products is formed, a transport is captured to deliver it to the agent who submitted the application. Products are delivered before calling the stopDelay function in the delay “delivering” block after which the transport is released, sent back to the company, and the request is deleted (block Sink). The state diagram of the transport company is in figure 3.
Agents make payments to each other (pay for consumed goods, issue wages, transfer taxes, etc.). In the future, household incomes are regulated and a new period begins. The consequences of the VC “lengthening” are evaluated in a similar way, except that the final stages of the period regulate the output of final processing firms (as a palliative of “lengthening”). The corresponding change in output, employment and payroll fund
Source: own calculations are based on the AnyLogic software product.
is calculated for the sectors of the regional economy by summing up the microdata of the lower level agents.
Data sources
An important step in building an agentbased model involves setting the initial state of the system and filling it with adequate statistical data. Agreeing with the approach [6; 17; 18], at the stage of the model initialization, we used regional tables “input – output” which characterize the incoming and outgoing flows of goods and services by economic sectors (one agent presents each sector in the model) and provide information about their relationships with suppliers and consumers. The creation of small-sized tables “input – output” for the studied regions was carried out according to the author’s methodology (developed under the RFBR grant 16-06-00136) on the basis of the most accessible information by regionalizing the Rosstat’s basic tables “input – output” in Russia for 201111.
Research results
Characteristics of VC regions
We tested the model on materials from three technologically related regions of the Northwestern Federal District: the Republic of Karelia, the Vologda Oblast, and St. Petersburg.
These territories specialize in the goods production of different processing depth. Extractive industries play an important role in the economic structure of the Republic of Karelia (almost 25% in the structure of product shipment; Tab. 1 ). Mined in the Republic, iron ores provide more than half of the demand for raw materials from metallurgical production in the Vologda Oblast. In turn, the Vologda Oblast specializes in the intermediate processing of iron ore raw materials (metallurgy occupies 64% of the region’s product shipment), producing various types of finished rolled ferrous metals. St. Petersburg produces on average even more “final” products. The finishing industry occupies the largest share among the regions in its economic structure. The city actively uses the existing metalworking and mechanical engineering capacities which account for more than a third of the sector’s output.
The regions’ location along the metallurgical value chain determines the fact that they are major trading partners. The Republic of Karelia sends almost 7% of its output to the Vologda Oblast (for comparison, 6.6% is to other regions; Tab. 2 ). The ninth part of deliveries of Vologda goods to Russian regions falls on
Table 1. Extended economic structure, % to the total
|
Economy sector |
Republic of Karelia |
Vologda Oblast |
Saint Petersburg |
|
Mining |
24.9 |
3.4 |
0.4 |
|
Intermediate processing |
13.5 |
68.0 |
43.4 |
|
Final processing |
9.7 |
5.9 |
7.8 |
|
Construction |
3.5 |
7.5 |
6.2 |
|
Transport |
7.6 |
6.8 |
17.7 |
|
Services |
40.8 |
8.4 |
24.5 |
|
Total |
100.0 |
100.0 |
100.0 |
|
Source: Rosstat data on the volume of the shipped products. |
|||
11 The choice of 2011 is determined by two points: 1) for 2011, Rosstat developed basic tables “input – output”, and in a more detailed nomenclature than for 2016 (126 vs. 95 products) which is important for further regionalization of tables “input – output”; 2) statistics on interregional product deliveries for 2011 contain “confidential” data that are hidden in publications of subsequent years in accordance with Federal Law no. 282-FZ “On official statistical accounting and the system of the state statistics in the Russian Federation” (Art. 4, P. 5, Art. 9, P. 1), dated November 29, 2007.
Table 2. Territorial structure of goods export, % to the total
|
Territory |
Region – supplier |
||
|
Republic of Karelia |
Vologda Oblast |
Saint Petersburg |
|
|
Republic of Karelia |
64.2 |
0.2 |
0.3 |
|
Vologda Oblast |
6.9 |
41.2 |
0.2 |
|
Saint Petersburg |
1.2 |
3.6 |
25.2 |
|
Other Russia’s regions |
5.4 |
30.7 |
69.3 |
|
Export |
22.3 |
24.1 |
5.0 |
|
Total |
100.0 |
100.0 |
100.0 |
|
Source: Rosstat data. |
|||
St. Petersburg; the goods export produced in St. Petersburg outside the city exceeds 74% of production volumes.
These data prove that the regions’ economy is tied to functioning within the existing interregional value chains. Changing the VC characteristics significantly influences the economic development and population’s standard of living. Let us evaluate the consequences of some possible transformations based on the agent-based model that we have developed.
Consequence assessment of consumer demand growth
Let us assume that the consumer demand has increased for the corresponding goods and services in the regions as a result of household income support (or other factors). The final consumption build-up will lead to the main economic indicators growth for the full range of economic activities.
According to our calculations, consumer demand stimulation in the Republic of Karelia by 10% of the base level will contribute to an increase in output in the economy as a whole by 6.8% (with a multiplier of output of 1.9111) including the final processing industries – by 7% ( Tab. 3 ). The number of employees, involved in production, will grow by 16.7 thousand people. The changes will also affect the payroll fund which will increase by almost 7.6 billion rubles. The average salary in the region will be higher by 100 rubles, or 0.25%. GRP growth will be 3.1%.
Table 3. Economic effects of consumer demand increase by 10% in the Republic of Karelia
|
Indicator |
Mining |
Intermediate processing |
Final processing |
Construction |
Transport |
Services |
Economy in general |
|
Basic final consumption (2011), mil. rub. |
3,918 |
10,659 |
14,979 |
53 |
5,945 |
72,235 |
117,112 |
|
Basic output, mil. rub. |
71,970 |
58,510 |
32,693 |
22,462 |
17,529 |
98,208 |
301,373 |
|
Basic number of employees, people |
14,081 |
24,730 |
13,351 |
9,147 |
30,357 |
114,450 |
206,115 |
|
Basic payroll fund, mil. rub. |
4,394 |
14,187 |
3,530 |
3,992 |
11,035 |
62,569 |
99,707 |
|
Final consumption increase by 10%, mil. rub. |
392 |
1,066 |
1,498 |
5 |
595 |
7,224 |
11,711 |
|
Output increase, % |
2.4 |
7.4 |
7.0 |
1.8 |
10.0 |
10.3 |
6.8 |
|
Increase the number of employees, people |
237 |
1,727 |
537 |
67 |
1,941 |
11,668 |
16,676 |
|
Payroll fund increase, mil. rub. |
107 |
802 |
161 |
-27 |
1,004 |
5,027 |
7,573 |
|
Source: own calculations are based on the developed ABM. |
|||||||
11 This multiplier characterizes the change in output caused by the change in final consumption.
Table 4. Economic effects of consumer demand increase by 10% in the Vologda Oblast
|
Indicator |
Mining |
Intermediate processing |
Final processing |
Construction |
Transport |
Services |
Economy in general |
|
Basic final consumption (2011), mil. rub. |
8,572 |
23,324 |
32,777 |
116 |
13,010 |
158,061 |
256,258 |
|
Basic output, mil. rub. |
33,354 |
414,242 |
49,329 |
84 087 |
66,540 |
144,759 |
792,311 |
|
Basic number of employees, people |
20,618 |
77,217 |
15,858 |
24 109 |
36,329 |
189,343 |
363,474 |
|
Basic payroll fund, mil. rub. |
7,517 |
39,300 |
4,997 |
9 619 |
17,599 |
71,794 |
150,824 |
|
Final consumption increase by 10%, mil. rub. |
857 |
2,332 |
3,278 |
12 |
1,301 |
15,806 |
25,626 |
|
Output increase, % |
11.3 |
2.3 |
10.2 |
1.1 |
5.8 |
15.3 |
5.7 |
|
Increase the number of employees, people |
2,228 |
1,663 |
1,516 |
157 |
1,994 |
28,802 |
36,861 |
|
Payroll fund increase, mil. rub. |
749 |
797 |
409 |
3 |
915 |
10,859 |
14,231 |
|
Source: own calculations are based on the developed ABM. |
|||||||
The growth of final household consumption by 10% in the Vologda Oblast will ensure an increase in GRP by 2.1% ( Tab. 4 ). The number of employees will rise by 36.8 thousand people. It is notable that, despite a significant increase in the payroll fund (by 14.2 billion rubles), the average salary in the region will decrease by 209 rubles, due to the fact that the economic structure is dominated by intermediate processing industries, where wages are higher than in the stimulated final processing sector. Gross output in the economy as a whole will increase by 5.7% and by 10.2% in the final processing sector. The output multiplier will be 1.91.
In St. Petersburg, a 10% increase of consumer demand will stimulate total output by 1.1% (Tab. 5). A number of people employed in the production will grow by 24.2 thousand people; the payroll fund will rise by 17.6 billion rubles. The average salary will slightly increase in the city (by 25 rubles, or by 0.04%). The greatest impact of the final consumption stimulation will be on the output of final processed goods (+1.8%). Positive changes will also be notable in the additional growth in GRP which will amount to 0.51%. In general, the output multiplier in St. Petersburg will reach 2.03.
As we can see, consumer demand stimulation has a significant impact on the regional economic development. The calculated multipliers of output, showing its full growth, the initial source of which was the final demand for products, are quite high and reach 2.03. Thus, consumer demand increase by 1 ruble stimulates the production of goods and services in the economy by 2 or more rubles.
Table 5. Economic effects of consumer demand increase by 10% in St. Petersburg
|
Indicator |
Mining |
Intermediate processing |
Final processing |
Construction |
Transport |
Services |
Economy in general |
|
Basic final consumption (2011), mil. rub. |
12,056 |
32,802 |
46,098 |
163 |
18,297 |
222,296 |
2,049,289 |
|
Basic output, mil. rub. |
28,237 |
1,944,230 |
401,065 |
334,949 |
667,948 |
2,550,757 |
5,927,186 |
|
Basic number of employees, people |
6,560 |
289,317 |
67,007 |
124,156 |
269,941 |
1,325,471 |
2,082,453 |
|
Basic payroll fund, mil. rub. |
8,756 |
232,793 |
40,131 |
70,554 |
217,514 |
891,261 |
1,461,008 |
|
Final consumption increase by 10%, mil. rub. |
1,206 |
3,280 |
4,610 |
16 |
1,830 |
22,230 |
204,929 |
|
Output increase, % |
6.8 |
0.8 |
1.8 |
0.4 |
0.9 |
1.3 |
1.1 |
|
Increase the number of employees, people |
1,219 |
2,076 |
1,067 |
424 |
2,316 |
16,620 |
24,222 |
|
Payroll fund increase, mil. rub. |
1,660 |
1,651 |
635 |
198 |
1,847 |
11,143 |
17,634 |
|
Source: own calculations are based on the developed ABM. |
|||||||
Consequence assessment of VC “lengthening”
Showing the income growth importance and the consumer demand stimulation to the economy, let us assume that the purposeful policy result on VC development, implementation point of investment in the regions increased the output of final processing sector (introducing a new production of finished metal goods, engineering products, food, textile, pharmaceutical, and other consumer goods). Where is the final processing development more profitable? We will compare the three territories increasing the output of the final processing sector by a fixed amount of 1 billion rubles.
If the determining criterion is to choose the employment growth and employees’ salaries (it is a significant source of income tax for individuals in the regional budget), the Republic of Karelia will be the leader. The payroll fund increase will amount to 412 million rubles which is 18% higher than the level of the Vologda Oblast and 8% higher than in St.
Petersburg. The same situation will be with the employees’ number: in the Republic of Karelia, its value will outstrip the Vologda Oblast by 8%, St. Petersburg – by 2.1 times ( Tab. 6 ).
However, if we place stake on the absolute increase in output (the volume of which largely determines the value added tax credited to the Federal budget), St. Petersburg will become the leader due to the current economic structure. The total growth in output will be 6.4% higher than in the Republic of Karelia and 5.7% higher than in the Vologda Oblast.
Thus, the decision to choose a place for the development of a particular type of production is not always clear; it requires taking into account many factors (including those not shown by us) and implementing appropriate model calculations.
Conclusion
In the study, we attempted to assess the consequences of stimulating consumer demand and “lengthening” value chains for the regional economy using an agent-based model of the
Table 6. Economic effects of output growth in the final processing sector by 1 billion rubles
-
1) Growing in the final consumption level ensures an increase in the output of consumer products and, as a result, induces the industries’ development that are technologically located lower in the corresponding value chains (i.e., in the intermediate processing and mining sector). The magnitude estimation of these effects is facilitated by using the information on the level of intersectoral interactions from the tables “input – output” in modeling. Increased consumer spending provide, in addition to the profit growth of businesses serving the consumer sector (a large share of goods and services output), the increase of resources for the organizations of other VC sites, some of which may be subsequently directed into investment. To stimulate final consumption, it is important to maintain the level of population’s income and social expenditures of the budget, ensuring, at least, the increase in salaries in the public sector [19; 20]. Another direction of growing the population’s income is to increase the efficiency and productivity of labor. This will be facilitated by stimulating the introduction of social innovations, advanced management and production technologies, improving working conditions at enterprises, implementing policies to prevent the qualified personnel’s emigration, reducing diseases and early mortality.
-
2) VC “lengthening” (which we simply understand as an increase of the production capacity of the final processing sector) brings various economic effects for the national economy, depending on the spatial location of enterprises. In our opinion, it is important to model various scenarios at the stage of their design in order to choose the optimal configuration of interregional, etc.
Further research prospects are related to the improvement of the developed model and the expansion of its analytical capabilities. It is planned to raise the number and types of agents, increase the aggregation of economic sectors, develop interaction in production chains, add budget-tax and investment blocks, assess the consequences of import substitution, etc.
The novelty of the research defining its contribution to the science is in working out the methodological tools for modeling interregional value chains, based on a synthesis of agent-based and cross-sectoral approaches that take into account interregional interaction and carry out variant calculations of events. The article materials can be useful for decisionmakers in justifying economic policy at the regional level.
Acknowledgment
The authors are deeply grateful to the anonymous reviewers for a detailed article analysis, valuable comments and suggestions for its revision.
References Experience in agent-based modeling of interregional value chains
- Kaplinsky R. Globalisation and unequalisation: What can be learned from value chain analysis? Journal of Development Studies, 2000, vol. 37 (2), pp. 117–146. DOI: 10.1080/713600071
- Lukin E.V. Sectoral and territorial specifics of value-added chains in Russia: the input-output approach. Ekonomicheskie i sotsial’nye peremeny: fakty, tendentsii, prognoz=Economic and Social Changes: Facts, Trends, Forecast, 2019, vol. 12, no. 6, pp. 129–149. DOI: 10.15838/esc.2019.6.66.7 (in Russian).
- Makarov V.L., Bakhtizin A.R. New tools in the social sciences – agent-oriented models: General description and specific examples. Ekonomika i upravlenie=Economics and Management, 2009, no. 12 (50), pp. 13–25 (in Russian).
- Makarov V.L., Bakhtizin A.R., Sushko E.D., Vasenin V.A., Borisov V.A., Roganov V.A. Supercomputer technologies in social sciences: Agent-oriented demographic models. Vestnik rossiiskoi akademii nauk=Herald of the Russian Academy of Sciences, 2016, vol. 86, no. 3, pp. 252–262 (in Russian).
- Suslov V.I., Domozhirov D.A., Ibragimov N.M., Kostin V.S., Melnikova L.V., Tsyplakov A.A. Agent-based multiregional input-output model of the Russian economy. Ekonomika i matematicheskie metody=Economics and Mathematical Methods, 2016, vol. 52, no. 1, pp. 112–131 (in Russian).
- Domozhirov D.A., Ibragimov N.M., Mel’nikova L.V., Tsyplakov A.A. Integration of input – output approach into agent-based modeling. Part 1. Methodological principles. Mir ekonomiki i upravleniya=World of Economics and Management, 2017, vol. 17, no. 1, pp. 86–99 (in Russian).
- Domozhirov D.A., Ibragimov N.M., Melnikova L.V., Tsyplakov A.A. Integration of input – output approach into agent-based modeling. Part 2. Interregional analysis in an artificial economy. Mir ekonomiki i upravleniya=World of Economics and Management, 2017, vol. 17, no. 2, pp. 14–25 (in Russian).
- Suslov V.I., Domozhirov D.A., Kostin V.S., Mel’nikova L.V., Ibragimov N.M., Tsyplakov A.A. Agent-based modeling of spatial processes in world economy. Region: ekonomika i sotsiologiya=Region: Economics and Sociology, 2014, no. 4 (84), pp. 32–54 (in Russian).
- Fuller D.B., Filhoa V.J.M.F., de Arruda E.F. Oil industry value chain simulation with learning agents. Computers & Chemical Engineering, 2018, vol. 111, pp. 199–209. DOI: 10.1016/j.compchemeng.2018.01.008
- Keramydas C., Aidonis D., Bechtsis D. Agent-based simulation for modeling supply chains: A comparative case study. International Journal of New Technology and Research (IJNTR), 2016, vol. 2 (10), pp. 36–39.
- Handayati Y., Simatupang T.M., Perdana T. Value co-creation in agri-chains network: An agent-based simulation. Procedia Manufacturing, 2015, vol. 4, pp. 419–428.
- Leonidova E.G. Stimulating final consumption within the reduction of regional inequality. Ekonomicheskie i sotsial’nye peremeny: fakty, tendentsii, prognoz=Economic and Social Changes: Facts, Trends, Forecast, 2020, vol. 13, no. 3, pp. 59–73. DOI: 10.15838/esc.2020.3.69.5 (in Russian).
- Zemskova E.S., Koloskov D.A. Deformation of the structure of final consumption as an obstacle to economic growth (on the example of the Republic of Mordovia). Naukovedenie=The Eurasian Scientific Journal, 2017, no. 6. Available at: https://naukovedenie.ru/PDF/77EVN617.pdf (in Russian).
- Mirolyubova T.V., Voronchikhina E.N. Reasons of the priorities of economic policy based on the structural analysis of gross regional product (in the case study of Perm Krai). Vestnik Permskogo universiteta. Ser. «Ekonomika»=Perm University Herald. Economy, 2017, vol. 12, no. 1, pp. 91–109. DOI: 10.17072/1994-9960-2017-1-91-109 (in Russian).
- Rozhkovskaya E.A. Dynamics and structure of final consumption as a factor of economic growth. Ekonomicheskii byulleten’ NIEI Ministerstva ekonomiki Resp. Belarus’=Economic Bulletin of the Research Economic Institute of the Ministry of Economy of the Republic of Belarus, 2008, no. 1, pp. 4–18 (in Russian).
- Ivanter V.V. Prospects for recovery of economic growth in Russia. Vestnik RAN=Herald of the Russian Academy of Sciences, 2017, no. 1, pp. 15–28. DOI: 10.7868/S0869587317010042 (in Russian).
- De Andrade P.R., Monteiro A.M.V., Camara G. From input-output matrixes to agent-based models: A case study on carbon credits in a local economy. In: Proc. of the 2010 Second Brazilian Workshop on Social Simulation (BWSS’10). IEEE Computer Society. Washington, DC, USA, 2010. Pp. 58–65.
- Oliva G., Panzieri S., Setola R. Agent-based input-output interdepency model. International Journal of Critical Infrastructure Protection, 2010, vol. 3 (2), pp. 77–82.
- Lukin E.V., Uskova T.V. Structural transformation issues in regional economy. Ekonomicheskie i sotsial’nye peremeny: fakty, tendentsii, prognoz=Economic and Social Changes: Facts, Trends, Forecast, 2018, vol. 11, no. 6, pp. 26–40. DOI: 10.15838/esc.2018.6.60.2 (in Russian).
- Uskova T.V., Lukin E.V., Vorontsova T.V., Smirnova T.G. Problemy ekonomicheskogo rosta territorii [Issues of economic growth in the territories]. Vologda: ISEDT RAS, 2013. 170 p.
