Experimental selection of spatial Gauss-Laguerre modes

Author: Khonina S.N., Kotlyar V.V., Skidanov R.v, Wang Y
Journal: Компьютерная оптика @computer-optics
Section: Технологии компьютерной оптики
Article in issue: 19, 1999.
Free access
Short address: https://sciup.org/14058391
IDR: 14058391
Text of the article Experimental selection of spatial Gauss-Laguerre modes
Feasibility of the effective correlation analysis of spatial Gauss-Laguerre (GL) modes is experimentally shown. The laser beam of desired transverse-modal composition was generated using a binary-phase diffractive optical element (DOE). A 24-channel phase DOE was employed as a matched spatial filter. Ratio of the correlation signal to the average background noise is 42.
The spatially matched filtration of GL modes using a 9-channel DOE has been numerically simulated in [1]. Numerical simulation of generation of multi-mode GL beams using binary-phase DOEs is discussed in [2]. The paper [3] reports on the development of a multi-channel phase DOE that can transform an incident plane beam onto 24 diffraction orders with nearly uniform energy distribution, with the light beams of desired GL mode combination propagating at each diffraction order. Such an optical element which has been given the name mo-dan in monograph [4] can be used as a matched spatial filter for detecting (selecting) GL modes.
In the present paper, we discuss an experiment on selection of GL modes using a Fourier-correlator in which a phase DOE is used as a matched spatial filter. Figure 1 depicts an optical setup of the experiment. At the distance l 1 from the end of a He-Ne laser of wavelength 2 =633 nm is found a binary-phase DOE- that transforms the Gaussian beam V 0 into the GL mode V 1 :
^o(r) = A0 exP*
r2
^( r ,5) = 4^ + %д =
8^ r Г 2
aa
x exp*
^^^^^^^B
^^^^^^^B
V
41a у
X
,


2 Г 1 k I
r I —- + i— I >cos5
V 2 а2 2 R У
^n±m (Г, 5) =
Lm
n
r 2
V a у
exp
^^^^^^^B
V
r)
2 a у
m
X
exp(±im0)
are GL modes, R is curvature radius of the Gaussian beam, k=2 n / 2 is light wavenumber.
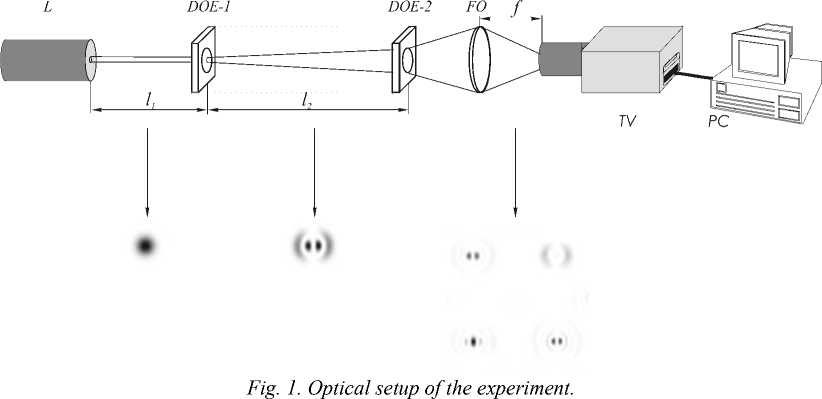
The light beam whose amplitude is proportional to the superposition of the two first GL modes in Eq. (2) is generated by a binary-phase DOE-1 that was fabricated using an e-beam lithography at the Joensuu university, Finland [2]. The distance l1 (Fig. 1) is fitted in such a manner so that the Gaussian beam radius a of Eq. (1) and the DOE-1 diameter be matched. The DOE-1 plane is the input plane of the Fourier correlator. Since in the course of propagation the GL modes preserve their structure, the Fourier transform can be implemented in the correlator without a spherical lens. A matched spatial filter, DOE-2, is found at the distance l2 from the DOE-1, with a 24-order phase multi-level DOE-2 (also fabricated at the Jeonsuu university [3]) used as the spatial filter.
Each diffraction order the DOE-2 generates consists of either two identical GL modes with mutually opposite rotation: (n,-m)+(n,m), or a single GL mode with the number (n,0). Such a choice of the modes in DOE-2 saves us the trouble of keeping these modes complex- conjugate relative to the modes in an input (analyzed) beam.
The second Fourier transform is implemented in the correlator by a Fourier-objective FO of focal length f =400 mm (Fig. 1), with a TV camera matched to the computer PC and found in its rear plane (correlator’s output plane).
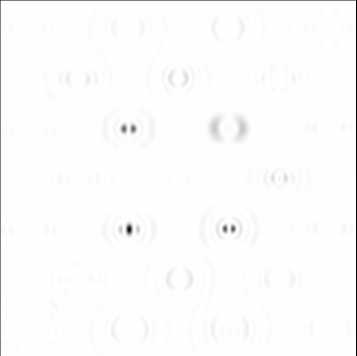
If in the input laser beam there is a GL mode matched to the mode of the spatial filter DOE-2, a correlation signal of the spatial frequency equal to that of the DOE-2 mode will be found in the output plane. Figure 2 depicts the intensity (squared modulus) of the GL mode (1,-1)+(1,1) derived from Eq. (2) with the parameter a =1 mm. This mode is fed to the correlator’s input. The estimated intensity at the correlator’s output is shown in Fig. 2b. It can be seen from Fig. 2b that the correlation signal is found at point with the spatial frequency corresponding to the (1,-1)+(1,1) mode (for the correspondence between the mode numbers, see Fig. 2c). Figure 2d depicts the estimated intensity at the correlator’s output, when a plane wave (a point source at the input) illuminates the spatial filter DOE-2.
The experimentally registered intensity distribution at the correlator’s input produced by the DOE-1 is shown in Fig. 3a. Due to the fact that the binary-phase DOE can generate the mode A of Eq. (2) only approximately, the difference between patterns in Fig. 2a and Fig. 3a is clearly seen.
The experimentally registered intensity distribution at the correlator’s output is shown in Fig. 3b. The correlation signal is seen to occur at the place of the A mode localization, as predicted in Fig. 2b. As distinct from Fig. 2b, the redistribution of background energy can be seen in Fig. 3b. To prove that the correlation signal is independent of the mutual angular position of DOE-1 and DOE-2 (relative to the angle 45 ° ), the binary-phase DOE-1 and, hence, the input beam, was turned by an angle of 45 degrees relative to its estimated position (see Figs. 2a and 3a).
Table 1 gives estimated and experimental standardized values of the intensity at the centers of several diffraction orders.
б)
|
%,2)Х/(5,1)Х/ \(5.-2)/\(5,-l)/\ |
(5,0) |
XV^4)\ /\(4,-4)/ |
|
\/(3,l)+\/ p QX /\3.-l)/\1"’ ' |
(2,2)X/ |
|
|
(2,-2b^ |
||
|
AW А/ \(5.-3) Z\( |
(0.0) |
(4,3) A /\(4,-3)/ |
|
\/(3.2)A/ |
(2,1) AZ |
|
|
/\(3,-2/\ |
(2,-1A\ |
|
|
Z(5,4)A/(1.1)A/ |
(2,0) |
\Z (4,2) A |
|
\(5,-4)Д(1.-1/\ |
/\(4,-2A |
|
|
\Z(3,3)+\Z (40) |
(4,1)+\Z |
|
|
Z\(3,-3) ’ |
(4,-l)^\ |
|
|
Z(5.5)+\/(6,0) |
(6.1)AA(6,2)A |
|
|
zysyV Vх |
AD |
|
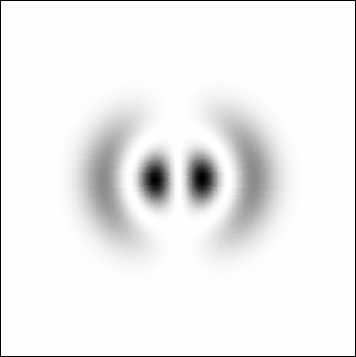
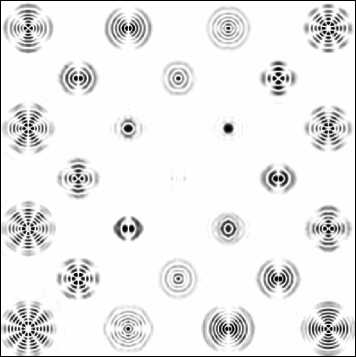
Fig. 2. (a) The result of simulation: the intensity distribution of the ¥ 1 ( r, 0 ) mode at the correlator’s input; (b) the intensity distribution at the correlator’s output; (c) the mode numbers to which the matched spatial filter is tuned; (d) the output intensity distribution produced by a point source at the correlator’s input.
The estimated ratio of the correlation signal value to the mean background intensity is 127, while the experimental ratio is 42. Estimated and experimental ratio signal value to the maximal intensity at the centers of diffraction orders are 18 and 4.7, accordingly. Low experimental ratio is determined by the fact that the binary-phase DOE-1 generates the mode A approximately only.
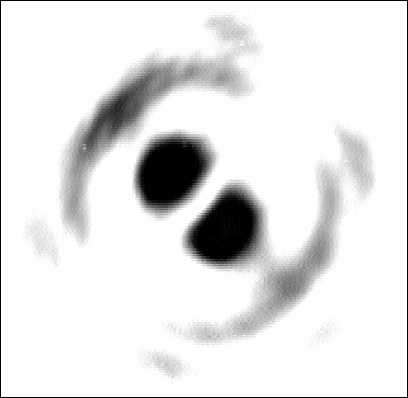
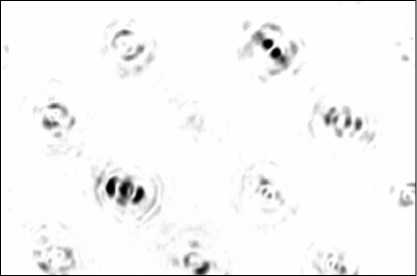
Fig. 3. The result of the experiment: (a) the intensity distribution at the correlator’s input produced by the binary-phase DOE-1; (b) the intensity distribution at the correlator’s output.
Table1. Estimated and experimental standardized values of the intensity at the centers of several diffraction orders
|
Diffraction orders |
(0,0) |
(1,0) |
(1,-1)+(1,1) |
(2,0) |
(2,-1)+(2,1) |
(3,-2)+(3,2) |
|
Estimated |
0,0196 |
0,0087 |
1 |
0,0039 |
0,0549 |
0 |
|
Experimental |
0,0784 |
0,0235 |
1 |
0,0157 |
0,2127 |
0 |
Thus, in this paper we have experimentally demonstrated that a phase DOE is suitable for the selection (recognition) of laser GL modes. This experiment holds promise for solving the problem of multi-channel operation in optical fiber communication lines when transmitting a signal through multi-mode fibers.
Acknowledgment
This work was supported by the Russian Foundation for Basic Research (grants No. 98-01-00894, 99-0139012).
