Express Method for Assessing the Complexity of New Developments Based on Analog Products

Author: Shcheglov D.K.
Journal: Петербургский экономический журнал @gukit-journal
Section: Экономика и управление хозяйствующими субъектами
Article in issue: 1 (47), 2025.
Free access
In the standard methods of conducting feasibility studies for R&D projects in the field of mechanical engineering, project complexity is typically taken into account using empirical coefficients that lack a rigorous scientific basis. Therefore, it is important to improve existing methods for organizing production processes with the goal of increasing the accuracy with which the complexity of prospective projects can be assessed. This will in turn enable a more precise estimation of the difficulty and timeframe for implementing such projects in the future. The aim of this proposed study is to develop a scientific and methodical framework (expressed as a methodology) for evaluating the complexity of new projects based on data from similar projects. To accomplish this, the author will use methods of systems analysis, expert analysis, non-parametric statistics, and methodological recommendations from the Russian Ministry of Labor regarding labor regulations in R&D activities. The novelty of the proposed methodology lies in its ability to evaluate the complexity of various projects in mechanical engineering, including research, design, and manufacturing. This paper presents a formal approach to analyzing the complexity of new projects based on similar (prototype) projects. It also proposes a system of indicators for pre-project assessment of the complexity of research and new developments, as well as the permissible numerical values for these indicators in specialized mechanical engineering. The proposed methodology allows for a practical evaluation of the complexity of a project in order to make informed organizational and technical decisions. It can also be used for further feasibility studies for R&D efforts in the field of mechanical engineering.
Complexity evaluation, design and engineering work, r&d, analog method, systematic approach, complexity metrics
Short address: https://sciup.org/140309217
IDR: 140309217 | UDC: 658.512.26:338.5 | DOI: 10.32603/2307-5368-2025-1-157-169
Экспресс-методика оценки сложности новых разработок на основе проектов-аналогов
В общепринятых методиках проведения технико-экономического обоснования исследований и разработок в области машиностроения сложность проектов, как правило, учитывается эмпирическими коэффициентами, которые не имеют строгого научного обоснования. Таким образом, актуальной является задача совершенствования существующих методов организации производства в направлении повышения точности оценки сложности перспективных проектов, что в будущем позволит более точно оценить трудоемкость и сроки их реализации. Целью предлагаемой работы является разработка научно-методического инструментария (экспресс-методики) для оценивания сложности новых разработок на основе информации о проектах-аналогах. Для достижения поставленной цели автором используются методы системного анализа, экспертного анализа, непараметрической статистики, а также методические рекомендации Минтруда России по нормированию труда при выполнении НИОКР. Новизна предлагаемой экспресс-методики, заключается в том, что она позволяет оценивать сложность проведения различных проектов в области машиностроения, а именно: научно-исследовательских, проектно-конструкторских и производственно-технологических. В рамках настоящей статьи описан формализованный подход к анализу сложности новых разработок на основе проектов-аналогов (прототипов), предложил систему показателей для предпроектной оценки сложности новых исследований и разработок, а также допустимые числовые значения этих показателей для исследований и разработок, реализующихся в области специального машиностроения. Предлагаемая экспресс-методика позволяет на практике оценить сложность машиностроительного проекта с целью принятия результативных организационно-технических решений, а также дальнейшего технико-экономического обоснования проведения исследований и разработок.
Text of the scientific article Express Method for Assessing the Complexity of New Developments Based on Analog Products
Introduction, purpose
Understanding the complexity of research and development (R&D) during the planning phase is a key indicator of the quality of an organization’s of processes for developing and manufacturing high-tec h produc ts [1–4]. The quality of production planning is characterized by accuracy in estimating the volume of resources (time, budget, specialists) required for implementing of prospective projects [5; 6].
Adequate evaluation of the complexity of new projec ts during the planning phase not only facilitates better preparation for potential challenges but also provides an opportunity to identify and mitigate potential organizational and technical risks. This allows for the development of strategies and the implementation of preventive and corrective measures to prevent or minimize project risks. Furthermore, companies and organizations that are able to accurately assess and effectively manage project risks have a competitive advantage [7]. These organizations are better positioned to offer more competitive products and services within established timeframes, thus strengthening their position in the high-technology market.
Currently, there is no universally accepted methodology for assessing the complexity of R&D projects, which requires each organization to develop their own approaches [8]. This can make it difficult to compare similar R&D outcomes between organizations. However, this flexibility also allows the methodology to be adapted to the specific needs and characteristics of individual projects or organizations. It should be noted that the complexity of a developed product is not directly related to the complexity of its development for project organizations [7; 8]. This is due to differences in experience and expertise between project teams in developing certain types of products, meaning that a project's complexity can vary for different organizations despite the same product.
The complexity of developed products and/ or projects is dependent on a variety of factors, including technical specifications, the level of innovation, and the degree of integration between research and development efforts and existing technical systems. Furthermore, collecting data from previously developed products and completed projects may be hindered by the heterogeneity and incompleteness of available information, creating additional challenges in the complexity evaluation process.
The analysis of the level of com p lexity in new d evelopments is also influenced by subjective assessments, as different experts may have varying opinions on what constitutes the complexity of a developed product or project.
Therefore, the need to enhance the accuracy and validity of the assessment of labor intensity in
The aim of this paper is to develop scientific and methodological instruments for assessing the complexity of new R&D projects using information about similar projects.
Research methods
Let us assume, from the perspective of a particular organization, that the complexity of a product is equivalent to the complexity of the process of developing it. Based on this assumption, we will henceforth refer to «project complexity» as the term used.
O ne of the m ost c om m on m eth od s for assessing the complexity of new projects is through the analysis of analogous projects, where the complexity of the new project is determined by comparing it to already existing, similar projects [10]. This approach assumes that products with similar characteristics and functional purposes will have similar complexities in the development and production processes.
As seen from the analysis of Figure 1, the process of assessing project complexity based on analogous projects includes the following subprocesses:
– Identification of analogues: First, it is essential to identify relevant existing projects that possess similar technical or functional features to the product or technology under development;
– Data collection: Once the analog projects have been identified, the next step is to collect data on the resources (human, time, material, technology) that were used in their implementation. This includes information on the development and production processes of these products;
– Comparison of characteristics: A comparative analysis should be conducted between the identified similar projects in order to determine sim ilarities and differenc es in the projec t structures, the technical characteristics of the products developed, as well as the scope of work required. This analysis should be carried out using the organization's established methodology
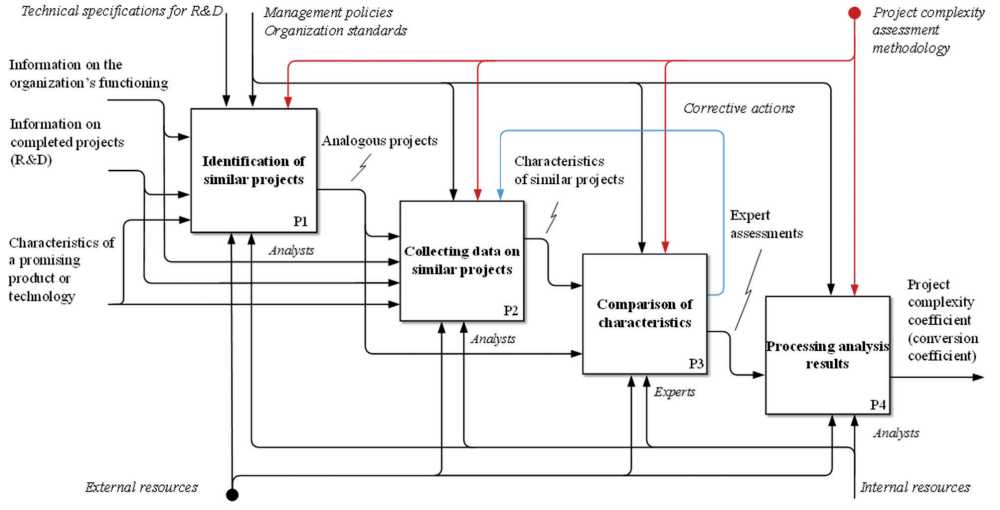
Fig. 1. The process of assessing project complexity based on analogous projects
Рис. 1. Процесс оценивания сложности проекта на основе проектов-аналогов
Source: made by the author.
Источник: составлено автором.
for expert evaluation. This methodology could include comparing the resources (both human and financial) and time (in terms of labor intensity) required to achieve the desired results in the development of a product or technology;
– Processing analysis results: After experts have completed the process of comparing the new project to similar projects, it will be necessary to analyze the results and calculate a project complexity factor (translation factor).
There are various methods available for estimating the costs associated with developing new products [11]. However, most of these approaches do not fully account for the scientific and theoretical basis of the proposed innovations, their level of novelty, nor the changes in organizational and technological conditions that may occur during the research and development process.
According to section 5.6.1 of the Methodological Recommendations for Labor Standardization in the Im plem entation of R&D [12], the labor intensity of a new development W new is determined by the following formula:
W new = W а K tr , (1) where W а – is the labor intensity of the analogous project [person-months]; K tr – is the translation coefficient that accounts for the degree of novelty and changes in the organizational and technical conditions of the research and development.
Thus, the issue of determining this coefficient is relevant.
Let's introduce a set of a nal ogous projects A = { A 1, A 2, An , …, AN }, n = 1, N , where N – is the number of selected analogous projects.
Let's als o introduce a set of c ompar iso n indicators K = { K 1, K 2, Km , …, KM }, m = 1, M , where M – is the number of these indicators. Each comparison indicator includes classifica tio n features, i. e. Km = { Km 1, Km 2, …, Kml }, l = 1, L , where L – is the number of classification features for each indicator Km .
Indicator K1: Presence of analogues (product, technology). Evaluating the novelty and uniqueness of a new project involves considering the following aspects:
– Complete analogue ( K 11): The new project (development) has a complete analogue in the form of an existing product or technology. This existing product or technology fully matches the new project with regard to functionality, structure, and operating principle;
– Similar analogue ( K 12): The new project (development) has an analogue, which is similar in some respects, but is not a complete analogue. There are products and technologies that perform similar functions and use similar operating principles, but have differences in their structure or core ideas;
– Absence of analogues ( K 13): The new project (development) has no direct or similar analogue. The developed product is unique and has no analogue among existing products or technologies.
Indicator K 2: Availability of information on the subject area. Evaluating the existing information base for the development of a new project includes the following classification features:
– Complete and reliable information ( K 21): There is complete and reliable information about the subject area, which allows for accurately determining the requirements for the developed product or technology and identifying the specifics of its creation;
– Excessive or unreliable information ( K 22): There is sufficient information about the subject area, but some of it is unreliable or contradictory. Additional work is required to verify the information during the development of the product or technology;
– Insufficient but practically reliable information ( K 23): There is insufficient information about the subject area, but the available information is reliable. Research is needed to obtain additional information for the development of the product or technology;
– Insufficient and unreliable information ( K 24): There is insufficient information about the subject area, and the available information is unreliable. In-depth analysis and research of the subject area are required to obtain more accurate data for the development of the product or technology.
Indicator K3: Predominant information source. Evaluating the existing information base for the development of a new project includes the following classification features:
– In Russian-language sources ( K 31): The necessary information about the subject area is available in Russian-language sources, including scientific articles, monographs, textbooks, scientific and technical reports, etc.;
– In English-language sources ( K 32): The necessary information about the subject area is available in English language sources. English is the international language of communication in science and technology, so English-language sources typically contain information on current research, technical samples (products), and new technologies;
– In sources in European languages ( K 33): The necessary information about the subject area is available in European languages, such as German, French, Spanish, etc.;
– In sources in Chinese and other languages ( K 34): The necessary information about the subject area is available in Chinese, as well as other languages prevalent in certain regions or countries. Considering China's significant influence on the global economy and innovation, analyzing information in Chinese allows for identifying current trends in the development of technology and innovation.
Indicator K 4: Problem-solving principle. Selecting an approach for developing a new project includes the following classification features:
– Using a known principle ( K 41): The problem is solved by applying already known and tested principles for developing a product or technology, which have been successfully used in the past for solving similar problems;
– Choosing one of several existing principles ( K 42): It is necessary to choose and justify one of the existing principles for developing a product or technology that best suits the task at hand;
– Selecting and modifying one of several principles for the specific task ( K 43): It is necessary to significantly refine one of the existing principles for developing a product or technology to solve the given problem;
– Principle involves resolving a technical contradiction ( K 44): Solving the problem requires resolving a technical contradiction that arises during the development of a new product or technology, as well as improving an existing one;
– Creating a new problem-solving principle ( K 45): The known principles for developing a product or technology are not applicable for solving the specific problem.
Indicator K 5: Information processing. Evaluating the labor intensity of processing the existing information base for the development of a new project includes the following classification features:
– Systematization of information related to the object of development and its functional capabilities if one of the existing principles is chosen ( K 51): Systematization of information related to the object of development and identifying its functional capabilities is required if one of the existing principles is chosen;
– Systematization of information related to the object of development and its functional capabilities if one of several principles is chosen and modified for the specific task ( K 52): It is necessary not only to systematize information based on the c hosen princ iple but als o to subsequently modify or adapt it to the specific project tasks;
– Reprocessing information for the specific task ( K 53): The existing information needs to be reprocessed to adapt and apply it to the specific development task, including data analysis and synthesis, modification of research methods or algorithms, etc.;
– Creating an information base from indirect sources ( K 54): It is necessary to consider information obtained from indirect sources, such as consumer reviews, similar projects, etc.
Indicator K 6: Task complexity. Evaluating the technical, technological, and organizational complexity of developing a new project includes the following classification features:
– Involvement of specialists in one field of knowledge ( K 61): Solving the task requires the involvement of specialists from one field of knowledge. The project is focused on using a specific technology or scientific-methodological apparatus;
– Involvement of specialists in multiple fields of knowledge ( K 62): Solving the task requires the involvement of specialists from several different fields of knowledge. The project implementation requires the integration of various technologies, an interdisciplinary approach, or solving complex organizational and technical tasks;
– Involvement of unique specialists ( K 63): Solving the task involves the engagement of specialists with unique skills or experience in working with specific technologies or innovative methods.
Indicator K 7: Complexity of justifying the chosen research direction. The selection and justification of the development direction of a new project includes the following classification features:
– Low complexity ( K 71): Justifying the chosen research direction is relatively simple and does not require significant time and resource expenditures. The main idea of the research direction is supported by widely recognized facts, data, or theories;
– Medium complexity ( K 72): Justifying the chosen research direction requires conducting an analysis of the subject area. It is necessary to consider several alternative research directions, take into account diverse perspectives, and factors that may influence the choice of the research direction;
– High complexity ( K 73): Justifying the chosen research direction is a complex task that requires in-depth research and consideration of numerous heterogeneous factors. The justification is carried out under conditions of uncertainty in the initial data, ambiguity of previous research results, or conflicting views within the professional community.
Indicator K 8: Importance of problemsolving (Implementation scale). Evaluating the importance of developing a new project includes the following classification features:
– Local ( K 81): The project is focused on a local level and impacts a relatively small group of consumers. The application of the developed product or technology is limited to specific organizations or enterprises;
– Industry-level ( K 82): The project is of significant importance to a particular industry and covers several organizations (enterprises) or sectors of the economy. The application of the developed product or technology can influence standards, practices, and development directions within a specific industry;
– Cross-industry ( K 83): The project has a broad impact at the cross-industry level and covers multiple industries. The application of the developed product or technology can change existing processes, standards, and interactions between different industries and contribute to creating new market opportunities.
The proposed ranges of numerical values for the comparison indicators Km are presented in Table 1. The table also provides an example of evaluating the complexity of projects An from the set of analogous projects A and the new project A new for the creation of a product or technology. The proposed numerical values of the comparison indicators Km can be adjusted based on the specific production activities of a particular organization (or enterprise), which significantly affect the complexity of conducting R&D.
As seen in Table 1, each project An from the set of analogous projects A , as well as the new project for the creation of a product or technology A new, are evaluated based on each comparison indicator Km using the proposed scale of values for the corresponding classification features Kml .
The translation coefficient K tr( An ), which establishes the correspondence of each analogous project An to the new project A new, is calculated as follows:
MM
K tr ( A n ) = П K m ( A new ) П K m ( A, ) . (2) m =1 / m =1
The evaluation of the complexity of the newly developed product or technology A new and the analogous projects An is typically based on the method of expert assessments.
Let there b e a set of experts E = { E 1, E 2, Eq , ..., Eq }, q = 1, Q , where Q - is the number of experts. Each expert Eq analyzes and evaluates the project A new and the analogous projects An according to the system of indicators and their numerical values presented in Table 1. Then, the
Tab. 1. System of indicators for evaluating the complexity of R&D and example evaluation of analogous projects An and the new project A new based on these indicators
Табл. 1 . Система показателей для оценивания сложности НИОКР и пример оценки проектов-аналогов An и нового проекта A new по этим показателям
|
№ ind. |
Indicators for comparison |
Proposed values (not more than or interval) |
Example of project evaluation |
|||
|
A 1 |
AN |
A new |
||||
|
K 1 |
Presence of analogues (product, technology): |
|||||
|
K 11 |
Complete analogue |
1,00 |
– |
1,00 |
– |
|
|
K 12 |
Similar analogue |
1,50 |
1,50 |
– |
1,50 |
|
|
K 13 |
No analogue |
2,00 |
– |
– |
– |
|
|
K 2 |
Availability of domain information: |
|||||
|
K 21 |
Complete and reliable information |
0,8–1,2 |
– |
– |
– |
|
|
K 22 |
Excess information (or unreliable information) |
1,2–1,5 |
1,20 |
1,20 |
– |
|
|
K 23 |
Insufficient but practically reliable information |
1,5–2,0 |
– |
– |
1,80 |
|
|
K 24 |
Insufficient and unreliable information |
2,0–2,2 |
– |
– |
– |
|
|
K 3 |
Prevalent information: |
|||||
|
K 31 |
In Russian–language sources |
1,00 |
– |
1,00 |
– |
|
|
K 32 |
In English–language sources |
1,10 |
1,10 |
– |
1,10 |
|
|
K 33 |
In European–language sources |
1,20 |
– |
– |
– |
|
|
K 34 |
In Chinese or other regional languages |
1,50 |
– |
– |
– |
|
|
K 4 |
Principle for solving the problem: |
|||||
|
K 41 |
A known principle is used |
1,00 |
– |
– |
– |
|
|
K 42 |
One of several existing principles is chosen |
2,00 |
2,00 |
2,00 |
2,00 |
|
|
K 43 |
One of several principles is chosen and adapted for the specific task |
3,00 |
– |
– |
– |
|
|
K 44 |
The principle involves resolving a technical contradiction |
5,00 |
– |
– |
– |
|
|
K 45 |
A new principle for solving the problem is needed |
10,00 |
– |
– |
– |
|
|
K 5 |
Information processing: |
|||||
|
K 51 |
Systematization of information related to the development object and its functionality if one of several existing principles is chosen |
0,80 |
– |
– |
– |
|
|
K 52 |
Systematization of information related to the development object and its functionality if one of several principles is chosen and adapted for the specific task |
1,50 |
– |
– |
– |
|
|
K 53 |
Reworking of information relevant to the task at hand |
2,00 |
1,80 |
1,30 |
– |
|
|
K 54 |
Creation of an information base from indirect sources |
3,00 |
– |
– |
2,00 |
|
|
K 6 |
Complexity of problem solving: |
|||||
|
K 61 |
Requires specialists in one field of knowledge |
1,00 |
– |
– |
– |
|
|
K 62 |
Requires specialists in several fields of knowledge |
2,00 |
1,40 |
1,80 |
1,80 |
|
|
K 63 |
Requires unique specialists |
3,00 |
– |
– |
– |
– |
|
K 7 |
Complexity of justifying the chosen research direction: |
|||||
|
K 71 |
Low |
0,8–1,2 |
– |
– |
– |
|
|
K 72 |
Medium |
1,2–1,5 |
1,50 |
1,40 |
– |
|
|
K 73 |
High |
1,5–2,0 |
– |
– |
1,90 |
|
|
K 8 |
Importance of solving the problem (scale of implementation): |
|||||
|
K 81 |
Local |
1,00 |
– |
– |
– |
|
|
K 82 |
Sectoral |
1,20 |
1,20 |
– |
1,20 |
|
|
K 83 |
Cross–sectoral |
1,50 |
– |
1,50 |
– |
|
|
– |
Product of coefficients |
– |
17,9626 |
11,7936 |
48,7555 |
|
|
K tr ( A n ) |
Conversion coefficient |
– |
2,7143 |
4,1341 |
– |
|
Source: made by the author.
Источник: составлено автором.
translation coefficients K tr ( A n ) are calculated using formula (2).
After each expert Eq has compared the projects, the question arises of d e termining the resulting translation coefficient K tr ( A n ) , which represents the collective expert opinion.
In practice, there are many approaches to finding the collective expert assessment [13]. However, to simplify the processing of results and considering the specific task at hand, it is permissible to use the arithmetic mean of the expert assessments as the group evaluation, i. e.:
Q
K tr ( A n ) = Z K tr ( A n ) /Q , where q = 1, Q . (3) =1
After this, the translation coefficient (3) is used in equation (1) to determine the calculated labor intensities W new( An ) of the new project A new relative to the analogous project An , and then the average forecasted labor intensity of the new project is determined:
N
Cw = S K tr ( A n ) W new ( A n )/ N , (4) n =1
where n = 1, N, and ^new (An) - the average calculated labor intensity of the new project Anew relative to the analogous project An, which is defined as:
Q
W new ( A n ) = S W nqew ( A n )/ Q , q = 1, Q . (5) q =1
It should be noted that equation (5) provides a formalized way to determine the average forecasted labor intensity, while equation (4) serves as the basis for integrating expert assessments into the overall evaluation model. The process of evaluating the complexity of a project based on analogous projects must be statistically relevant from the perspective of experimental design theory.
Translation coefficients K tr ( An ) are typically represented by a small sample size, equal to the number of experts Q involved in the evaluation of the projects.
Numerical experiments show that for processing expert assessments in the express-analysis methodology, the condition Q ≥ 5 must be met. This allows for the use of non-parametric statistical methods, such as the Bootstrap method introduced by Bradley Efron in 1979, to expand the initial sample and obtain adequate analysis results [14]. A formalized description of the bootstrap analysis process is presented in Figure 2.

Fig. 2. Formalized description of bootstrap analysis
Рис. 2. Формализованное описание будстрап-анализа
Source: made by the author.
Источник: составлено автором.
As illustrated in Figure 2, the core of the method consists in constructing an empirical distribution from a small initial sample through random sampling with replacement (resampling) to generate a set of bootstrapped samples that are the same size as the original sample. The number of bootstrapped samples is only limited by computational resources, and can range up to 10,000 or more. Subsequently, the mean values of these bootstrapped samples are calculated. Employing the Monte Carlo method [14], a density function for the empirical distribution of mean values from the bootstrapped samples can be generated, from which desired statistics can be derived.
It is important to note that the dimension of the bootstrap sample means depends on the dimension of the original sample. The number of combinations that form unique bootstrap sample means will be equal to the number of combinations of Q taken Q with replacement, namely:
Qbs ( Q ) = C Q = Cqo 1 = /(2 Q - 1 ) ! • (6) BS Q 2 Q - 1 ( Q - 1 ) ! Q ,
Let's evaluate the confidence interval for the conversion coefficients K tr ( A n ) , which are the weighted average estimates from the bootstrap samples:
K tr ( A n ) - « в. q S k tr ( A n ) < M ( K tr ( A n ) ) <
-
< K tr ( A n ) + t e.Q S K tr ( A n ) . (7)
where M ( K tr( An )) – the expected value of the project's transfer coefficient An ; SK – standard error of the mean with Bessel's correction [15], and t β, Q – Student's t-value, dependent on the specified confidence level β and the number of measurements (in this case, the number of experts Q = QBS ).
Then, the result of the cost estimation for the new project A new will be determined with the following margin of error:
rez pr pr new new new’ (8)
N
Л « nperw = X « new ( A n ) « в. qSk „ ( A n )/ N • (9) n =1
Let's consider an example of applying the proposed express analysis methodology.
Results and discussion
It is essential to emphasize that the selected projects for comparison should be not only similar in nature, but also in terms of timeframes and the volume of scientific and technical documentation produced. Therefore, it is recommended to evaluate the work based on similar stages of the project, rather than the project as a whole. This approach allows for a more accurate comparison and estimation of labor intensity.
An example how to calculate the conversion factor for analogues projects and the labor intensity of a new project A new using the proposed express analysis methodology is provided in Table 2.
Based on the analysis of Table 2, the complexity and therefore the labor intensity of the R&D for the development of the new product A new have been determined using two selected analogues projects A 1 and A 2. According to the expert evaluations, project A 2 is considered a more relevant analogue to project A new, particularly at stage three, based on the proposed set of indicators Km .
We will conduct a bootstrap analysis and, for example, examine the density distributions of the mean values of the bootstrap samples for the transition coefficients K tr ( A i ) and K tr ( A 2 ) for the first stage of the R&D to create the product A new (Figure 3).
From the analysis of Figure 3, it is evident that the distribution densities of the average values of bootstrap samples for the conversion coefficients K tr ( A i ) and K tr ( A 2 ) conform to a normal distribution. In this example, this is due to a relatively high consistency among expert opinions.
It should be noted that a set of observed data can generally be described using one of the standard probability distributions commonly used in mathematical statistics. This is based on the relationship between the skewness and a kurtosis coefficient, which is described in detail in, for example, reference [16].
An exam ple of es tim ating the error in determining labor intensity, performed according to formulas (6)–(9), is presented in Table 3.
As demonstrated by the analysis presented in Table 3, when considering the issue in a probabilistic framework, the confidence interval is ±8.5 %. The analysis suggests that the error in estimating
Tab. 2. Calculation of labor intensity for R&D projects in product development A new Табл. 2. Расчет трудоемкости выполнения НИОКР по созданию изделия A new
|
№ stage |
Expert |
A 1 |
A 2 |
Average labor intensity for analogs W nfew ( A 1 , A 2 ) (man-mon) |
Estimated labor intensity pr new |
||||
|
Labor intensity of the analog W a ( A 1 ) (man-mon) |
Conversion coefficient K tr ( A 1 ) |
Estimated labor intensity W f ew ( A 1 ) (man-mon) |
Labor intensity of the analog W a ( A 2 ) (man-mon) |
Conversion coefficient K tr ( A 2 ) |
Estimated labor intensity W nfew ( A 2 ) (man-mon) |
||||
|
1 |
E 1 |
51,63 |
2,7143 |
140,14 |
41,12 |
4,1341 |
169,99 |
155,07 |
154,57 |
|
E 2 |
2,6789 |
138,31 |
3,9807 |
163,69 |
151,00 |
||||
|
E 3 |
2,7916 |
144,13 |
4,0517 |
166,61 |
155,37 |
||||
|
E 4 |
2,7224 |
140,56 |
4,1938 |
172,45 |
156,50 |
||||
|
E 5 |
2,6983 |
139,31 |
4,1476 |
170,55 |
154,93 |
||||
|
2 |
E 1 |
39,98 |
5,4167 |
216,56 |
55,14 |
4,0107 |
221,15 |
218,85 |
216,42 |
|
E 2 |
5,3435 |
213,63 |
3,9602 |
218,37 |
216,00 |
||||
|
E 3 |
5,4893 |
219,46 |
3,9721 |
219,02 |
219,24 |
||||
|
E 4 |
5,4281 |
217,02 |
3,9592 |
218,31 |
217,66 |
||||
|
E 5 |
5,0574 |
202,19 |
3,9617 |
218,95 |
210,57 |
||||
|
3 |
E 1 |
53,14 |
4,0912 |
217,41 |
154,16 |
1,5291 |
235,73 |
226,57 |
230,41 |
|
E 2 |
4,2167 |
224,08 |
1,5438 |
237,99 |
231,03 |
||||
|
E 3 |
4,3231 |
229,73 |
1,5253 |
235,14 |
232,43 |
||||
|
E 4 |
4,2915 |
228,05 |
1,5349 |
236,62 |
232,34 |
||||
|
E 5 |
4,1746 |
221,84 |
1,5407 |
237,51 |
229,68 |
||||
Source: made by the author.
Источник: составлено автором.
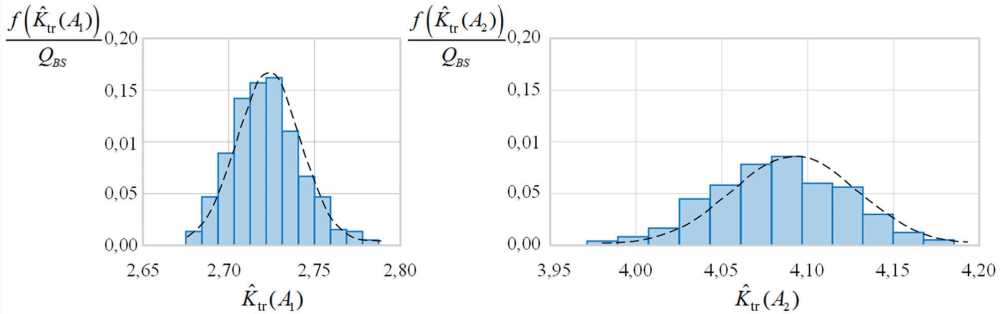
Fig. 3. Distribution densities of the average values of bootstrap samples for conversion coefficients K t. ( A ) and K t. ( A 2 ) for the first stage of R&D
Рис. 3. Плотности распределения средних значений бутстрап-выборок переходных коэффициентов K tr ( A 1 ) и K tr ( A 2 ) для первого этапа НИОКР
Source: made by the author.
Источник: составлено автором.
labor intensity is within acceptable limits and the proposed rapid methodology can be utilized in the practical application of technical and economic justifications for financial and economic indicators in new research and development projects.
Conclusion
Evaluating complexity based on analogues can be a useful technique in the early phases of a project, but it is important to recognize that each project has its own unique characteristics, and
Tab. 3. Estimation of error in determining labor intensity ±A W new Табл. 3. Оценка погрешности определения трудоемкости ±A W pr
|
№ stage |
Expected value of the analog conversion coefficient K r ( A 1 ) |
Standard error of the mean V. ( A 1 ) |
Average estimated labor intensity for the analog W new ( A 1 ) |
Expected value of the analog conversion coefficient K r ( A 1 ) |
Standard error of the mean S k r ( A 2 ) |
Average estimated labor intensity for the analog W new ( A 2 ) |
Average forecasted labor int e nsity pr new |
Labor intensity determination error ±A W new at β = 0,95 Q = 126 |
|
1 |
2,7249 |
0,0191 |
140,687 |
4,0917 |
0,0379 |
168,251 |
154,42 |
±9,07 (±5,9 %) |
|
2 |
5,3755 |
0,0760 |
214,912 |
3,9614 |
0,0098 |
218,431 |
216,67 |
±18,47 (±8,5 %) |
|
3 |
4,2416 |
0,0415 |
225,399 |
1,5325 |
0,0035 |
236,250 |
230,82 |
±10,16 (±4,7 %) |
Source: made by the author.
Источник: составлено автором.
data from similar projects should not be treated as an exact benchmark for assessing the complexity of a new project.
However, determining the translation factor, which determines the complexity of products or technologies under development, plays a critical role in predicting the labor intensity of work. T his fac tor s erves as an essential ind icator that helps determine not only the necessary level of effort and res ou rc es, bu t als o the projected timeline for the project. This approach allows organizations to more rationally plan their activities and avoid potential risks and unforeseen costs.
A thorough evaluation of project intricacy nec es sitates a c omprehensive analysis that takes into account not only data from analogous projects but also the distinctive characteristics of the current project, such as its goals, technical specifications, and level of in novation. Furthermore, the assessment of new projects must consider potential alterations throughout the development phase in order to guarantee accurate planning and successful project completion.
