Extraction and Analysis of Mural Diseases Information Based on Digital Orthophoto Map

Author: Miao-le Hou, Song Tian
Journal: International Journal of Image, Graphics and Signal Processing(IJIGSP) @ijigsp
Article in issue: 2 vol.2, 2010.
Free access
Currently, edge detection is an effective means of collecting and analyzing various diseases information from mural collections by using this and data mining based on digital orthophoto map (DOM). But it is hard to extract better edges of mural diseases with traditional edge detection algorithms. Therefore, a new K-means Sobel algorithm is proposed and two evaluation factors are given to judge the extracting effect. Experiment results demonstrate that we can get a better effect by using new method than traditional algorithms. At last, vectorizing detected results, we can gain diseases areas. On that basis, a decision tree about mural diseases severities is established to provide useful information for mural diseases investigation and repair.
Mural Collections, Clustering, Edge Detection, Decision Tree
Short address: https://sciup.org/15012040
IDR: 15012040
Text of the scientific article Extraction and Analysis of Mural Diseases Information Based on Digital Orthophoto Map
Published Online December 2010 in MECS
Mural collections are paintings like tomb, cave and temple frescoes, etc that we conserve in museums through ways of lifting and transporting. Many murals had been in endangered before lifting, but it would usually cause new emergence affected by rescue lifting, transfer and repair. Statistical data shows there are 27 kinds of mural diseases that we often encounter, such as flaking, scratch, powdering, artificial cut, glue strain, deep loss, etc.
In order to extend the artistic vitality of murals and maintain their original appearances and delay the impact of natural forces to frescos, conservation and restoration work causes great concern in social, especially for conservation workers. It is the basic guarantee for existing frescos to prolong their artistic form, and is the only way to recover to their normal. In most cases, restoration works on murals generally start from damage analysis to surfaces or deeps themselves. The comprehensive detailed diseases data are the key to help restoration work go smoothly. Digital orthophtoto map is the best electronic form of mural collections to save,
This work is supported by National Natural Science Foundation (NNSF) of China (NO. 40701152 and 40771169).
which can not only display the current situations, but show original appearance before diseases invasion by image processing and virtual restoration. Furthermore, it is also an important data base to acquire mural diseases information.
Currently, it is a common method for mural diseases investigation that edge detection and GIS technology are used to process with painting DOM. In order to get full information about damaged frescos, we normally do as follows: First, process fresco grayscale orthophoto map with edge detection algorithm to generate a binary image. Second, change the opacity of freshly formed edge map to 50% and cover it on primitive colorized orthophoto map. Then trace diseases edges on overlay chart with GIS software. Finally, we can get some statistical data about diseases areas from GIS tables that are automatically generated. On that basis, we can build a decision tree with data mining method to reveal seriousness of different diseases in different painting regions. Edge detection plays an important role in the whole work. The edge graph generated in step 1 can not only position mural diseases, but save time of artificial reading; furthermore, it can regulate vectorising operation and improve precision of statistical data. Currently, there are numerous edge detection algorithms, such as Prewitt [1], Sobel [2], Laplace-Gauss [3], Canny [4], etc. But extracting effects are not ideal by using all kinds of edge detection algorithms due to uniqueness and complexity of paintings’ colors and textures. Thus, K-means Sobel algorithm is presented and experiment results demonstrate that we can get a better effect with new algorithm.
-
II.K- MEANS S OBEL A LGORITHM
-
A. The basic thought
It is known that edge is one of the most basic and important features of image [5]. It can draw the outline of target object and contains a wealth of information [6]. Simply speaking, edge detection is the process of finding edge pixels and generating a black-white binary edge graph, which can reduce redundant information and retain major structure attribute of the graphic. Image segmentation [7] is to subdivide an image into independent regions to make pixels in the same region have similar features, just like gray, texture, etc, but ones in distinct parts have different characteristics. Clustering, an image segmentation method, is the process of organizing objects into different clusters. A cluster is a collection of data objects that are similar to one another within the same cluster and are dissimilar to the objects in other clusters [8].
K-means Sobel algorithm proposed in this paper primarily combined with clustering and edge detection, whose goal is to use clustering method to distinguish mural diseases in painting background and use edge detection method to extract diseases edges. The basic thought is shown in Fig. 1: First, convert a gray image to dataset H whose value domain is from 0 to 255. Then, classify each value to N classes (each class is expressed by its average value) with K-means clustering algorithm to get a dataset J that only contains N kinds of values. Next, convolve dataset J with Sobel formula and eliminate non-edge pixels through setting corresponding threshold to get dataset Z. This dataset only contains two values: 0 and 255. Convert it to graph and we can get a black-white binary edge image.
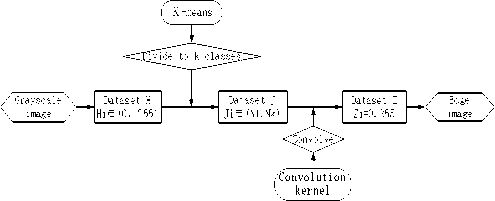
Figure 1. The basic thought of K-means Sobel Edge Detection
-
B. Algorithm steps
Supposing that (m, n) is the coordinate of the image pixels, f (m, n) is the gray value of pixel (m, n), K is the м^
iteration, j iteration.
is the average value of region j after the ith
(1)Choose K initial average values at random, м 1(1 м 21) м?
、 、 …. 、 .
-
(2) In the ith iteration, assign each pixel value to one of K classes (it means K regions) according to the
| f ( m,n) - Д i ) l < l f ( mn ) - M ( i ) l following rules: if l j , let (m,
Q i
n) ∈ l , that is, assign each pixel value to its nearest class.
-
(3) For each class, update its average value:
м ji + 1) = E f ( m , n )
N j ( m , n ) e Q j ) ( i )
N. Q ( i + 1)
Where j is amount of pixels of class j .
M(i+1) M(i)
-
(4) For all classes, if j = j , we carry out step (5), or else we carry out step (2) to go on the next iteration.
-
(5) Retrieve (m, n) with the sequence of l eft-to-rig ht
S (m, n) = Л f2 + f2 . and top-to-bottom and use formula x y to process each grid, where fx = (f(m-1,n-1)+2f(m-1,n)+f(m-1,j+1))-(f(m+1,n-1)+2f(m+1,n)+f(m+1,j+1)).
f fy = (f(m-1,n-1)+2f(m,n-1)+f(m+1,j-1))-(f(m-
1,n+1)+2f(m,n+1)+f(m+1,j+1)). ( 2 )
-
(6) Choose proper threshold T , if S(m, n)> T ,make F(m, n)=255, if S(m, n)< T ,make F(m, n)=0. Finally, export F (m, n). Where F (m, n) is newly formed black-white edge binary image.
K regions in the image,
Qi j is the region j after the ith
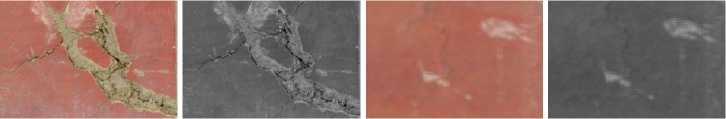
(a) Deep loss
(b) Deep loss (gray)
(c) Mud besmirch
(d) Mud besmirch (gray)
(e) Paint loss
(f) Paint loss (gray)
(g) Glue strain
(h) Glue strain (gray)
Figure 2. Color and gray images of some mural diseases
-
C. Algorithm application
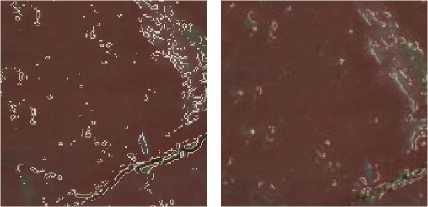
There are various kinds of mural diseases, in which we frequently meet flaking, deep loss (Fig. 2-a, the red is mural background, the yellow is disease), powdering, mud besmirch (Fig. 2-c), paint loss (Fig. 2-e), cracks, scratch, salt efflorescence, glue stain (Fig. 2-g, the black is glue stain, the yellow is paint loss), etc. Every kind of mural diseases has its own unique texture feature and color information, which is expressed as distinct gray values in gray image. Gradation information of some diseases are obviously different from that of background (Figure 2-b, 2-d) and we can easily make a distinction between them. But some are indistinguishable in gray image as their gray values are close to others’ (Fig. 2-h) or to that of painting background (Fig. 2-f). So common edge algorithms are hard to extract edges of these diseases, new algorithm we presented combines edge detection with clustering method. Clustering can divide similar values to one class, so we can better discriminate these diseases by using clustering method through setting proper threshold. Based on this, we can get more comprehensive information about mural diseases edges with edge detection algorithm.
-
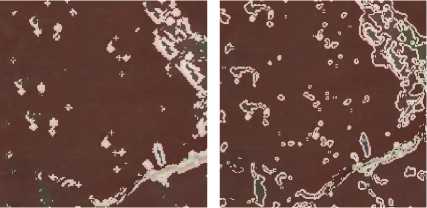
D. Experimental results
Experimental data are all from colorized orthophoto maps of Inner Mongolia huabian Buddha. We gray these colorized images first, and then process them with Prewitt, Sobel, Canny, Laplace-Gauss, Grayscale Morphology and K-means Sobel. Extensive tests are carried out for every edge detection algorithm through setting different thresholds. Next, binary images that have better extracting effects are chosen. Finally, changing their opacities and covering them on primitive colorized orthophoto maps (Fig. 3), we can clearly find that extracting effects of mural diseases edges used by K-means Sobel algorithm are more comprehensive and accurate.
Prewitt Sobel
Laplace-Gauss Canny
Grayscale Morphology K-means Sobel
Figure 3. Overlaying graphs processed by edge detection algorithms
-
E. Algorithms evaluation
It is difficult to assess edge detection algorithm [9], as: First, complexities of practical images lead to different results of edge detection, as all kinds of cases are hard to evaluate. Likewise evaluation results were not representative. Second, some algorithms have parameters, whose selections directly affect detection results, so we could only contrast the algorithms when the parameters are given appropriately. Third, we lack of authoritative performance judgment. Current evaluation methods mostly specific to simple images and even more it is hard to prove their own effectiveness.
Painting images are generally complicated, whose textures appear more complex with the influence of mural diseases. The existing edge detection evaluation methods are not suitable in this respect. In consideration of practical significance of mural diseases investigation, we propose two evaluation criterions: disease recognition percentage and edge continuity.
What we mostly concern about is that how can we identify different kinds of mural diseases all sidedly. A good edge detection algorithm should extract diseases edges as much as possible. Diseases recognition percentage is a new method we proposed to judge the extracting results. It is the ratio between amount of diseases edges extracted by edge detection and that recognized by experts in allusion to the same mural disease in the same gray image (Equation 3).
N=Nb/Nz. (3)
Where N is diseases recognition percentage, Nb is the amount of diseases edges extracted by edge detection; Nz is the amount of diseases edges recognized by experts.
Normally, edge detection algorithms could not extract all diseases form mural gray image. On the one hand, different parameters setting leads to extraordinary diverse effect of edge detection and it is hard to choose absolutely proper parameters , on the other hand, gray values of some diseases in gray image are similar to that of other diseases or painting background and algorithm can not extract edges among them. But diseases found by fresco experts are authoritative, so we regard them as the whole amount of one kind of diseases (greater than or equal to diseases amount detected by edge algorithms). Excellent edge detection algorithm should have higher diseases recognition percentage. The highest percentage is 1, which means this algorithm can extract all diseases edges of a kind, and the lowest is 0, which means none disease can be found.
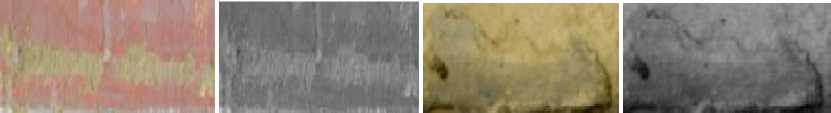
In order to get Nz, we invite mural experts to check up the colorized orthophoto map to identify and record one kind of diseases (Fig. 4-left), then we obtain Nb in binary image on the basis of Nz (Fig. 4-right).Finally, we calculate N and record it in Table 1. We can clearly see that effects of extracting edges of artificial cut, scratch, cracks and mud besmirch are excellent. Each algorithm can almost extract all. But only K-means Sobel algorithm can obtain a higher diseases recognition percentage to glue stain and paint loss (Fig. 5).
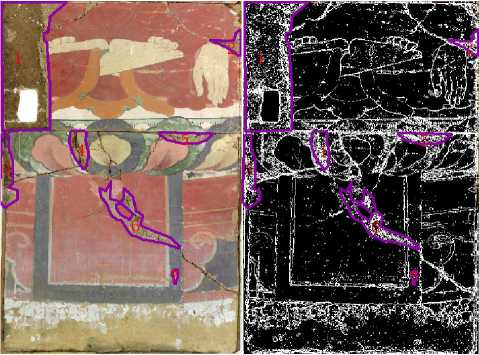
Figure 4. Ways of getting Nz and Nb
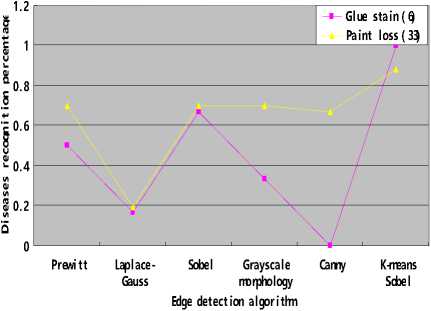
Figure 5. Comparison of diseases recognition percentage
Table 1. Diseases recognition percentage of edge detecion algorithms
|
Edge detection algorithms Mural diseases |
Prewitt |
Laplace-Gauss |
Sobel |
Grayscale morphology |
Canny |
K-means Sobel |
|
Artificial cut ( 2 ) |
100% |
100% |
100% |
100% |
100% |
100% |
|
Scratch ( 5 ) |
100% |
100% |
100% |
100% |
60% |
100% |
|
Cracks ( 12 ) |
100% |
100% |
100% |
100% |
100% |
100% |
|
Deep loss ( 7 ) |
100% |
85.7% |
100% |
100% |
100% |
100% |
|
Glue stain ( 6 ) |
50% |
16.7% |
66.7% |
33.3% |
0% |
100% |
|
Mud besmirch ( 6 ) |
100% |
66.7% |
100% |
100% |
100% |
100% |
|
Paint loss ( 33 ) |
69.7% |
19.4% |
69.7% |
69.7% |
66.7% |
87.88% |
Edge continuity is estimated by visual way
Edge continuity demands that the test results of edge detection are continuous and no breakages in extracted edges. Discontinuous algorithms directly lead to edge crack in image, even error edge connection [5].
qualitatively. The concrete method is that we choose an independent mural disease in image, and then analyze its continuity by visual inspection. Seen from Fig. 6, results gotten by K-means Sobel algorithm is best.
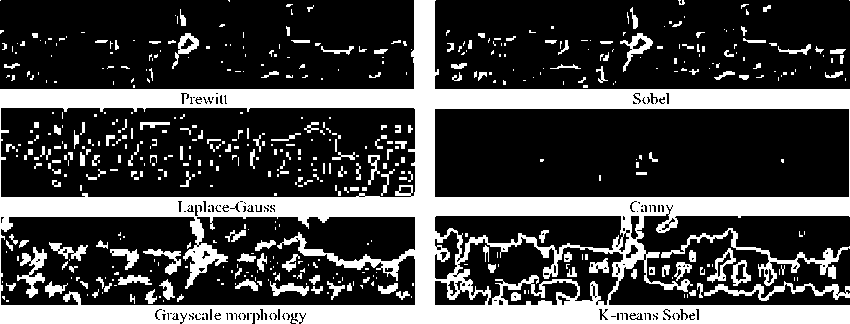
Figure 6. Comparison of edge continuity
III.DISEASES DECISION TREE GENERATION
Accurate data source are the important basic of data analysis. In the second part of this paper, we have gotten some paintings binary images with K-means Soble algorithm, which contain mural diseases marginal information . Next, we will introduce how to generate a
decision tree about planar mural diseases to reveal seriousness of different diseases in different painting regions from three experimental maps (Fig. 7).
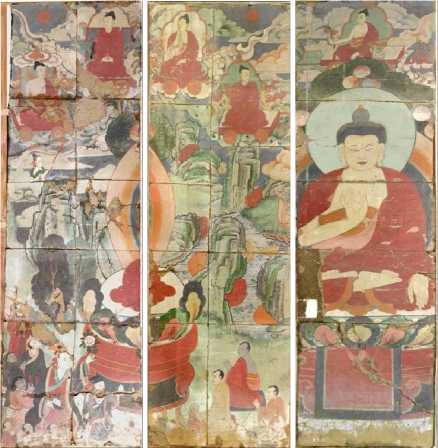
Figure 7 Origintal data of mural diseases investagition
-
A. Edge extraction
First of all, mural DOM is preprocessed with grayscaling. Second, K-means Sobel edge detection algorithm is implemented on the image. Through setting different thresholds, we compare and analyze the experimental results to choose one that has the best edge extracting effect, whose goal is to acquire more comprehensive diseases marginal information in binary images. The feasibility of the new algorithm has been demonstrated in part two of this paper. Then, change the opacity of freshly formed binary edge map to 50% and cover it on primitive colorized orthophoto map. Next, different vector layers are created in accordance with diseases types. We use colorized mural DOM to judge diseases types and trace diseases outlines in corresponding layers on overlay chart with GIS software (Fig. 8).


Figure 8. Vectorizing process
Finally, we can get statistical data about diseases areas from GIS attribute tables. These tables are what we want to mine diseases information. Seven kinds of planar mural diseases are diagnosed. They are chap, powdering, paint loss, deep loss, glue stain, mud besmirch and flaking. So, twenty-one vector layers, that is, twenty-one attribute tables are totally gotten from 3 original colorize fresco DOM.
-
B. Mural diseases information acquisition
In order to provide important mural diseases information for archaeological conservator, we need to process diseases attribute tables and mine useful knowledge and rules from them. Attribute-oriented induction (AOI) is cited to solve this problem. It is a relational database query-oriented, generalization-based, on-line data analysis technique, which is proposed in 1989 for the first time, and Jiawei Han [8] gave a comprehensive introduction.
The general idea of attribute-oriented induction [8] is to first collect the task-relevant data using a relational database query and then perform generalization based on the examination of the number of distinct values of each attribute in the relevant set of data. The generalization is performed by either attribute removal or attribute generalization (also known as concept hierarchy ascension). Aggregation is performed by merging identical, generalized tuples, and accumulating their respective counts. This reduces the size of the generalized data set. The resulting generalized relation can be mapped into different forms for presentation to the user, such as charts or rules.
-
C. Diseases information processing
Twenty-one attribute tables have been gotten from 3 colorize fresco DOM. These tables mainly contain systematic fields like ID, Shape, Shape_Area, Shape_Length, etc, and some user-created fields, such as Name, Note (Fig. 9). In accordance with the basic thought of AOI, some fields need to be generalized, but other fields that have nothing with the formation of characteristic rules or is not proper to hierarchy ascension need to be removed or ignored. In abovementioned fields, we generalize field Area, but ignore FID, Shape, Name, Shape_Length and Note. The total area of each type of mural disease is calculated by accumulating all values in field Area and recorded in a new table (Table 2).As values in Table 2 are numerical and are hard to further upgrade their conceptual hierarchies, we need to convert them form numerical to enumeration type [10]. That is, we should divide each recorded value to different levels in accordance with the sizes of diseases areas. Hierarchical structure is defined as follows in the light of instructions by mural conservation experts: 0~10000mm2 ∈ Light, 10000~50000 mm2 ∈ Common, above 50000 mm2 ∈ severity. Finally, a generalized relational table about mural diseases in different regions is summarized from Table 2, which is comprised of three fields: Painting, Diseases types and Diseases severities (Table 3).
Table 3. The generalized relation table
|
Exprimental region |
Disease types |
Disease severities |
|
Mural 1 |
Chap |
Slight |
|
Mural 1 |
Powdering |
Serious |
|
Mural 1 |
Paint loss |
Serious |
|
Mural 1 |
Flaking |
Serious |
|
...... |
...... |
...... |
|
Mural 3 |
Glue stain |
Serious |
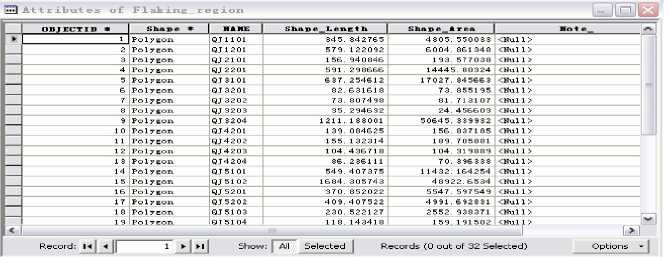
Figure 9. Attribute table about a mural disease
Table 2. Generation result about diseases areas from three paintings ( Unit : mm2 )
|
Chap |
Powdering |
Paint loss |
Flaking |
Mud besmirch |
Deep loss |
Glue stain |
|
|
Mural 1 |
1896.33 |
36769.59 |
71512.90 |
240796.60 |
1950.41 |
52470.15 |
91630.76 |
|
Mural 2 |
461985.36 |
22054.43 |
56068.29 |
0 |
970.54 |
54343.49 |
17420.97 |
|
Mural 3 |
183757.51 |
13447.66 |
75451.34 |
15269.57 |
224.93 |
26684.70 |
120428.75 |
-
D. The Result Show of attribute-oriented induction
The resulting generalized relation table can be mapped into different forms, such as charts or rules. But they are not clear enough to manifest structures of dataset and inherent relationship between the attribute fields. To show severities of different diseases in each painting, we express generalized results as decision tree. Decision tree is a tree structure that is similar to the flow chart, which is normally used for clustering, prediction and classification. There are numerous decision tree algorithms, such as ID3 [11], C4.5 [12], CART [13], SLIQ [14], SPRINT [15].ID3 algorithm is chosen to create a decision tree about diseases severities of mural collections, which is based on Shannon information theory. By way of information gain, attribute is splitted to make the partitioning results contain least information [8].
In the experiment, we take field ‘Diseases types’ and ‘Paintings’ in Table 3 as inputting attribute and field ‘Diseases severities’ as outputting attribute to generate a decision tree in the form of graph (Fig. 10). There must be a path from root node to leaf node in decision tree, and each path corresponds to a rule like ‘if…then’. When rule is formed, each leaf node generates a rule and each division creates a condition in rule. The final leaf node corresponds to the content of ‘then’. Specifically speaking, the rule is expressed as follows: if condition A and condition B and condition C…then conclusion X.
The decision tree about mural diseases is translated to rules. Rules are given as follows:
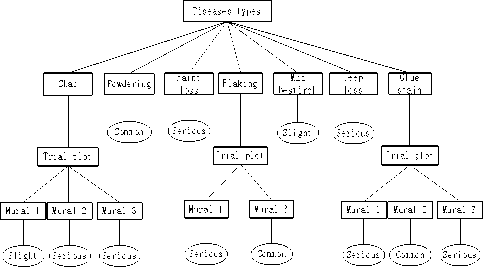
Figure 10. Decision tree about mural diseases severity
Rule 1: if Diseases types =Chap and Trial plot = Mural 1 then Diseases severities =Slight
Rule 2: if Diseases types =Chap and Trial plot = Mural
-
2 then Diseases severities =Serious
Rule 3: if Diseases types =Chap and Trial plot = Mural
-
3 then Diseases severities = Serious
Rule 4: if Diseases types =Powdering then Diseases severities =Common
Rule 5: if Diseases types =Paint loss then Diseases severities =Serious
Rule 6: if Diseases types =Flaking and Trial plot =
Mural 1 then Diseases severities =Serious
Rule 7: if Diseases types = Flaking and Trial plot =
Mural 3 then Diseases severities =Common
Rule 8: if Diseases types = Mud besmirch then
Diseases severities =Slight
Rule 9: if Diseases types = Deep loss then Diseases severities =Serious
Rule 10: if Diseases types = Glue stain and Trial plot = Mural 1 then Diseases severities =Serious
Rule 11: if Diseases types = Glue stain and Trial plot = Mural 2 then Diseases severities =Common
Rule 12: if Diseases types = Glue stain and Trial plot = Mural 2 then Diseases severities =Serious
We can clearly see the severities of diseases invasions in different frescos. Deep loss and paint loss are all serious in three paintings while powdering is common and mud besmirch is slight. Chap and glue stain are serious in 2 frescos. Severities of flaking are variable.
-
IV. C ONCLUSION
This paper proposed a complete set of extracting and analytical process of mural diseases information, which is based on mural digital orthophoto map. Allowing for uniqueness of painting image, K-means Sobel algorithm is presented to extract diseases outlines in fresco images. In consideration of practical significance of mural diseases information acquisition, we give two evaluation criterions to estimate the effectiveness of extracting results—diseases recognition percentage and edge continuity. Form the experiment we can easily find that new algorithm has a better extracting effect. After vectorizing detected results, attribute-oriented inductive method is used to reduce data. As knowledge forms of traditional AOI are usually expressed as diagrams and tables, which are hard to exhibit the in-depth knowledge of datasets. A decision tree about severity of mural diseases is established to show different murals damage in different experimental regions. It can not only provide precise and concise disease statistics for murals worker, but provide effective decision support for analyzing diseases distributions, damaged condition and disease mechanism. In addition, the related data generated in the process of disease information extraction and analysis can be used as the basis archives to provide detailed accurate materials for mural diseases investigation and repair.
A CKNOWLEDGMENT
The work described in this paper was substantially supported by an award from the Natural Science Foundation of China (under grant No. 40701152 and 40771169). Thanks to Shuqiang Lv, Yungang Hu, Xiangyu Fu and Guoli Wang for their works in the capturing and processing the data. Thanks to Guo Hong and Chengqian to provides information about mural diseases.Thanks to Gong Yu, Xing Huaqiao and Lu Xin to help me to find mistakes in this paper.
References Extraction and Analysis of Mural Diseases Information Based on Digital Orthophoto Map
- J.M.S.Prewitt. Object Enhancement and Extraction in B.S. Lipkin and A Rosenfeld eds. Picture Processing and Psychohistories, 1970.
- Sobel, Camera Models and Machine Perception Stanford Al,1970,Memo 121.
- D.Marr, E.C.Hildret,”Theory of Edge Detection,” Proe. Roya1 Soe. LondonB, vol.207, pp.187-217, 1980.
- Canny J.A Computation Approach to Edge Detection [J].IEEE-PAML,1986, 8: 679-698.
- F. Bergholm, Edge focusing .IEEE Transactions on Pattern Analysis and Machine Intelligence, 1987, 9 (6): 726-741.
- Youzhou Zeng, Ying Hu, Weiyi Zeng. Comparison of Algorithm of Edge Detection of Digital Image. Journal of Chengdu Aeronautic Vocational &Technical College, 2009, 12(4):69-73
- Yujin Zhang. Image Segmentation. Beijing: Chinese Science Bulletin, 2001
- Jiawei Han, Micheline Kamber.Data Mining: Concepts and Techniques, Morgan Kaufmann Publishers, 2002
- Xue Li. Performance Assessment of Edge Detection Algorithm in Gray Image. Master's Thesis of Shenyang University of Technology, 2007
- David L. Olson, Dursun Delen. Advanced Data Mining Techniques.Springer(March4,2008)
- J.R.Quinlan. Induction of Decision Trees. Machine Learning 1(1):81-106, 1986.
- J.R.Quinlan. C4.5: Progams for Machine Learning. San Mateo,CA: Morgan Kaumfann,1993.
- L.Breiman, L.Friedman and J.H.Olshen et al. Classification and Regression Trees [M]. Belmont,CA: Wadsworth International Group, 1984.
- M.Mehta, R.Agrawal and J.Rissanen. SLIQ: A Fast Scalable Classifier of Data Mining. In Proe. Of the Fifth Int’1Conference on Extending Database Technology, Avignon, France, 1996.
- J.Shafer,R.Agrawal and M.Mehta. SPRINT: A Scable Parallel Classifier of Data Mining. Research report, IBM Almaden Research center, San Jose, Caliofmia, 1996.
