Extraction of Sequence Conservation Features for the Prioritization of Candidate Single Amino Acid Polymorphisms

Author: Jiaxin Wu, Mingxin Gan, Wangshu Zhang, Rui Jiang
Journal: International Journal of Information Engineering and Electronic Business(IJIEEB) @ijieeb
Article in issue: 2 vol.3, 2011.
Free access
Although remarkable success has been achieved by genome-wide association (GWA) studies over the past few years, genetic variants discovered in GWA studies can typically account for only a small fraction of heritability of most common diseases. As such, the identification of multiple rare variants that are associated with complex diseases has been receiving more and more attentions. However, most of the recently developed statistical approaches for detecting association of rare variants with diseases require the selection of functional variants before the successive analysis, making an effective bioinformatics method for filtering out non-relevant rare variants indispensible. In this paper, we focus on a specific type of genetic variants called single amino acid polymorphisms (SAAPs). We propose to prioritize candidate SAAPs for a specific disease according to their association scores that are calculated using a guilt-by-association model with a set of features derived from protein sequences. We validate the proposed approach in a systematic way and demonstrate that the proposed model is powerful in distinguishing disease-associated SAAPs for the specific disease of interest.
Single amino acid polymorphisms, prioritization, guilt-by-association, Euclidean distance, Manhattan distance
Short address: https://sciup.org/15013072
IDR: 15013072
Text of the scientific article Extraction of Sequence Conservation Features for the Prioritization of Candidate Single Amino Acid Polymorphisms
Published Online March 2011 in MECS
Over the past few years, remarkable success has been achieved by genome-wide association (GWA) studies in the discovery of genetic variants that are responsible for human inherited diseases [1], with examples including age-related macular degeneration [2], Diabetes [3], Hypertension [4], and many others [5-7]. Typically, a GWA study is designed to uncover potential associations of genetic variants with observable traits of a disease by examining whether these genetic variants occur in different frequencies between a case population and a control population. To accomplish this, it is often assumed that the etiology of common diseases is arbitrated by commonly occurring genomic variants in a population. This assumption is also known as the common disease-common variant (CD-CV) hypothesis [8, 9]. Nevertheless, recent studies have suggested that such common variants can only explain a small fraction of the heritability of most common diseases [10, 11], and that in general cases, the disease etiology is more likely to be caused collectively by multiple rare variants with moderate to high penetrance, resulting in the alternative common disease-rare variant (CD-VR) hypothesis for GWA studies [12, 13].
Rare variants are different from common variants in many properties, such as the low marginal population attributable risk and the wide range of penetrance. It is therefore quite difficult to uncover genetic effects of rare variants using existing experimental techniques and computational approaches that are developed for common variants. However, with the accelerating advancement of the next generation sequencing technology, it becomes more and more feasible to directly sequence candidate genetic regions or even the whole genome to obtain a huge number of rare variants. Moreover, in order to deal with such a huge number of variants, several statistical methods have been developed to simultaneously identify the association of multiple rare variants with the disease under investigation. These methods include the combined multivariate and collapsing method [8], the cohort allelic sums test approach [14], the weighted-sum statistical analysis [13], and many others [15-17]. Most of these methods use the grouping approach to cluster variants under investigation according to their functions. Though being effective, this approach requires correct classification of functional mutations and is quite sensitive to neutral or un-functional variants. On this scenario, bioinformatics tools or filters are expected to make functional predictions of the rare variants under investigation and accordingly decide which of them should be included in the successive statistical analysis.
As a typical type of genetic variants, nonsynonymous single nucleotide polymorphisms (nsSNPs) that occur in single bases of protein coding sequences lead to single amino acid polymorphisms (SAAPs) in protein sequences. These SAAPs potentially alter structures of proteins, affect functions of proteins, and further cause human diseases [18]. In order to predict potential effects of such SAAPs, bioinformatics methods, such as SIFT [19], PolyPhen [18], KBAC [20], and MSRV [21] have been proposed. These methods typically classify SAAPs that are potentially associated with some diseases against neutral ones that are not associated with any disease from the perspective of binary classification. However, all these methods with such a formulation can only assign a generic “disease” category or a “non-disease” category to SAAPs, and can not specify the disease with which the SAAP may be associated. As such, the classification results of these methods can only provide limited information to practical applications.
To overcome this limitation, in this paper, we formulate the identification of SAAPs that may be associated with a specific disease from a set of candidate SAAPs as a one-class novelty learning problem. More specifically, we define an association score to quantify the strength of association between a query disease and a candidate SAAP, and then we prioritize candidate SAAPs among according to their association scores. We design the scoring method according to the guilty-by-association principle [22], on the basis of the assumption that the disease under investigation is known to be associated with a set of seed SAAPs, who share similar properties. Following this assumption, a candidate SAAP may be the suspicious disease-associated SAAP for the query disease if it bears homogeneous properties with the seed SAAPs of the disease. We derive four features for SAAPs from multiple sequence alignment of protein sequences in which the SAAPs occur, and we use two popular distance measures (the Euclidean distance and the Manhattan distance) to calculate the dissimilarity between two SAAPs in the feature space. We demonstrate the effectiveness and predictive power of our approach via comprehensive large-scale leave-one-out cross-validation experiments. Results show that our approach is effective in identifying relationships between SAAPs and diseases, with the Manhattan distance achieving the most precise prediction results.
-
II. M ATERIALS AND M ETHODS
-
A. Data Sources
We carry out the proposed studies by taking advantage of two widely used databases in proteomics: the Swiss-Prot database [23] and the Pfam database [24].
The Swiss-Prot database [23] provides detailed annotations of known SAAPs. In version 2010_10 (released on October 5, 2010) of this database, a total of 62,430 SAAPs occurring in 12,401 human proteins are collected. Each SAAP is annotated as “Disease,” “Polymorphism,” or “Unclassified.” In this paper, we refer to SAAPs with “Disease” annotations as disease SAAPs and those with “Polymorphism” annotations as neutral SAAPs . For disease SAAPs , the names and the OMIM accession numbers of the diseases to which the SAAPs are associated are further provided.
The Pfam [24] database collects curated and predicted protein families and domain annotations. This database is further split into a Pfam-A part that includes curated protein families and a Pfam-B part that includes predicted protein families. In version 24.0 (released in October 2009) of this database, there are a total of 11,912 protein families included in the Pfam-A part.
In our studies, we focus on SAAPs that occur in protein domains, for the purpose of utilizing information of protein families to obtain multiple sequence alignment of protein sequences. By combining the annotations of SAAPs in the Swiss-Prot database and domain annotations in the Pfam database, we finally collect 13,735 neutral SAAPs and 14,511 disease SAAPs that are associated with 1,575 diseases.
-
B. Sequence Conservation Features
We derive four sequence conservation features from protein multiple sequence alignment. Given a SAAP occurring in a protein, we extract its homologous proteins form the Pfam database to obtain the multiple sequence alignment. We then look at the column of the alignment that corresponds to the position at which the polymorphism occurs, and we calculate the conservation score of the original amino acid (Feature 1) as the relative frequency of occurrence of the original amino acid. Similarly, we calculate the conservation score of the substituted amino acid (Feature 2) as the relative frequency of occurrence of the substituted amino acid [21, 25, 26].
The above two conservation scores do not take the background, i.e., frequencies of occurrence of amino acids in all human protein, into consideration. However, it is known that different types of amino acids do occur at different frequencies in known human proteins. For example, if we count the frequencies of occurrence of all twenty types of amino acids in human proteins that are collected in the Swiss-Prot database, we can obtain the following Table I, which shows that the twenty types of amino acids do, indeed, occur at quite different frequencies. Considering this fact, we further propose the following two conservation ratios by taking the background frequencies of amino acids into consideration.
TABLE I.
F REQUENCY OF 20 TYPES OF AMINO ACIDS IN HUMAN PROTEINS
|
Amino acid |
Frequency (%) |
Amino acid |
Frequency (%) |
|
A |
8.28 |
M |
2.43 |
|
C |
1.36 |
N |
4.06 |
|
D |
5.46 |
P |
4.69 |
|
E |
6.77 |
Q |
3.94 |
|
F |
3.86 |
R |
5.54 |
|
G |
7.10 |
S |
6.52 |
|
H |
2.27 |
T |
5.33 |
|
I |
5.99 |
V |
6.88 |
|
K |
5.85 |
W |
1.08 |
|
L |
9.67 |
Y |
2.92 |
First, we obtain the conservation ratio of the original amino acid in a SAAP (Feature 3) by dividing the relative frequency of occurrence of the original amino acid by the relative frequency of occurrence of the same type of amino acid in the background. Second, we obtain the conservation ratio of the substituted amino acid (Feature 4) by dividing the relative frequency of occurrence of the substituted amino acid by the relative frequency of occurrence of the same type of amino acid in the background.
-
C. Guilt-by-association Model
Given a query disease of interest, a set of seed SAAPs that are known to be associated with the query disease, and a set of candidate SAAPs whose associations with the disease need to be inferred, we adopt a guilt-by-association model [22] to prioritize the candidate SAAPs according to their strength of associations with the query disease of interest. The basic assumption of this model is that SAAPs that are associated with the same disease should have similar conservation properties. Therefore, we can calculate for each candidate SAAP an association score by considering the similarity of the candidate SAAP with each of the seed SAAPs and then summarize all similarities to obtain a score that indicates the strength of association of the candidate SAAP to the query disease.
For a single sequence conservation feature, we can evaluate the dissimilarity between two SAAP using the absolute value of the difference in their features, i.e., d (x, У) =| fx - fy\ .
Then, for a set of single sequence conservation features as a feature vector, we can obtain the dissimilarity between two SAAPs using some function to calculate distance between their feature vectors.
The first distance function we propose to use is the Euclidean distance , which is considered as the most traditional and ordinary way to compare two points in the feature space. The mathematical formulation of the Euclidean distance between two SAAPs with feature vectors x and y is denoted as follow:
d ( x,y ) = Jf . ( X i - y,) 2 .
-
V i = 1
The second distance function is the Manhattan distance , which is also known as the rectilinear distance, L 1 distance, city block distance, or taxicab distance. The Manhattan distance is the sum of the lengths of the projections of the line segment between the points onto the coordinate axes [27]. The mathematical formulation of the Euclidean distance between two SAAPs with feature vectors x and y is denoted as follow:
d ( x,y ) = ]f k - y i l.
i = 1
According to the literature [27], the advantage of the Manhattan over the Euclidean distance is that it weighs slight differences more heavily.
Then, for the query disease D that has a set of seed SAAPs associated, the dissimilarity between a candidate SAAP with feature vector x and the query disease can be obtained as
Z d ( x ) = f d ( x,x ‘ ) x 'e S ( D )
where S D is the collection of all seed SAAPs for the query disease D .
With the dissimilarity between each of the candidate SAAPs and the query disease being calculated, we can further rank the candidate SAAPs according to their dissimilarity scores to obtain a rank list. Alternatively, we can define the reciprocal of the dissimilarity between a candidate SAAP and the query disease as an association score that indicates the strength of association between the SAAP and the disease, and then prioritize the candidate SAAPs according to their association scores.
-
D. Validation Methods and Evaluation Criteria
We adopt a series of large-scale leave-one-out crossvalidation experiments to assess the validity of the proposed approach in recovering known associations between diseases and SAAPs. Specifically, in each validation run, we select an association between a disease and a seed SAAP that is known to be associated with the disease, assume that the association relationship is unknown, and then prioritize the SAAP against a set of control SAAPs based on their association scores. According to the polymorphism SAAPs derived from the Swiss-Prot database, we choose the following four control groups:
-
(1) 99 randomly selected polymorphism SAAPs;
-
(2) 999 randomly selected polymorphism SAAPs;
-
(3) 9999 randomly selected polymorphism SAAPs;
-
(4) All 13,735 polymorphism SAAPs.
For every seed SAAP of every disease, we perform such validation run, and accordingly, we can obtain a series of ranking lists.
To soundly evaluate the performance of the proposed prioritization method, we calculate two criteria with these ranking lists. The first criterion is termed mean rank ratio of seed SAAPs (MRR), which is the average rank ratio of all seed SAAPs. The second criterion is termed AUC score (the area under the receiver operating characteristic (ROC) curve), which is obtained as follows. At a certain rank threshold, we define the sensitivity as the proportion of seed SAAPs ranked above the threshold, and the specificity as the fraction of control SAAPs ranked below the threshold. By varying the threshold, we are able to obtain a series of sensitivities and specificities, and further plot a ROC curve. The area under this curve is then defined as the AUC score.
The above two criteria can be used to evaluate the proposed method in recovering known associations for a single query disease. In this case, we focus on the series of ranking lists obtained using seed SAAPs for the query disease. These criteria can also be used to evaluate the proposed method in recovering known associations for all diseases. In this situation, we focus on the series of ranking lists obtained for all seed SAAPs.
As seed SAAPs that are associated with the same disease should be more similar than polymorphism SAAPs in the control group, it is expected that all the seed SAAPs should rank at the top. Therefore, we expect low mean rank ratios and high AUC scores for a good prioritization method.
Ш . Results
-
A. Validation of the Model
We focus on diseases that have at least 4 seed SAAPs in the Swiss-Prot annotations, and we obtain a total of 13,138 associations between 723 diseases and 13,138 SAAPs. We then perform for each of these associations a
Mean rank ratio
Mean rank ratio
Mean rank ratio
Mean rank ratio
0.0 0.2 0.4 0.6 0.8 1.0
Mean rank ratio
Mean rank ratio
Mean rank ratio
Mean rank ratio
Mean rank ratio
Mean rank ratio
Mean rank ratio
Mean rank ratio
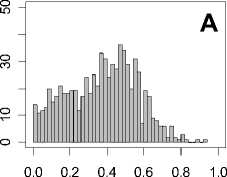
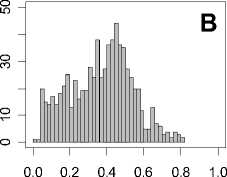
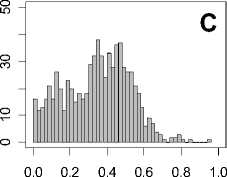
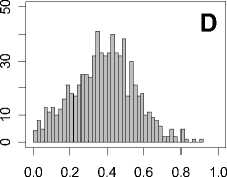
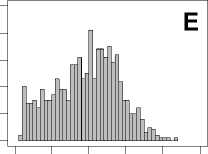
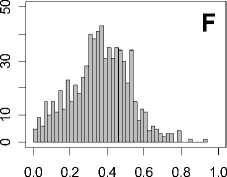
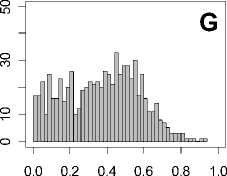
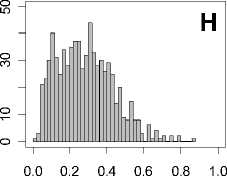
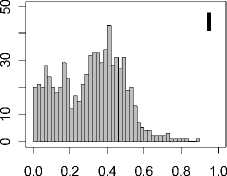
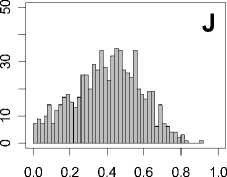
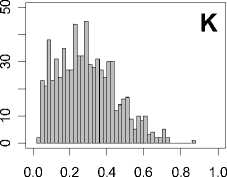
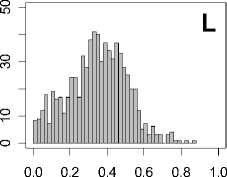
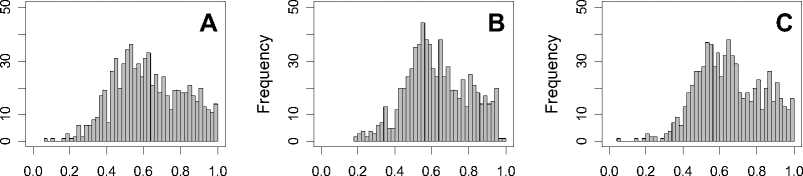
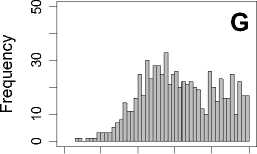
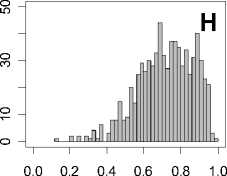
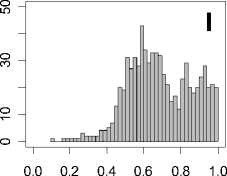
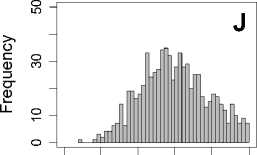
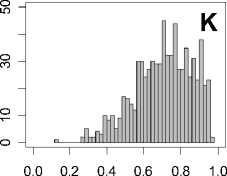
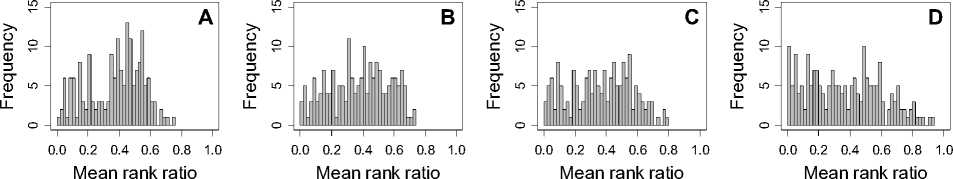
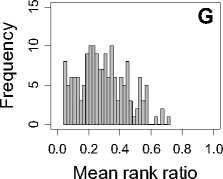
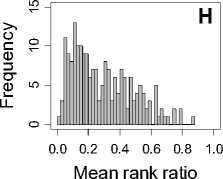
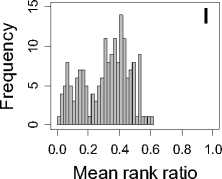
Figure 1. Distribution of mean rank ratios of all 723 diseases, against all 13735 polymorphism nsSNPs. A-F: Euclidean distance. G-L: Manhattan distance. A, G: Feature 1. B, H: Feature 2. C, I: Feature 1 and 2. D, J: Feature 3. E, K: Feature 4. F, L: Feature 3 and 4.
leave-one-out cross-validation experiment against each of the four control groups, using either the Euclidian distance or the Manhattan distance measure. We further evaluate the performance of the proposed method for each of the 723 diseases, in terms of the mean rank ratio of seed SAAPs and the AUC score, and we summarize the results in Figures 1 and 2, respectively. In each figure, we further present six situations:
-
(1) Feature 1: using the conservation score of the original amino acid;
-
(2) Feature 2: using the conservation score of the substituted amino acid;
-
(3) Features 1 and 2: using a vector that is composed of the two conservation scores;
-
(4) Feature 3: using the conservation ratio of the original amino acid to the background situation;
-
(5) Feature 4: using the conservation ratio of the
substituted amino acid to the background situation;
-
(6) Features 3 and 4: using a vector composed of the two conservation ratios.
From these figures, we can see that for a large proportion of diseases, the seed SAAPs can be ranked at top 50% among the control groups. In other words, we can recover relationships between a large number of known SAAPs and their associated diseases. Taking Figure 1 (H) as an example, we calculate that for 662 (91.56%) diseases, the mean rank ratios are less than 50%; for 236 (32.64%) diseases, the mean rank ratios are less than 20%; for 78 (10.79%) diseases, the mean rank ratios are less than 10%. We further run Wilcoxon signed rank tests against the alternative hypothesis that the median of the mean rank ratios is less than 50% (random situation), and we find that no matter which features are used, the p -value is less than 2.2 x 10 -1 . In other words, it is
AUC score AUC score AUC score
0.0 0.2 0.4 0.6 0.8 1.0 0.0 0.2 0.4 0.6 0.8 1.0 0.0 0.2 0.4 0.6 0.8 1.0
AUC score AUC score AUC score
0.0 0.2 0.4 0.6 0.8 1.0
AUC score
AUC score
AUC score
0.0 0.2 0.4 0.6 0.8 1.0
AUC score
AUC score
0.0 0.2 0.4 0.6 0.8 1.0
AUC score
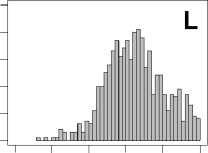
Figure 2. Distribution of AUC scores of all 723 diseases, against all 13735 polymorphism nsSNPs. A-F: Euclidean distance. G-L: Manhattan distance. A, G: Feature 1. B, H: Feature 2. C, I: Feature 1 and 2. D, J: Feature 3. E, K: Feature 4. F, L: Feature 3 and 4.
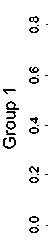
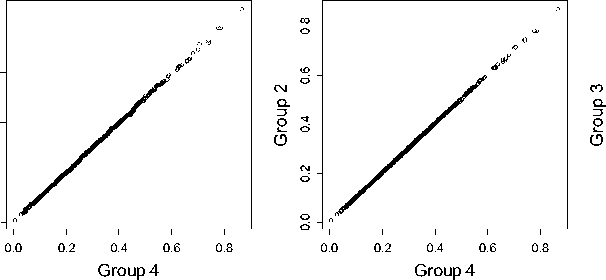
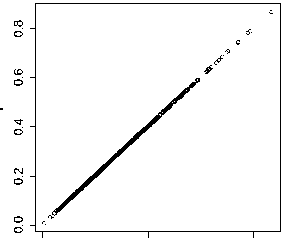
Figure 3. QQ-plots of different control groups.
0.0
0.2 0.4 0.6 0.8
Group 4
statistically significant that our method can effectively prioritize seed SAAPs among the top of candidate SAAPs.
-
B. Comparison between Control Groups
We then study the influence of the number of polymorphism SAAPs in the control group, for the purpose of understanding whether the proposed method is robust to the selection of the control set. To accomplish this, we fix the conservation feature (i.e. Feature 2) and the distance measure (i.e. the Manhattan distance), repeat the leave-one-out cross-validation experiment on each of the four control groups. We then run three Wilcoxon rank sum tests against the alternative hypothesis that mean rank ratios obtained using control group 4 (all polymorphism SAAPs) have a location shift over those using other control groups. We obtain three p -values, 0.5627 for group 1, 0.9689 for group 2, and 0.9946 for group 3, which testify that little difference is made between these ranking lists calculated under different control groups. To make the results more visually, we draw three QQ-plots to compare these control groups, shown in Figure 3. It is not surprising to obtain such results, because control groups 1 to 3 are just random samples from control group 4. We therefore conclude that the random sampling procedure in generating control groups does not bring bias into the evaluation of the prioritization method.
-
C. Comparison between Similarity Measures
Complying with the guilt-by-association model, we measure the similarity between two SAAPs in the feature space using two distance functions: the Euclidean distance and the Manhattan distance. Obviously, we want to find out the more precise measure for our prediction model. To accomplish this, we calculate the mean and standard deviation of the mean rank ratio using for each of the features, using either the Euclidean distance or the Manhattan distance, and we present the results in Table II. From this table, we can observe that the mean values of the mean rank ratios given by the Manhattan distance tend to be smaller in the leave-one-out cross-validation than those give by the Euclidean distance. Meanwhile, the standard deviation values given by the Manhattan distance are comparably similar to those given by the Euclidean distance. To further elucidate this observation, we run six Wilcoxon rank sum tests against the alternative hypothesis that mean rank ratios obtained using the Euclidean distance have a positive location shift over those using the Manhattan distance for the six situations mentioned above, and the results are also summarized in Table II. It is therefore clearly to see that the Manhattan distance measure is more suitable in measuring the similarity between two SAAPs, especially for features 2 and 4.
-
D. Comparison between Conservation Features
From Figure 1 and Table II, we may conclude that mean rank ratios under the Manhattan distance seem to be smaller in the leave-one-out cross-validation when Feature 2 is used. We can also see that the performance of our model with the two conservation scores are better than the performance of our model with the corresponding conservation ratios, which indicates that considering the background frequencies of amino acids may decrease the discriminative power for uncovering the potential relationship between disease SAAPs and the relevant disease. To further testify these observations, we
TABLE II.
C OMPARISON RESULTS BETWEEN THE TWO SIMILARITY MEASURES
-
E. Effect of Number of Seeds
-
1) Dataset 1 includes 177 diseases, and the number of seed SAAPs ranges from 20 to 260;
-
2) Dataset 2 includes 182 diseases, and the number of seed SAAPs ranges from 10 to 19;
-
3) Dataset 3 includes 168 diseases, and the number of seed SAAPs ranges from 6 to 9;
-
4) Dataset 4 includes 196 diseases, and the number of seed SAAPs ranges from 4 to 5.
0.0 0.2 0.4 0.6 0.8 1.0
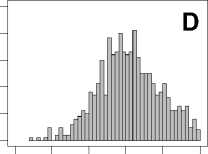
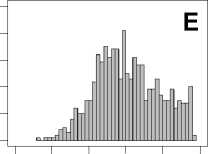
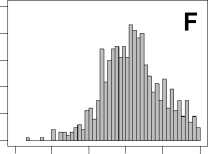
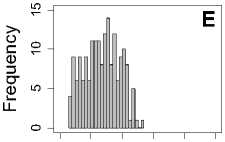
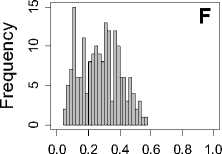
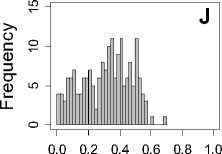
The comparison results are given in Figure 4, from which we can see that the histogram results show different mean rank ratios distributions according to the change of the dataset and feature. By calculating the mean value and standard deviation of mean rank ratios for every dataset under a certain feature set, we find little difference for the mean value of mean rank ratios under different datasets, however, the standard deviation of mean rank ratios is enlarging quickly along with reduced
Mean rank ratio
Mean rank ratio
Mean rank ratio
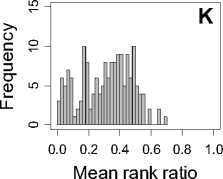
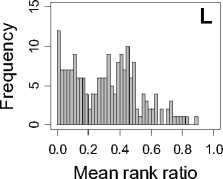
Figure 4. The histograms result of mean rank ratios for different datasets. A,E,I: for Dataset 1. B,F,J: for Dataset 2. C,G,K: for Dataset 3. D,H,L: for Dataset 4. A-D: Feature 1. E-H: Feature 2. I-L: Feature 1and 2.
TABLE Ш .
P REDICTION PERFORMANCES FOR DISEASE ( MIM:143890)
|
Condition |
99 Polymorphism nsSNPs (%) |
999 Polymorphism nsSNPs (%) |
9999 Polymorphism nsSNPs (%) |
All Polymorphism nsSNPs (%) |
|
|
Feature 1 |
19.51 ± 2.72 |
19.15 ± 0.86 |
19.30 ± 0.10 |
19.26 |
|
|
Euclidean Feature 2 |
45.85 ± 4.71 |
44.84 ± 1.13 |
44.82 ± 0.03 |
44.81 |
|
|
Mean |
Features 1and 2 |
17.52 ± 2.54 |
18.99 ± 0.86 |
18.75 ± 0.09 |
18.71 |
|
Rank |
|||||
|
Ratio |
Feature 1 |
13.88 ± 1.76 |
14.85 ± 0.68 |
14.79 ± 0.09 |
14.70 |
|
Manhattan Feature 2 |
20.42 ± 2.01 |
19.37 ± 0.77 |
19.46 ± 0.10 |
19.55 |
|
|
Features 1and 2 |
13.50 ± 1.29 |
14.06 ± 0.46 |
14.19 ± 0.06 |
14.16 |
|
|
Feature 1 |
81.04 ± 2.77 |
80.90 ± 0.86 |
80.70 ± 0.10 |
80.73 |
|
|
Euclidean Feature 2 |
54.09 ± 4.80 |
55.15 ± 1.13 |
55.17 ± 0.03 |
55.19 |
|
|
AUC |
Features 1and 2 |
83.11 ± 2.58 |
81.07 ± 0.86 |
81.25 ± 0.09 |
81.29 |
|
score |
Feature 1 |
86.78 ± 1.74 |
85.21 ± 0.68 |
85.21 ± 0.09 |
85.22 |
|
Manhattan Feature 2 |
80.03 ± 2.03 |
80.67 ± 0.78 |
80.54 ± 0.10 |
80.45 |
|
|
Features 1and 2 |
87.15 ± 1.27 |
86.01 ± 0.45 |
85.81 ± 0.06 |
85.85 |
amount of known seed SAAPs. On that scenario, we can conclude that our approach becomes more sensitive to the stability of the conservativity of the disease when there are little available seed SAAPs. If the disease possesses strong conservative character and can be accurately pictured by only a few seed SAAPs, the approach may perform outstandingly to measure the casual relationship between new candidate SAAP and the disease; on the contrary, if the disease does not have a stable conservative character, it is quite difficult to use conservation scores extracted from few seed SAAPs to construct a well-performed prediction model. In a word, the model may have better prediction results when there are enough seed SAAPs (more than 5 seed SAAPs) to capture the characters of the diseases.
-
F. Case studies
Making use of guilt-by-association model to formulate the problem of prioritizing candidate SAAPs, we aim at finding disease-related SAAPs for the query disease, and accordingly promoting the detection of potential functional rare variants in successive association studies. We apply the proposed method with Feature 1and 2 and the Manhattan distance measure for some specific diseases, such as Familial hypercholesterolemia (FH) [MIM: 143890], we obtain the overall MRR=14.16% and AUC=85.85% (shown in Table Ш ). According to the ranking results, we can thus get the top five significant disease-associated SAAPs, which are D579Y, P608S, D221Y, D224V, and D221G. All of these SAAPs belong to gene LDLR and rank top 140 among 13736 SAAPs (less than 1.00%). These results are just in accordance with some previously published research works [28-30], which point out that FH results from defective low-
- density lipoprotein receptor (LDLR) activity, mainly due to LDLR gene defects.
We also study some common complex diseases, such as breast cancer (BC) [MIM: 114480]. It was found in the middle of 1990s that genetic variants occurring in BRCA1 or BRCA2 may significantly raise the odds of developing breast cancer [31]. In our study, the top 5 variants that are predicted to be associated with breast cancer are T826K in gene BRCA1 , T2515I in gene BRCA2 , S2072C in gene BRCA2 , H888Y in gene BRCA1 , and G960D in gene BRCA1 , and they all rank top 1000 among 13736 SAAPs (smaller than 6.74%).
W. C ONCLUSONS
In this paper, we model the problem of distinguishing disease-associated SAAPs against neutral ones for specific types of diseases as a prioritization problem, and we solve this problem using a guilt-by-association model. We implement our method using two distance measures with four control groups on the basis of four conservative features drawn only from multiple sequence alignments. We demonstrate that the method is effective in ranking SAAPs that are responsible for specific diseases among the top of candidates. We also analyze the effects of different number of control samples, different distance measures, different features, and different number of seed SAAPs known to be associated with the query diseases.
Certainly, there are several limitations of the proposed approach. First, we use the Pfam multiple sequence alignments to extract conserved protein domains for the query protein sequence. As a result, we are limited to the mutations occurring in known protein domains. This limitation can be overcome by using some other multiplesequence alignment methods, such as BLAST [32], PSI-BLAST [33], COBALT [34]. Second, we currently use only the four conservation scores to construct our prediction model. In our future studies, we will combine some useful information such as the physicochemical characteristics of amino acids, or the structure information of proteins to form a more comprehensive feature set. Finally, our approach is limited to SNPs found in protein coding regions. However, mutations in other genome regions such as the transcriptional-factor binding sites, promoter regions, or introns are also known to cause diseases. Further studies are needed for these mutations.
A CKNOWLEDGMENT
This work was partly supported by the Natural Science Foundation of China (60805010, 60928007, 60934004), Tsinghua University Initiative Scientific Research Program, Tsinghua National Laboratory for Information Science and Technology (TNLIST) Cross-discipline Foundation.
References Extraction of Sequence Conservation Features for the Prioritization of Candidate Single Amino Acid Polymorphisms
- Robinson R, "Common disease, multiple rare (and distant) variants," PLoS Biol, vol. 8, 2010: e1000293.
- Naoshi K, Shigeru H, Shin‐ichi K, and Akira N, "Positive association of common variants in CD36 with neovascular age‐related macular degeneration," Aging, February 2009, vol. 1. No. 2.
- Liana KB and Jose CF, "The genetics of type 2 diabetes: what have we learned from GWAS?" Ann. N.Y. Acad. Sci, 1212 (2010), pp. 59–77.
- Adeyemo A, Gerry N, Chen G, Herbert A, Doumatey A, et al., "A Genome-Wide Association Study of Hypertension and Blood Pressure in African Americans," PLoS Genet 5(7), 2009: e1000564. doi:10.1371/journal.pgen.1000564.
- Marian B, Christa N, H. Eka DS, et al, "Genome-wide association study (GWAS)-identified disease risk alleles do not compromise human longevity," PNAS October 4, 2010, doi: 10.1073/pnas.1003540107 .
- Eleftherohorinou H, Wright V, Hoggart C, Hartikainen AL, Jarvelin MR, Balding D, Coin L, Levin M.," Pathway analysis of GWAS provides new insights into genetic susceptibility to 3 inflammatory diseases," PLoS One. 2009 Nov 30;4(11):e8068.
- Parkes M, Barrett JC, Prescott NJ, Tremelling M, Anderson CA,et al , " Sequence variants in the autophagy gene IRGM and multiple other replicating loci contribute to Crohn's disease susceptibility," Nat Genet. 2007 Jul;39(7):830-2. Epub 2007 Jun 6.
- Li B, Leal SM, "Methods for detecting associations with rare variants for common diseases: application to analysis of sequence data," Am J Hum Genet, vol. 83, pp. 311-321, 2008.
- Gaurav B, Vikas B, Olivier H, Nicholas J, Erik J, Kelly F, Vineet B., "A Covering Method for Detecting Genetic Associations between Rare Variants and Common Phenotypes," PLoS Comput Biol, vol. 6(10), 2010.
- Bentley DR, "Whole-genome re-sequencing. Curr Opin Genet Dev,"16:545–552, 2006.
- Bodmer W, Bonilla C, "Common and rare variants in multifactorial susceptibility to common diseases," Nat Genet 40:695–701, 2008.
- Xiong M, Zhao J, Boerwinkle E, "Generalized T2 test for genome association studies," Am J Hum Genet, vol. 70, pp. 1257-1268, 2002.
- Bo EM and Sharon RB, "A groupwise association test for rare mutations using a weighted sum statistic," PLoS Genet.,vol. 5(2), 2009.
- Morgenthaler S, Thilly WG, "A strategy to discover genes that carry multi-allelic or mono-allelic risk for common diseases: A cohort allelic sums test (CAST)," Mutat Res, 615:28-56, 2007.
- Haller G, Torgerson DG, Ober C, Thompson EE, "Sequencing the IL4 locus in African Americans implicates rare noncoding variants in asthma susceptibility, " J Allergy Clin Immunol, 2009, 124:1204-1209.e9.
- Ji W, Foo JN, O’Roak BJ, Zhao H, Larson MG, et al., "Rare independent mutations in renal salt handling genes contribute to blood pressure variation," Nat Genet, 40:592-599, 2008.
- Kotowski I, Pertsemlidis A, Luke A, Cooper R, Vega G, Cohen J, Hobbs H, "A Spectrum of PCSK9 Alleles Contributes to Plasma Levels of Low-Density Lipoprotein Cholesterol," Am J Hum Genet, 78:410-422, 2006.
- Ramensky V, Bork P, Sunyaev S, "Human non-synonymous SNPs: server and survey," Nucl Acids Res, vol. 30, pp. 3894-3900, 2002.
- Ng PC, Henikoff S, "SIFT: Predicting amino acid changes that affect protein function," Nucl Acids Res, vol. 31, pp. 3812-3814, 2003.
- Liu DJ, Leal SM, "A novel adaptive method for the analysis of next-generation sequencing data to detect complex trait associations with rare variants due to gene main effects and interactions," PLoS Genet, vol. 6: e1001156, 2010.
- Jiang R, Yang H, Zhou L, Kuo CC, Sun F, et al., "Sequence-based prioritization of nonsynonymous single-nucleotide polymorphisms for the study of disease mutations," Am J Hum Genet, vol. 81, pp.346-360, 2007.
- Altshuler D, Daly M, Kruglyak L, "Guilt by association," Nat Genet, vol. 26, pp.135-137, 2000.
- Consortium TU, "The Universal Protein Resource (UniProt) in 2010," Nucl Acids Res, vol. 38, pp. D142-148, 2010.
- Finn RD, Mistry J, Schuster-Bockler B, Griffiths-Jones S, Hollich V, et al., "Pfam: clans, web tools and services," Nucl Acids Res, vol. 34, pp. D247-251, 2006.
- Wu J, Zhang W, Jiang R, "Comparative study of ensemble learning approaches in the identification of disease mutations," BMEI 2010.
- Jiang R, Yang H, Sun F, Chen T, "Searching for interpretable rules for disease mutations: a simulated annealing bump hunting strategy," BMC Bioinformatics, vol. 7, pp.417, 2006.
- Stenström P, "High performance embedded architectures and compilers", third international conference, HiPEAC 2008, Göteborg, Sweden, January 27-29, 2008 : proceedings. Berlin ; New York: Springer. xiii, pp. 400.
- Bourbon M, Duarte MA, Alves AC, Medeiros AM, Marques L, et al., "Genetic diagnosis of familial hypercholesterolaemia: the importance of functional analysis of potential splice-site mutations," J Med Genet , vol. 46, pp.352-357, 2009.
- Taylor A, Tabrah S, Wang D, Sozen M, Duxbury N, et al. , "Multiplex ARMS analysis to detect 13 common mutations in familial hypercholesterolaemia," Clin Genet, vol. 71, pp. 561-568.
- Humphries SE, Neely RD, Whittall RA, Troutt JS, Konrad RJ, et al., "Healthy individuals carrying the PCSK9 p.R46L variant and familial hypercholesterolemia patients carrying PCSK9 p.D374Y exhibit lower plasma concentrations of PCSK9," Clin Chem, vol. 55, pp.2153-2161, 2009.
- DNA Mutation Diseases, "DNA Mutation Diseases," http://wwwexplorednacouk/dna-mutation-diseaseshtml.
- Altschul SF, Gish W, Miller W, Myers EW & Lipman DJ, "Basic local alignment search tool, " J. Mol. Biol., vol. 215, pp.403-410,1990.
- Altschul SF, Madden T, Schaffer A, Zhang J, Zhang Z, Miller W, Lipman D, "Gapped BLAST and PSI-BLAST: a new generation of protein database search programs, " Nucl Acids Res., vol. 25, pp. 3389–3402,1997.
- Jason SP and Richa A, "COBALT: constraint-based alignment tool for multiple protein sequences," Bioinformatics, vol. 23, pp. 1073–1079,2007.
