Extractive based text summarization using k-means and TF-IDF

Author: Rahim Khan, Yurong Qian, Sajid Naeem
Journal: International Journal of Information Engineering and Electronic Business @ijieeb
Article in issue: 3 vol.11, 2019.
Free access
The quantity of information on the internet is massively increasing and gigantic volume of data with numerous compositions accessible openly online become more widespread. It is challenging nowadays for a user to extract the information efficiently and smoothly. As one of the methods to tackle this challenge, text summarization process diminishes the redundant information and retrieves the useful and relevant information from a text document to form a compressed and shorter version which is easy to understand and time-saving while reflecting the main idea of the discussed topic within the document. The approaches of automatic text summarization earn a keen interest within the Text Mining and NLP (Natural Language Processing) communities because it is a laborious job to manually summarize a text document. Mainly there are two types of text summarization, namely extractive based and abstractive based. This paper focuses on the extractive based summarization using K-Means Clustering with TF-IDF (Term Frequency-Inverse Document Frequency) for summarization. The paper also reflects the idea of true K and using that value of K divides the sentences of the input document to present the final summary. Furth more, we have combined the K-means, TF-IDF with the issue of K value and predict the resulting system summary which shows comparatively best results.
Summarization, Extractive Summary, TF-IDF, Clustering, K-Means
Short address: https://sciup.org/15016176
IDR: 15016176 | DOI: 10.5815/ijieeb.2019.03.05
Text of the scientific article Extractive based text summarization using k-means and TF-IDF
Published Online May 2019 in MECS
The huge amount of information in the form of textual data or textual corpus on the internet is massively increasing and gigantic quantity of other types of data (images, audio, video, etc.) which are freely available online on the internet become more widespread that is accessible with a single click to an ordinary client user. The technology that enables humans to interact with the machine in a smooth way is HLT (Human Language Technology) which is primarily based on natural communication skills. But as we know that the size of data is expanding and the average expansion rate anticipated by the analysts doubles every 20 months it is very difficult to cope with the massive data [1, 2, 3, 4]. More precisely the phrase text summarization that fundamentally relies on achievement which is the contraction of one large text documents in a proper way to discharge redundant information. Also, recapture the useful and consistent information from text for compression and rigid variant which may easily understood and time conserving while echoing the leading concept of the explained subject in the text document with semantics. It is one of the keen research topics for NLP (natural language processing) and information retrieval. The classification of text summarization is subjected to Abstractive and Extractive type of summarization. The extractive type refers to the process in which we focus on selecting meaningful information in sentence or paragraph from within the primary document and link them in shorter form. While for the abstractive type it is required to understand the elemental image discussed in the document and then precisely explain that key concept using a fair clear natural language. Furthermore, the techniques can be grouped as informative and inductive summarization which reserve about twenty percent and five percent of summary for the original given passage respectively. Numerous applications are using text summarization that’s why the practitioners required a means for generating the summaries and provide the privilege for a decision that excluding demand of reading the whole document and also parallel reliable enough in detailing central ideas. Multi documents summarization is used by newsgroups for clustering and summarizing reports of distinct Media. But the overall undertaken process need reasonable NLP techniques. Primarily this paper focuses on experiments for extractive based text summarization using K-Mean with TF-IDF and reflects the idea of finding out true K value after following the approaches such as A) Elbow method. B) Silhouette method. The experimental portion will also show the evaluation and comparison for different K values when using K-means [5, 6, 7, 8, 9, 10].
-
II. Related Work
Rupal Bhargava et al. [1] worked on using sentiment infusion for abstractive based summarization and presented a technique which is graph based. Their way of summarization is not based on the semantic information that’s why it is inadequate to handle sentences having semantic relations.
Elena Lioret. Manuel Palomar. [2] Reviewed the topic of summarization in a very comprehensive way and appraised in depth the schemes from the last few decades.
-
S. A. Babar et al. [5] established experiments on extractive and semantic text summarization using fuzzy logic and semantic approach for performance enhancement.
Vishal Gupta et al. [7] did a survey on the extractive summarization mechanisms and it illustrated selecting imperative sentences relies on linguistic and statistical features of sentences. And they recognized that resultant summary may lead to a shortage of linguistic cohesion if proper use of NLP procedures is missing.
Nikita Munot et al. [9] conducted an evaluative study of multiple methods in the field of text document summary and disclosed the two dominant practices of summarization (extractive and abstractive) and their merits and demerits. They concluded that abstractive summarization is more powerful because of its highly considering the semantics if compared with the extractive method.
Milad Moradi et al. [11] explained and tuned the Bayesian technique text documents summarization. The process with the Bayesian technique undergoes some initial step by mapping given text with UMLS (Unified Medical Language System) concept and onward to the step of selecting important features for classification purpose. Throughout their research, they suggested a range of six distinct approaches for feature selection to recognize the best concept and according to the dispersion of concept throughout select the most reveling contents; along with this they also explained the evaluation of these six manners and corresponding impact for Bayesian summarizer. Their research also shows it clearly that the problem of redundant concept selection is considered and resolve because the maximum redundancy highly impacts the accuracy and final resultant summary.
Sonail Ghandi et al. [12] Reviewed the query based summarization and use the TF-IDF, K-Mean, and HMM altogether for a better outcome in a unique way. In querybased summarization, the importance of a sentence is described as how important the sentence corresponding to the query and how relevant it is to the user question.
Md. Majharul Haque et al. [13] provide a comparative study in a form of literature review on different methods proposed by multiple analysts. These approaches are studied and compared for and clarify the multiple document summarizations concept which provides initial foundation and direction towards innovation for future work.
Hans Christian et al. [14] compared the resultant summary of extractive manner after applying the TF-IDF algorithm with some online automatic text summarizers and the key algorithm for this research to summarize a single document text is TF-IDF. The resultant accuracy of this research is 67% which is determined by a statistical F-Measure using for evaluation while F-Measure is calculated as the ratio of precision and recall.
S.Mohamed Saleem et al. [15] explicitly scrutinized the extractive summarization of text which is a way of selecting important sentences from a text document and linked them in a shorter and irredundant form for the final summary. They explain various methods used Fuzzy logic, Graph base method, SR ranking, Machine Learning, Regression, and Neural network.
-
III. Clustering
Research workers have devised number of tools and techniques in the field of data mining to get the inside pattern of the data. Then based on those inside patterns categorize the objects according to their similarity. This is an unsupervised approach used to find out groups or clusters of objects in enormous amount of data. Moreover, if the aim is to classify the set of documents then this process of categorization named as document clustering. It is a basic process of data analysis, which applied in many fields like biology, psychology, and economics. The main objective is to divide these objects into different classes such that objects in the same class should alike as much as possible and dissimilar from the object in opposite class or clusters as much as possible. Document clustering used to organize text documents, which are beneficial for information retrieval, data mining. It can divide the document clustering into two subtypes a) hard clustering b) soft clustering these may also entitle disjoint and overlapping clustering respectively. If the document lies only in one cluster then it is a hard clustering while document lies in more than one clusters is reckoning as a soft clustering [3][16, 17, 18, 19]. Some of the key clustering techniques are a) Partitioning Clustering b) Hierarchical Clustering c) Grid-Based Clustering d) Density-based Partitioning.
-
IV. K-Means Clustering
K-means clustering lies in partitioning clustering method most frequently used in data mining, the algorithm segregates N number of documents into K number of clusters while the value of K specified by users or even by making use of some the heuristic methods that discussed below to find the true K value for this division. Thus the true K will use to partitions our N documents in K different classes in which documents of the same cluster must similar to each other and dissimilar from the other clusters or classes using some similarity constraints. The goal of K-means is to decrease the summation of square distance among data points and their respective cluster centers. The calculation steps required for K-means clustering method are followed as illustrated by [20].
Select the initial K cluster centers as:
а1(1),а2(1),а3(1)...ак (1)
Distribute the data {X} in K clusters at kth iteration using the relation below:
XeC j (K) if ||x - a j( k)|| < ||x - az(k)H (2)
For all 1,2,3,4, ..., K; i ^ j; where Cj (k) represent the set of data points whose cluster centers is a , (k).
Calculate the new center a , (k + 1),j = 1,2,3, -.,K as the summation of the squared distances to the new cluster center from all points in C , (k) minimized. The part that works to minimize distance is simply the mean of C j (k). Thus the new cluster center is calculated as:
a ,( k + 1) = - ^.х^ хух, j = 1,2,3,...,K (3)
While the N j stand for the No. of samples inC , (k).
If a,(k + 1) = a,(k) for j = 1,2,3,... ,K then the algorithm become halt due to converged action, otherwise repeat step (b).
In this whole process, it is clear that the final clustering results always affected by the initial seed and true value of K, but initial seeds and the true value of K present in the data set required previous knowledge which is mostly impractical.
-
V. Document Preprocessing and Representation
To divide a set of documents D in different classes or cluster is not a simple steady process because it needs to follow a systematic procedure to cluster the data. The involved stages that highly affect the clustering results in the whole document clustering processes are discussed in the following sections.
-
A. Preprocessing
Preprocessing is the primary step required to prepare the data in a readable format for the text mining process. It is useful for noise reduction in data and makes the data clean. The actual goal is to convert the original data into a machine-understandable form. The process of preprocessing includes tokenization, filtering, stemming or lemmatization and stop-word removal.
-
i. Tokenization: It is a process of dividing a long sentence into small pieces word by word using space division or we can also use a regular expression to do this task and it is one of the initial steps before converting text into numbers.
-
ii. Filtering: The words providing less value under vector models need to remove before the actual calculation, and filtering is the process to fulfill this task. Each document contains multiple words like punctuations, special-characters, stop-words, and redundant words occurred multiple time in each document as well as in multiple documents. They provide limited information to distinguish multiple documents, and some documents may contain rare words that give no importance. They all need to be filter out.
-
iii. Stemming: The vital goal of the stemming process is to change the words to its root (stem) words,
which is a highly language dependent process. The algorithm of the stemming process in the English language was published in [21] and it was first introduced in [22]. It is a process that helped to raise efficiency and decrease redundancy.
-
iv. Lemmatization: It is the procedure that emphasizes the lexical analysis of words and gets together a number of inflected forms of words belonging to the same family sorted by roots. Lemmatization is the procedure that emphasizes the roots. Lemmatization can be also defined as a process of mapping nouns to its single form and verbs from to infinitive tense. In the process to lemmatize the documents necessarily, it needs the POS (Part of Speech) definition of each word but POS is an error-prone and very tedious job that is why stemming is always preferred practically instead of Lemmatization.
-
v. Stop-Word Removal: The perpetual occurring words like prepositions, articles, conjunctions, such as is, the, an, a, when, and, but or the non-informative words and certain high-frequency words are the “stop-words”. The Stop-word removal is the technique used to expel these words from the vocabulary because as a dimension of vector space they do not give any meaning and therefore considered less significant. Stop-word removal process helps in performance and highly influences the complete clustering process [21, 22, 23, 24, 25, 26, 27, 28, 29, 30].
-
B. Representation
Before clustering the sentences into groups, the important requirement is to make them machine understandable as in the form of vectors, known as VSM (Vector Space Model) written as:
Z = {Х 1 ,% 2, Х з ,% 4 , ^,xn} (3)
The term “xf in Z represents the feature vector S for each sentence while
S = {w i ,W 2 ,W 3 ,^W n } (4)
The W j is a term weight representation of term tj in each sentence which reflect the significance of each term in a sentence. For SVM vectors of a document is highly dependent and more easily understandable to make use of the methodology of TF-IDF is excessively used one, which calculates the importance for each term of a document. The mathematical formula for TF-IDF can be shown as follows:
Wu = tfu * idfu = tf * lo0 2 (^J (5)
Where, tf jj represents the frequency of term i in a document j, df jj indicates the document number in which term i appeared, and n is the total number of documents.
The calculation of term weight under this process deliberates the frequency of appearance for a term in a document as well as in the entire corpus but here we have a single document. If a term occurred, more frequently is declare as a stop-word. TF-IDF eradicates those words because the TF-IDF score for stop-words turn to zero or near to zero [31, 32, 33, 34].
-
VI. Methodology
The diagram below demonstrates the comprehensive flow of our algorithm from start to end. In this whole process first, we need to give a single document as an input to the algorithm which we want to summarize. After reading the document, the function used for preprocessing will clean up the document from unwanted words and characters and it is one of the initial processes in almost every NLP process. The Step followed preprocessing is sentence weighting which we can do by two methods as mentioned in the diagram. The TF-IDF will result in a single row matrix because we want to process a single document. Complete understanding of sentence weight calculation explained by [39] is followed and prefers to read for better understanding. In the second method, weight is given to each sentence by word occurrences in each sentence. After sentence score calculation we used that matrix for K value determination that is used to input as true K for K-means algorithm to cluster the sentences for final summary creation.
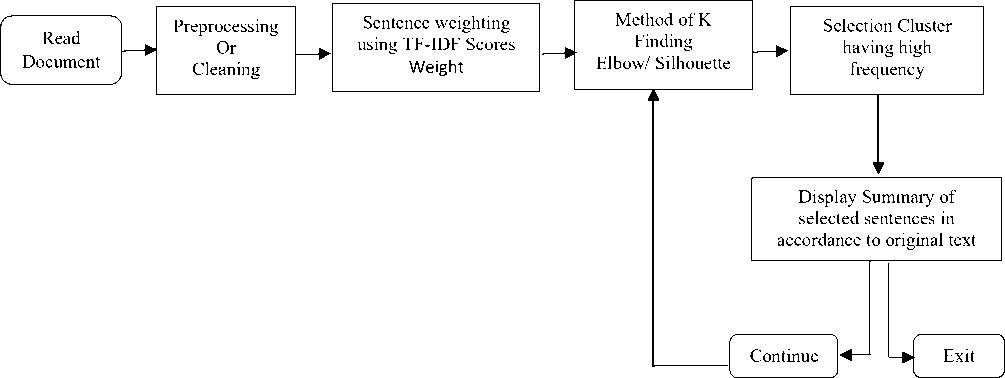
Fig.1. The flowchart of proposed algorithm
In our methodology, we are following the steps shown in the diagram presented just before the start of this text in (Fig. 1). Provide a document or text as an input to find the summary of it. After reading of the text document line by line make an array of it and insert in to step 2 for preprocessing and cleaning. In step three find weights of each sentence respectively, in this particular experiment we used two methods TF-IDF weighting method and word occurrence method in which adding the frequency of every no-stop word for a sentence. Due to the two steps, we are able to achieve the numerical shape of the document because we know that our algorithm can only work on the numerical form of values. In step four find the number of K clusters of classes to divide the sentences of the document. Whenever the K value received from the two methods “Elbow and Silhouette” then in our program we can make choice to use which one for making groups and pass it to the final representation of K-means clusters. The fifth step is to select the class of having a high frequency of sentences, in other words, the group which contains more sentences or data points very simple the rigid cluster of K-means after applying K-means. The final step is to display that class or clusters sentences according to their numbers appear in the original document.
-
A. The Elbow method towards K finding
Determining the proper number of cluster is one of the basic drawbacks in the k-means algorithm. The correct choice of K is often ambiguous; to solve these problem different practitioners used different approaches. The Elbow method is one of the methods to find the right number of K for K-mean algorithm. It is a process of assessing the ratio of variance outcome as a function of the number of clustering. This method based on logic if make an update in k value for clustering the same dataset one by one will not provide much better modeling for the dataset. Then plot the examined variance after an increasing number of clusters plotted against the number of clusters. The basic notion is to initiate K=2 and keep incrementing it in each step by 1 and for each value of k evaluate the sum of squared errors (SSE) or distortion and clusters that anticipated with training. Starting Clusters will figure enough information while at a particular spot the marginal gain dramatically descends and allocate an angle graph. At that value, when the cost drops down dramatically after that the graph increase horizontally and further increase in the number of clusters it gets plateau. Henceforth when plotting a line chart of the SSE (measures the compactness of the clustering and our desire it to be as nominal as possible) for respective value of k. If the line chart visible like an arm, then the "elbow" on the arm is the value of K that is the pertinent K. The concept is that search for a meagre SSE and SSE tends to decrease toward 0 as escalate K (the SSE is 0 when K is synchronized to the number of data points in the dataset, because then each data point is its own cluster, and there is no error between it and the center of its cluster). The justification is after this, if make increase in the clusters in numbers, the new cluster will very close to some of the existing. Therefore, our aim is to acquire a small value of k that still has a minor SSE, and the elbow usually represents where to have to start. Despite this, there is still a problem with the elbow method because it cannot be clear always and sometimes gives multiple elbows for some datasets or even show no elbow. So in the situation, if have not clear elbow then as alternate go for use of some other method to know the true value of K or to check whether our dataset is suitable for clustering or not. If the resultant elbow is vague elbow then approach of ‘Kneedle’ which is a method explain by Ville Satopa [35], can help to represent the best curve point knee for elbow method because of dealing with a mathematical concept of curvature. The python SK-learn provides a library for finding the knee point in the elbow. Even though it gives mostly good results and also simple to understand and implement, but its need of biased judgment for pointing out where the actual elbow is located, and as [36] prove that the approach can easily fail. Also for high dimensions in our experiment, the elbow is not clear to select the true K.
Steps for Elbow Method:
-
> K =2 K start from 2
-
> Increase the K value by one 1
-
> Measure the SSE or distortion
-
> The point at which the cost drops dramatically > Select that point as a true K
-
B. The Silhouette method towards K finding
The average silhouette of the data is another lucrative and precise way for determining the natural number of clusters. According to Moh'd Belal Al- Zoubi [37]. The silhouette method consumed a lot of time due to the calculation of distance and took more CPU time. Along with this, describe a new method for the silhouette to minimize the computation time with reducing addition operations amount during distance calculation, which has experimentally proven that about 50% CPU time gained. It is also a measure that helps in concluding clustering legitimacy and selecting the optimal K value to divide a ratio scale data into distinct classes [38]. For true K the preferable number of clusters whose silhouette value predicted large enough. Still, it is too much complex because the value variation of silhouette of two clusters A and B are very imperceptible and will use to plot it for definite understanding. The silhouette of a data instance is a measure of how closely it is matches to data point within its own cluster and how loosely it is match to data of the neighboring cluster. The silhouette values occur in the scope from -1 to 1. If the silhouette width value for an entity is about to zero, likewise the entity could be appointed to another cluster as well. If the silhouette width value is near to 1, it means that the entity is misclassified. If all the silhouette width values are intimate to 1, it means that the set I is well clustered. The average silhouette of individual entities can characterize a clustering. The largest average silhouette width, over different K, indicates the best number of clusters.
-
C. Final System Summary
In this final step, the summarizer extract the class encompasses utmost data points or in the simple words the cluster having greater amount of sentences and bring them together to produce the resultant summary of the input document. The resultant summary also needs to arrange in such a way follow the sequence of original input document to fulfill the actual flow for the reader in order to understand the main idea of the topic.
-
VII. Experimental Results
The following figures (Fig. 2. to Fig. 6.) show the elbow method diagrammatically. We clearly understand from the above discussions that elbow will not always suggest the actual value that we can use that’s why for the sack of clarity we have to twist our implementation in which we able to know the right position of K value. In that situation, we used the Kneeled method explained by [35]. This way help us to locate the perfect curve point knee in elbow graph from which can easily take the decision of true clustering value and this method find curvature. In python we do it by simply installing and importing the kneeled library. While the rest of the figures (Fig. 7. to Fig. 11.) explain the result of the silhouette method for our procedure implementation. The Table 1 System_Summary_Table below the grapes [2, 3, 4, 5, 6, 7, 8, 9, 10] provides an example of the document and the resultant system summary produced from both elbow and silhouette K values. Because of the paper length we just include out of only one document the maximum result could be provided on request.
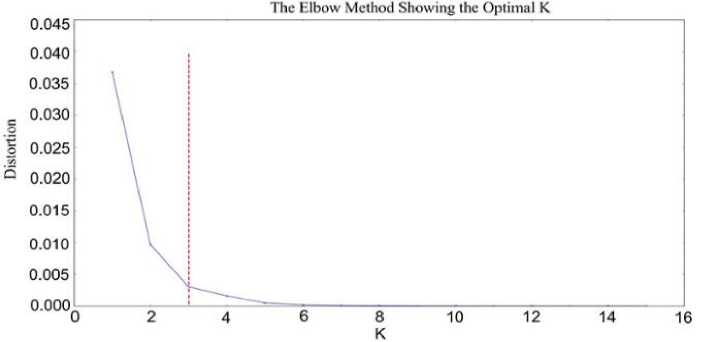
Fig.2. The Elbow with K value 3 Doc 1
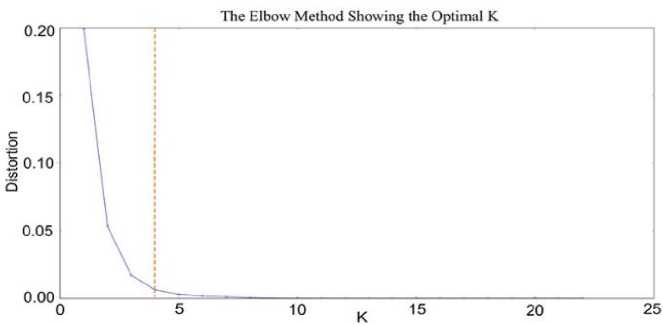
Fig.3. The Elbow with K value 4 Doc 2
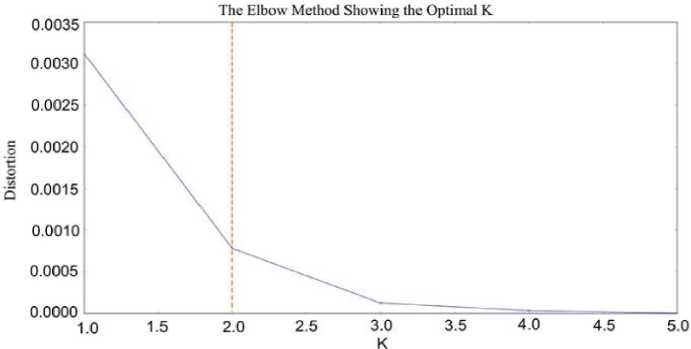
Fig.4. The Elbow with K value 2 Doc 3
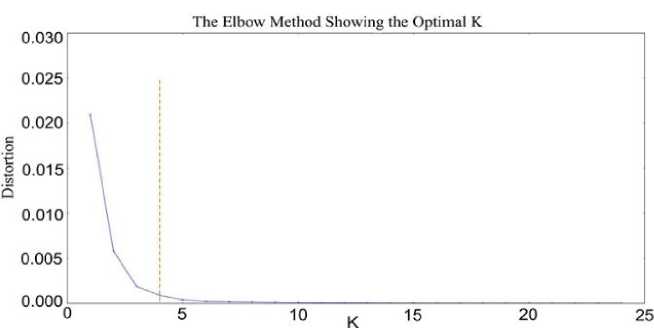
Fig.5. The Elbow with K value 4 Doc 4
Distortion
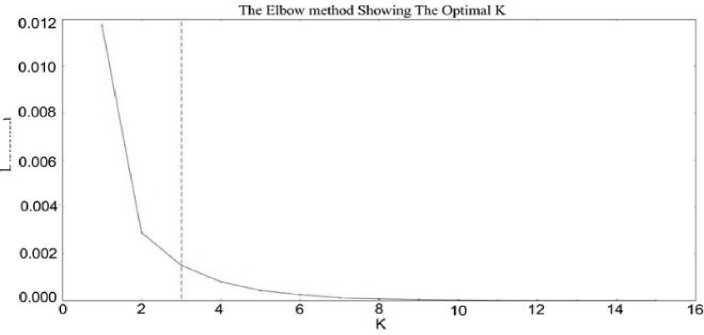
Fig.6. The Elbow with K 3 Doc 5
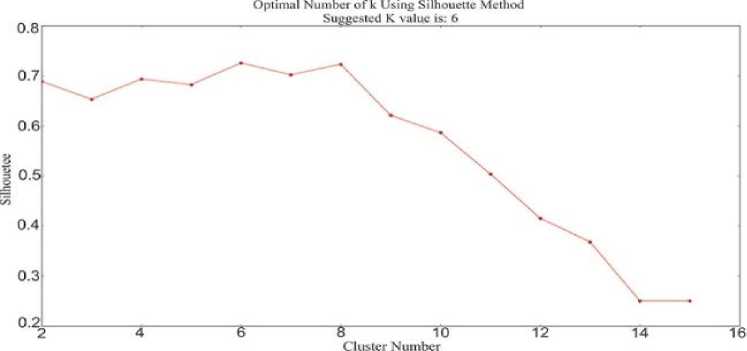
Fig.7. Silhouette method suggested K value is: 6
Optimal Number of К Using Silhouette Method
Silhouette
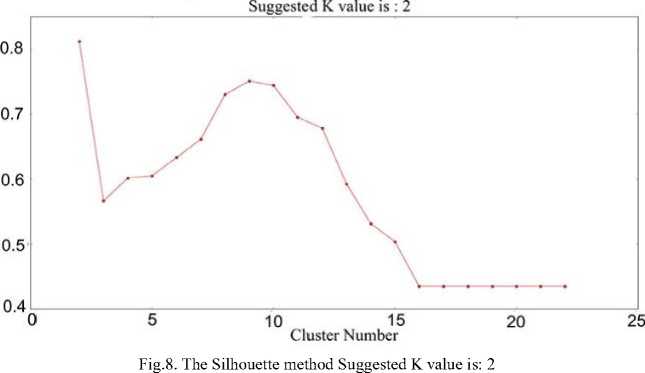
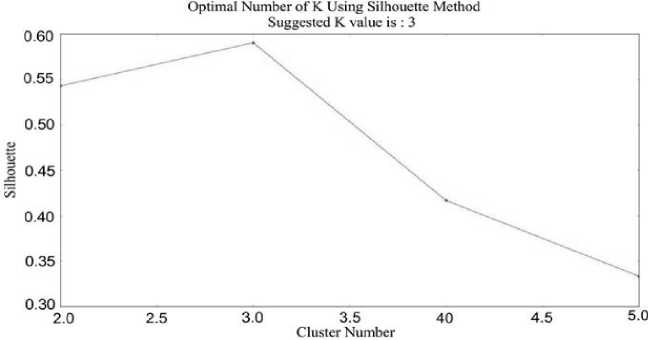
Fig.9. The Silhouette method suggested
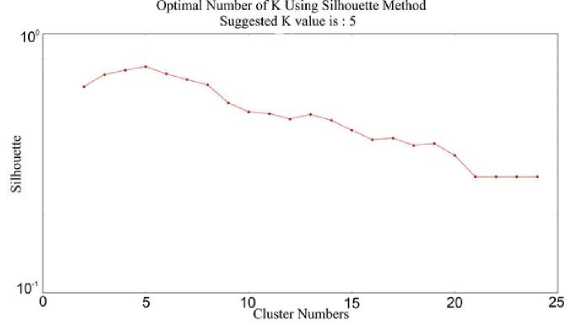
Fig.10. Silhouette method suggested K value is: 5
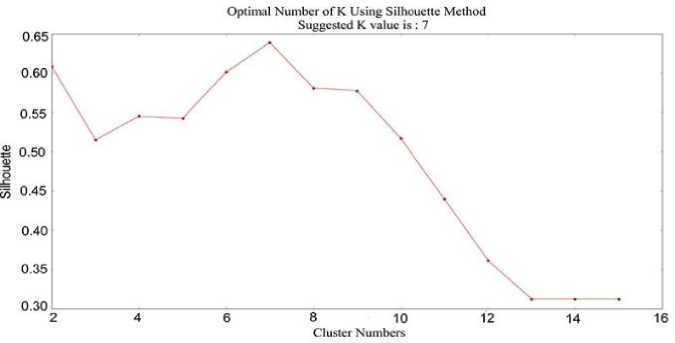
Fig.11. The Silhouette method suggested K value is: 7
Table 1. System_Summary_Table
Original document example using document 1
The Daman and Diu administration on Wednesday withdrew a circular that asked women staff to tie rakhis on male colleagues after the order triggered a backlash from employees and was ripped apart on social media.The union territory’s administration was forced to retreat within 24 hours of issuing the circular that made it compulsory for its staff to celebrate Rakshabandhan at workplace. It has been decided to celebrate the festival of Rakshabandhan on August 7. In this connection, all offices/ departments shall remain open and celebrate the festival collectively at a suitable time wherein all the lady staff shall tie rakhis to their colleagues, the order, issued on August 1 by Gurpreet Singh, deputy secretary (personnel), had said.To ensure that no one skipped office, an attendance report was to be sent to the government the next evening.The two notifications one mandating the celebration of Rakshabandhan (left)and the other withdrawing the mandate (right) were issued by the Daman and Diu administration a day apart. The circular was withdrawn through a one-line order issued late in the evening by the UT’s department of personnel and administrative reforms. The circular is ridiculous. There are sensitivities involved. How can the government dictate who I should tie rakhi to we should maintain the professionalism of a workplace an official told Hindustan Times earlier in the day. She refused to be identified. The notice was issued on Daman and Diu administrator and former Gujarat home minister Praful Kodabhai Patel’s direction, sources said.Rakshabandhan, a celebration of the bond between brothers and sisters, is one of several Hindu festivities and rituals that are no longer confined of private, family affairs but have become tools to push politic al ideologies.In 2014, the year BJP stormed to power at the Centre, Rashtriya Swayamsevak Sangh (RSS) chief Mohan Bhagwat said the festival had ?national significance and should be celebrated widely to protect Hindu culture and live by the values enshrined in it. The RSS is the ideological parent of the ruling BJP. Last year, women ministers in the Modi government went to the border areas to celebrate the festival with soldiers. A year before, all cabinet ministers were asked to go to their constituencies for the festival
Results
Resulting Summary for K value from Elbow
The order, issued on August 1 by Gurpreet Singh, deputy secretary (personnel), had said. To ensure that on one skipped office, an attendance report was to be sent to the government the next evening. The two notifications one mandating the celebration of Rakshabandhan (left) and the other withdrawing the mandate (right) There are sensitivities involved. How can the government dictate who I should tie rakhi to? We should maintain the professionalism of a work an official told Hindustan Times earlier in the day. She refused to be identified.The notice was issued on Daman and Diu administrator and former Gujarat home minister Praful Kodabhai Patel? Direction, sources said. Rakshabandhan, a celebration of the bond between brothers and sisters, in one of several Hindus festivities and rituals that are no longer confined of private, family affairs but have become tools to push political ideologies. In 2014, the year BJP stormed to power at the center, Rashtriya Swayamsevak Sangh(RSS) chief Mohan Bhagwat said the festival.had national significance and should be celebrated widely to protect Hindu culture and live by values enshrined in it.
Resulting Summary for K value from silhouette
The Daman and Diu administration on Wednesday withdrew a circular that asked women staff to tie rakhis on male colleagues after the order triggered a backlash from employees and was ripped apart on social media. The union territory’s administration was forced to retreat within 24 hours of issuing the circular that made it compulsory for its staff to celebrate Rakshabandhan at Workplace.
In this connection, all offices/ departments shall remain open and celebrate the festival collectively at a suitable time wherein all the lady staff shall tie rakhis to their colleagues, The circular was withdrawn through a one-line order issued late in the evening by the UT’s department of personnel and administrative reforms.
The RSS is the ideological parent of the ruling BJP. Last years, women ministers in the Modi government went to the border areas to celebrate the festival with soldiers. A year before, all cabinet ministers were asked to go to their constituencies for the festival.
-
VIII. Experimental Analysis
The system used during our experimentation process is a computer system of CPU Intel ® Core I5 with 8 GB RAM and having Windows 10, 64-bit OS installed. The programming language is Python version 3.5 Anaconda and PyCharm Community configured as an IDE.
A. Dataset
The dataset used for the experimental purpose is taken from [40] which contain news headlines and the summary of that article along with the complete text of each and every article which can easily be used for comparison of system summary. The dataset is in CSV format with 4514 x 6 entries that indicate the rows and columns. The order of the columns are [Author_name, Headlines, Article URL, Short text, Complete Article] respectively. The data set is a collection of news articles news articles from Hindu, Indian times and Guardian This is one of the freely accessible databases that we can while the time expansion of these articles spans only six use for multiple functions along with summarization.
months from the 2nd month of 2017 8th month of 2017.
Table 2. Overall Statistical Data for Comparison
K Values Documents with Elbow K Values with Silhouette Number Number of Total of Number of sentences Number sentences sentences using of Elbow k using using Auto sentences Silhouett Summarizer value e k value Summary Size after in percentage with Elbow K Summary Summary Size after in Size after in percentage percentage with for Auto Silhouette K Summarizer Doc1 3 6 18 8 6 10 44% 33% 55% Doc2 4 2 26 12 13 11 46% 50% 42% Doc3 2 3 7 4 3 1 57% 43% 14% Doc4 4 5 26 11 7 4 42% 26% 15% Doc5 3 7 17 6 3 6 35% 17% 35% Table 3. BLEU Result for Elbow Resulting Summaries Documents BLEU Scores for BLEU Scores for BLEU Scores for ] LEU Scores for Cumulative Scores 1-gram 2-grams 3-grams 4-grams Doc1 0.532375 0.470874 0.352261 0.398328 0.398328 Doc2 0.655738 0.402305 0.302419 0.218982 0.318892 Doc3 0.241590 1.000000 0.294409 0.359996 0.395996 Doc4 0.542623 0.171780 0.081414 0.149545 0.259545 Doc5 0.016667 1.000000 0.258997 0.346967 0.346967 Table 4. BLEU Result for Silhouette Resulting Summaries Documents BLEU Scores for BLEU Scores for BLEU Scores for BLEU Scores for 1-gram 2-grams 3-grams 4-grams Doc1 0.693456 0.458992 0.366777 0.238007 0.428007 Doc2 0.703279 0.383333 0.152542 0.026267 0.352257 Doc3 0.30769 0.175412 0.317014 0.418822 0.418822 Doc4 0.3114875 0.072050 0.176214 0.268422 0.268422 Doc5 0.016667 1.000000 0. 404753 0. 503984 0. 503984 B. Evaluation of final results machine translation automatically. The term BLEU The above three tables show the overall statistic of the result to evaluate the final results. The objective of evaluation in text summarization techniques is to find out how strong and satisfactory our resulting system summary and how much it comprehends the overall theme of the main document. To figure out our final result we did our compression by following two ways with the online summarizer [“”] and also used the method called BLEU Score which was proposed by Kishore Papineni [41]. It is a matrix to evaluate stands for Bilingual Evaluation Understudy which works to examine and score a candidate and reference translations of a particular text while the reference translation may be one or more. Its result was ranged from 0-1 showing the perfect match and unmatched of two entities while it’s specially designed for analyzation of machine translation but it can be used for a range of NLP tasks. The reason the author used a BLEU score for analyzing my experimental results is because it’s easily understandable, independent to language also inexpensive and quickly processed. The BLEU score comparing the n-grams between reference and candidate translation to calculate the occurrence of matches while matches are position independent. That’s why more matches meets the results in better candidate translation.
-
IX. Conclusion
I nformation intently increasing day by day with range of formats on the internet that is freely usable and openly accessible worldwide. The volume of textual data is also rising rapidly on the internet which requires suitable mechanisms to inspect and extract consistent information from these textual data in order to make them easily readable and therefore beneficial for humans. That’s why the need of text summarization earns a keen interest that makes the text document comparatively shorter in version. Which is easy to grasp and time-saving while echoing the same idea that is the theme of discussion within the document. In our experiment, we used the K-means and TF-IDF method for extractive text summarization with K value predefined following the two well know methods that are used to get widespread for true K determination. As we can see from the statistical measures that our approach results in best output and we use two types of comparison evaluation to so. One thing that makes clear during all these experiments that before summarizing the online crawled or corpus texts we should give proper look to preprocessing step and make sure that all unnecessary characters, keywords, tags, and punctuations. In our forthcoming work, we will focus on the text document having redundant sentences because during summarization we need to keep track of multiple occurrences of sentences that may lead to useless results in the sense of resulting system summary that only contain these redundant sentences. Besides that, we can very easily encompass the multiple document summarization with slight logical changes in the program that will the part of our future work. Many things are explained but summarization is still open are of researchers and possible adopt range of methods towards the fruitful system summary achievement.
Acknowledgment
Funded by the National Natural Science Foundation of China (61562086, 61462079), Xinjiang Uygur
Autonomous Region Innovation Team XJEDU2017T002.
References Extractive based text summarization using k-means and TF-IDF
- Rupal Bhargava.et al. 2016, “ATSSI: Abstractive Text Summarization using Sentiment Infusion” Twelfth International Multi-Conference on Information Processing.
- Elena Lioret. Manuel Palomar 30 April 2011, “Text summarization in progress: a literature review” Artif Intell Rev.
- Shraddha, S.et al. 2014, “A Review ON K-means DATA Clustering APPROACH” International Journal of Information and Computation Technology.
- Sajid et al. 2018, “Study and Implementing K-mean Clustering Algorithm on English text and techniques to find the Optimal value of K” International Journal of Computer Applications (0975 – 8887).
- S.A.Babar.et al. 2014, “Improving Performance of Text Summarization” International Conference on Information and Communication Technologies.
- Saeedeh Gholamrezazadeh.et al. 2009, “A Comprehensive Survey on Text Summarization System” IEEE.
- Vishal Gupta.et al. 2010, “A Survey of Text summarization techniques” Journal of Emerging Technologies in Web Intelligence. Vol 2 No 3.
- Oi Mean Foong.et al. 2010. “Challenges and Trends of Automatic Text Summarization” International journal of Information and Telecommunication Technology; Vol.1, Issue 1.
- Nikita Munot.et al.2014, “Comparative Study of Text Summarization Methods” International Journal of Computer Applications. Volume 102-No.12.
- Eduard Hovy.et al. 1999. “Automated text summarization in SUMMARIST. MIT Press, Pages 81-94.
- Milad Moradi , Nasser Ghadiri 2018, “Different approaches for identifying important concept in probabilistic biomedical text summarization” Artificial intelligence in medicine. Pages 101-116.
- Sonail Ghandi, et al. April 2017. ”Review on Query Focused Summarization using TF-IDF, K-Mean Clustering and HMM” International journal of Innovative Research in Computer and Communication Engineering.
- Md. Majharul Haque, et al. May 2013 “Literature Review of Automatic Multiple Documents Text Summarization” International Journal of Innovation and Applied Studies. Pages 121-129
- Hans Christian, et al December 2016 “SINGLE DOCUMENT AUTOMATIC TEXT SUMMARIZATION USING TERM FREWUENCY-INVERSE DOCUMENT FREWUENCY (TF-IDF)” ComTech. Pages 285-294
- S.Mohamed Saleem, et al. May 2015 “STUDY ON TEXT SUMMARIZATION USING EXTRACTIVE METHODS” International Journal of Science, Engineering and Technology Research. Volume 4.
- Y,S,Patail , M.B. Vaidya 2012, “A Technical survey on Clustering Analysis in Data mining” International Journal of Emerging Technology and Advanced Engineering.
- Himanshu Gupta, Dr.Rajeev Srivastav 2014, “K-means Based Document Clustering with Automatic ‘K’ Selection and Cluster Refinement” International Journal of Computer Science and Mobile Applications.
- Greg Hamerly and Charles Elkan 2003, “Learning the k in k- means” In Neural Information Processing System, MIT Press.
- Chun-ling Chen,S.C. Tseng and Tyne Liang Nov. 2010, “An integration of Word Net and Fuzzy association rule mining for multi-label document clustering” Data and Knowledge Engineering, pp. 1208-1226.
- J.T. Tou and R.C. Gonzalez 1974, “Pattern Recognition Principles” Massachusetts: Addison-Wesley.
- Martin F Porter 1980, “An algorithm for suffix stripping” Program: Electronic Library and information system, pp. 130–137.
- Julie B Lovins 1968, “Development of a stemming algorithm. MIT Information Processing Group” Electronic Systems Laboratory.
- Mehdi Allahyari.et al. August 2017, “A Brief Survey of Text Mining: Classification, Clustering and Extraction Techniques” In Proceedings of KDD Bigdas, Halifax, Canada, 13 pages.
- Twinkle Svadas, Jasmin Jha June 2015, “Document Cluster Mining on Text Documents” International Journal of Computer Science and Mobile Computing Vol.4, pg.778-782.
- Neepa Shah, Sunita Mahajan October 2012, “Document Clustering: A Detailed Review” International Journal of Applied Information Systems (IJAIS) Vol. 4.
- Abdennour Mohamed Jalil, Imad Hafidi et al. 2016, “Comparitive Study of Clustering Algorithms in Text Mining Context” International Journal of Interactive Multimedia and Artificial Intelligence Vol. 3, No. 7.
- Jonathan J Webster and Chunyu Kit 1992, “Tokenization as the initial phase in NLP” In Proceedings of the 14th conference on Computational linguistics Vol. 4, pp. 1106–1110.
- Hassan Saif et al 2014 “On stopwords filtering and data sparsity for sentiment analysis of twitter” School of Engineering and Applied Science, Aston University, UK.
- Martin F Porter 1980, “An algorithm for suffix stripping” Program: Electronic Library and information system, pp. 130–137.
- David A Hull et al. 1996, “Stemming algorithms: A case study for detailed evaluation” JASIS, pp. 70–84.
- Mehdi Allahyari.et al. August 2017, “A Brief Survey of Text Mining: Classification, Clustering and Extraction Techniques” In Proceedings of KDD Bigdas, Halifax, Canada, 13 pages.
- Neepa Shah, Sunita Mahajan October 2012, “Document Clustering: A Detailed Review” International Journal of Applied Information Systems (IJAIS) Vol. 4.
- Everitt, B., 1980. “Cluster Analysis” 2nd Edition. Halsted Press, New York
- M. Meila, and D.Hackerman 1998, “An Experimental Comparison of Several Clustering and Initialization Method” Microsoft Research Redmond, WA.
- Ville Satopa et al. “Finding a “Kneedle” in a Haystack: Detecting Knee Points in System Behavior” International Computer Science Institute, Berkeley, CA.
- Wei Fu and Patrick O. Perry February 10, 2017, “Estimating the number of clusters using cross-validation” Stern School of Business, New York University.
- Moh'd Belal Al- Zoubi and Mohammad al Rawi, “An Efficient Approach for Computing Silhouette Coefficients” Department of Computer Information Systems, University of Jordan, Amman 11942, Jordan.
- Tippaya Thinsungnoena et al 2015, “The Clustering Validity with Silhouette and Sum of Squared Errors” The 3rd International Conference on Industrial Application Engineering (ICIAE2015).
- Yohei SEKI 2003, “Sentence Extraction by tf/idf and Position Weighting from Newspaper Articles” National Institute of Informatics.
- https://www.kaggle.com/datasets
- Kishore Papineni.et al. July 2002, “A Method for Automatic Evaluation of Machine Translation” Proceedings of the 40th Annual Meeting of the Association for Computational Linguistics (ACL), Philadelphia, pp.311-318.
