Face Recognition System Using Doubly Truncated Multivariate Gaussian Mixture Model and DCT Coefficients Under Logarithm Domain

Author: D. Haritha, K.Srinivasa Rao, Ch. Satyanarayana
Journal: International Journal of Image, Graphics and Signal Processing(IJIGSP) @ijigsp
Article in issue: 10 vol.4, 2012.
Free access
In this paper, we introduce a face recognition algorithm based on doubly truncated multivariate Gaussian mixture model with DCT under logarithm domain. In face recognition, the face image is subject to the variation of illumination. The effect of illumination cannot be avoided by mere consideration of DCT coefficients as feature vector. The illumination effect can be minimized by utilizing DCT coefficients under logarithm domain and discarding sum of the DCT coefficients which represents the illumination in the face image. Here, it is assumed that the DCT coefficients under logarithm domain after adjusting the illumination follow a doubly truncated multivariate Gaussian mixture model. The truncation on the feature vector has a significant influence in improving the recognition rate of the system using EM algorithm with K-means or hierarchical clustering, the model parameters are estimated. A face recognition system is developed under Bayesian frame using maximum likelihood. The performance of the system is demonstrated by using the databases namely, JNTUK and Yale and comparing it’s performance with the face recognition system based on GMM. It is observed that the proposed face recognition system outperforms the existing systems.
Face recognition system, EM algorithm, Doubly truncated multivariate Gaussian mixture model, DCT coefficients under logarithm domain
Short address: https://sciup.org/15012444
IDR: 15012444
Text of the scientific article Face Recognition System Using Doubly Truncated Multivariate Gaussian Mixture Model and DCT Coefficients Under Logarithm Domain
Illumination normalization is an important task in the field of computer vision and pattern recognition. The effect of illumination on face became a very challenging task in face recognition area, especially for appearancebased approaches. The same person can be seen greatly different under varying lighting conditions. A number of illumination invariant face recognition approaches have been proposed in the past years. It has been proven, both experimentally and theoretically that, in face recognition, illumination gives more effect on the face compared to the inherent differences between individuals (Adini et al., (1997) and Zhao et al.,(1999)). The performance of most existing algorithms is highly sensitive to this illumination variation. To attack the problem of face recognition under varying illumination, several methods have been proposed (Annalisa et al., (2009), Athinodoros et al., (2001), Claudio et al., (2008) and Hazim et al., (2010)).
Histogram equalization is the most commonly used approach. By performing histogram equalization, the histogram of the pixel intensities in the resulting image is flat. It is interesting that even for images with controlled illumination (such as face images in the XM2VTS database), applying histogram equalization still offers performance gain in face recognition (Short et al., (2006) and Gonzalez et al., (1992)). Shan et al (2003) proposed Gamma intensity correction for illumination normalization. The corrected image G(x,y) can be obtained by performing an intensity mapping:
G(x,y)=С X I(x, y)r, where C is a gray stretch parameter, and У is the Gamma coefficient.
In homomorphic filtering approach the logarithm of the equation of the reflectance model is taken to separate the reflectance and luminance. The reflectance model often adopted is described by I(x,y)=R(x,y)*L(x,y), where I(x,y) is the intensity of the image, R(x,y) is the reflectance function, which is the intrinsic property of the face, and L(x,y) is the luminance function. Based on the assumption that the illumination varies slowly across different locations of the image and the local reflectance changes quickly across different locations, a high-pass filtering can be performed on the logarithm of the image I(x,y) to reduce the luminance part, which is the low frequency component of the image, and amplify the reflectance part, which corresponds to the high frequency component (Gonzalez et al., (1992)).
Shan and ward et al., (2005) performed illumination normalization in the wavelet domain. Histogram equalization is applied to low-low subband image of the wavelet decomposition, and simple amplification is performed for each element in the other 3 subband images to accentuate high frequency components. Uneven illumination is removed in the reconstructed image obtained by employing inverse wavelet transform on the modified 4 subband images. Xie and Lam et al., (2006) proposed an illumination normalization method which is called local normalization. They split the face region into a set of triangular facets, the area of which is small enough to be considered as planar patch. The main idea of this approach is to normalize the intensity values within each facet to be of zero mean and unit variance.
Short et al., (2004) compared five photometric normalization methods, namely, illumination insensitive eigenspaces, multiscale Retinex method, homomorphic filtering, a method using isotropic smoothing to estimate luminance, and one using anisotropic smoothing (Gross et al., 2003). Each method is tested with/without histogram equalization helped in every case. It is shown that using an isotropic smoothing method as photometric normalization led to the most consistent verification performance for experiments across the Yale and XM2VTS databases (Bailly et al., (2003) and Messer et al., (1999)). Chen et at., (2004) employed DCT to compensate for illumination variation in the logarithm domain. The uneven illumination is removed in the image reconstructed by inverse DCT after a number of DCT coefficients corresponding to low frequency are discarded.
In all these papers they considered that the feature vector (DCT coefficients in logarithmic domain) follows a Gaussian mixture model (GMM). However, the GMM model can characterize the feature vector accurately only when it is meso kurtic and having infinite range. But in many practical cases, the feature vector represented by DCT coefficients under logarithmic domain may not be meso kurtic and having finite range. It is observed that these DCT coefficients under logarithmic domain are asymmetrically distributed. Hence, to have a close approximation to characterize the DCT coefficients under logarithmic domain it is required to assume that the DCT coefficients under logarithmic domain (feature vector) follows a finite doubly truncated multivariate Gaussian mixture model. Very little work has been reported in literature regarding face recognition system based on DTMGMM using DCT coefficients under logarithm domain.
In this paper, the pixel intensities of each individual face image in the database are pre-processed to eliminate illumination and to make normalization by considering logarithmic transformations. The feature vectors of the DCT coefficients under logarithmic domain of the face image data are computed and modeled by using doubly truncated multivariate Gaussian mixture model. The mixture model better represents the heterogeneous nature of different facial features of a person. The model parameters are estimated by using Expectation Maximization algorithm (EM algorithm). Since the EM algorithm requires initial estimates of the model parameters, K-means algorithm or Hierarchical clustering algorithm or Hierarchical clustering algorithm is used to initialization of parameters.
The paper is structured as follows. Section II summarizes feature extraction using DCT in logarithm domain, Section III summarizes truncated Gaussian mixture face recognition model, Section IV summarizes the estimation of parameters using EM Algorithm, Section V summarizes initialization of model parameters and Section VI summarizes the face recognition algorithm, experimental results are given in Section VII, comparative study is presented in Section VIII and finally conclusions are presented in Section IX.
-
II. FEATURE EXTRACTION USING dct IN LOGARITHM DOMAIN
In this section we briefly discuss the feature vector extraction of a face recognition system under logarithm DCT domain. Several methods have been adopted to remove the illumination variation in the face images while keeping the main facial features unchanged (Chen et al., (2006), Adini et al., (1997), Hafred and Lavin (2001)). Among these features illumination normalization approach is more efficient compared to other methods. The basic idea in this method is that illumination variations can be significantly reduced by truncating low-frequency DCT coefficients in logarithmic domain. Logarithmic transformation is in general is used to enhance the value of dark pixels (Kalpana et al., (2010)) have shown the reasons for adopting DCT coefficients under logarithmic domain. Since, the reflectance is a stable characteristic of the facial feature, the image graylevel can be characterized by the product of reflectance and illumination i.e.,
f(x,y) = т(д,у\е(л,у)
This implies, logfGr.y) = logr(x,y) + loge(x,y)
where, f(x,y) is gray level of the image pixel. r(x,y) is reflectance and e(x,y) is illumination.
From this, illumination variation can be well compensated by adding or subtracting the compensation term in the logarithmic domain, if we know that illumination variation is present in the facial image. Illumination variations usually lie in the low frequency band. Therefore, the low frequency components of the face image can be removed by making the low frequency DCT coefficients as zero (Weilong et al., (2004)). if n frequency DCT coefficients are set to zero we have
F Cx.y) = V ^ E(u. v) - VECUi. vJ U=o V=0 1 = 1
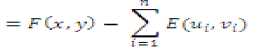
where,
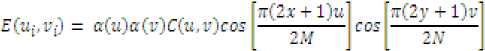
Here, the term E(u,v) is considered as the illumination compensation term. The term fCry) is the desired normalized face image in the DCT logarithmic domain. The DCT coefficients can be computed by using the method given in Conrad Sanderson et al., (2003). By adopting DCT coefficients in the logarithmic domain the illumination variations can be minimized. The first DCT coefficient in general determined the overall illumination of a face image. Therefore the required uniform illumination of the image can be obtained by setting these DCT coefficients to the same value i.e., С (0.0) = log u (\M * 15 ) , where, C(0,0) is the DCT coefficient in the logarithmic domain.
After obtaining the significant DCT coefficients of face image the feature vector xi = >i c: - cv ] T consisting of facial features of the face image, feature vector, can be modeled.
-
III. DOUBLY TRUNCATED MULTIVARIATE GAUSSIAN MIXTURE FACE RECOGNITION MODEL
In this section we briefly discuss the probability distribution (model) used for characterizing the feature vector of the face recognition system. After extracting the feature vector of each individual face it can be modeled by a suitable probability distribution such that the characteristics of the feature vector should match the statistical theoretical characteristics of the distribution. Since each face is a collection of several components like mouth, eyes, nose, etc, the feature vector characterizing the face is to follow a M-component mixture distribution. In each component the feature vector is having finite range it can be assumed to follow a doubly truncated Gaussian distribution. This in turn implies that the feature vector of each individual face can be characterized by a M-component doubly truncated multivariate Gaussian mixture model. The joint probability density function of the feature vector associated with each individual face is ft(CrU))= I/L dj dj Gt) (2)
where, dj(Z) is the probability density function of the ith component feature vector which is of the form doubly truncated Gaussian distribution (sailaja et al., (2010)).
d[(x) = I----------5---- 1 - exp [-Z (Z- Z )’ ^*l C4 ~ Z
\(в-ЯЫ=г7 1 2 J where, is a D dimensional random vector
(5 = СЧ xi - *t)) is the feature vector, /4 is the ith component feature mean vector, - is the ith component of co-variance matrix,
4 I L f Hf v I and
The mean vector of the component feature is
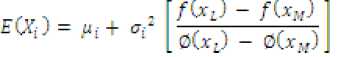
Where, 0(xl J and 0(xMJ are the standard normal areas and XL , XM are the lower and upper truncated points of the feature vectors. diW.i = 1 ....M are the component densities and a^x),! = 1... .M are the mixture weights, with mean vector. The mixture weights satisfy the constraints ^i«i = 1
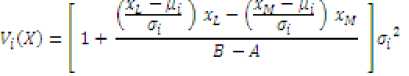
The variance of each feature vector of DCT coefficients under logarithm domain is X with diagonal elements as
The DTGMM is parameterized by the mean vector, Co-variance matrix and mixture weights from all components densities. The parameters are collectively represented by the parameter. Set A; = (ap ut , Г,} i = 1,2, ...M. For face recognition each image is represented by its model parameters.
The doubly truncated multivariate Gaussian mixture model can represent different forms depending on the choice of the co-variance matrix for all Gaussian component(Grand co-variance) or a single co-variance matrix shared by all face models(global covariance) used in DTGMM. The covariance matrix can also be full or diagonal. Here, we used diagonal covariance matrix for our face model. This choice is based on the works given by (Douglas A. Reynolds et al., (1995)) and initial experimental results indicating better identification performance and hence I can be represented as
4i о о о0 4, 0 0
oo о 4d
This simplifies the computational complexities. The doubly truncated multivariate Gaussian mixture model includes the GMM model as a particular case when the truncation points tends to infinite.
-
IV. ESTIMATION OF THE MODEL PARAMETERS
For developing the face recognition model it is needed to estimate the parameters of the face model. For estimating the parameters in the model we consider the EM algorithm which maximizes the likelihood function of the model for a sequence of i training vectors (^ = (X1X3... xt)>
The likelihood function of the sample observations is
L^-.Aj)= T^h(i-,^ (7)
where, h(i',A) is given in equation (2).
The likelihood function contains the number of components M which can be determined from the K-means algorithm or Hierarchical clustering algorithm. The K-means algorithm or Hierarchical clustering algorithm requires the initial number of components which can be taken by plotting the histogram of the face image using MATLAB code and counting the number of peaks. Once M-is assigned the EM algorithm can be applied for refining the parameters. The updated equations of the parameters of the model are:
afc 1+1 = ^Ii=ih(i|xt.^) (8)
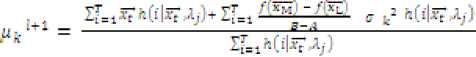
where,
c = ^(1 + ,и/+1ЯСГG^) - fGp) + (xMfGc^p xl/G^)] ,

and
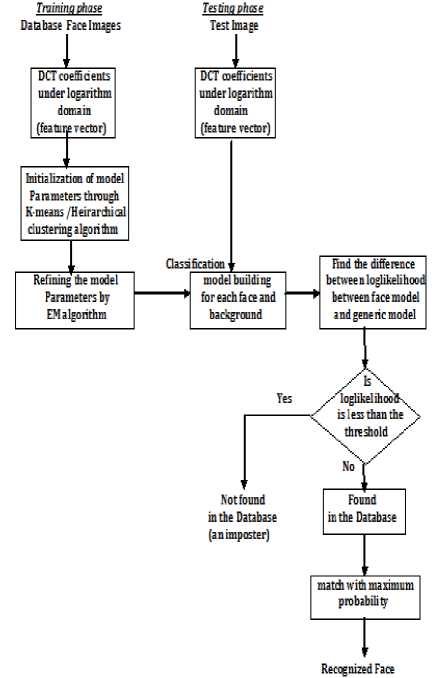
Figure1. Flow chart for Face recognition algorithm using DCT coefficients in logaritham domain
-
V. INITIALIZATION OF MODEL PARAMETERS
To utilize the EM algorithm we have to initialize the parameters [a£, Ui , a;, },t = {1 ....M). X M and X L are estimated with the maximum and the minimum values of each feature respectively. The initial values of G; can be taken as G, = ~ . The initial estimates of a,, Uy and tr,-of the ith component are obtained by using the method given by A.C.Cohen(1950).
-
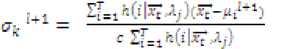
VI. FACE RECOGNITION SYSTEM
Face Recognition means recognizing the person from a group of H persons. The Figure 1 describes the face recognition algorithm under study.
Face recognition system is usually viewed as a two class classification problem and matching. Here, two classes are claimed identity or to an imposter. The bayesian classifier based on doubly truncated multivariate Gaussian mixture model is utilized. For each person two types of models are obtained. The first one is for the distribution of the training face for that particular person. The second is for the distribution of training feature vector for all training faces. This is referred as a generic model or a world model or a universal background model (Concord Sanderson et al., (2005)).
Let us consider our face recognition system has to detect the correct face with our existing database. Here, we are given with a face image and a claim that this face belongs to a particular person C to classify the face a set of feature vector’s X = 1г37_- extracted using the computational methodology of feature vector extraction discussed in section 2. By assuming that the likelihood of the face belonging to person C is found with
ZtiUc) = ^p(xJlc)
where,
The universal background model is used to find the likelihood of the face belonging to an imposter. ^C^Rsfneric) is the likelihood function of the claimant computed based on the parameter set ^5#wne . The A gins-.: is computed by considering all faces in the dataset and obtaining the average values of the parameters.
The decision on the face belonging to the person C is found using
OW = |logL№c)-log L№s?neric)
The final decision for given face is then reached as follows. Given a threshold t for O(X) the face is classified as belonging to person C, when O(X) is greater than or equal to t. It is classified as belonging to an imposter when O(X) is less than t.
For a given set of training vector ^ for all faces in the data bases and ^Jftint are computed by using the updated equations for the model parameter’s discussed in section 4 and using the initial estimates of the model parameter’s obtained by using K-means algorithm or Hierarchical clustering algorithm discussed in sections 5.
-
VII. EXPERIMENTAL RESULTS
The performance of the developed algorithm is evaluated using two types of databases namely JNTUK and Yale face databases (Satyanarrayana et al., (2009) and Qian et al., (2007)). The JNTUK face database consisting of 120 face database and Yale database consists of 120 faces. Sample of 20 person’s images from JNTUK database is shown in Figure 2.
Using the method discussed in section 2, the feature vector’s consisting of DCT coefficients under logarithm domain for each face image for both the databases are computed. For each image the sample of feature vector’s are divided into K groups representing the different face features like neck, nose, ears, eyes, etc.
For initialization of the model parameters with K-means algorithm or Hierarchical clustering algorithm, a sample histogram of the face image is drawn and counted the number of peaks. After diving the observations into three categories by both the methods and assuming that the feature vector of the whole face image follows a three component finite doubly truncated multivariate Gaussian mixture model. The initial estimates of the model parameters °i-K ,Г,are obtained by using the method discussed in section 5 with K-means algorithm or Hierarchical clustering algorithm. With these initial estimates the refined estimates of the model parameters are obtained by using the updated equations of the EM algorithm and MATLAB code discussed in section 4. Substituting these estimates the joint probability density function of each face image is obtained for all faces in the database. By considering all the feature vector’s of all faces in the database the generic model for any face is also obtained by using the initial estimates and the EM algorithm discussed in section 4 and 5 respectively. The parameters of the generic model are stored under the parametric set ^5SMrtf. The individual face image model parameter’s are stored with the parametric set z: , i= 1,2,. ..N. N is the number of face images in the database.
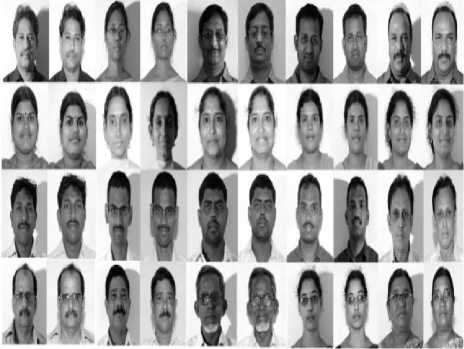
Figure 2: Sample Images from JNTUK database
Using the face recognition system discussed in section 6, the recognition rates of each database is computed for different threshold values of t in (0, 1). The false rejection rate, false acceptance rate and half total error rate for each threshold are computed using the formula’s given by (Conrad Sanderson et al. (2005)).
number of FA's
САП — ___________________'________________ number of imposter face presentations number of PR's
FRR = ----:-------------------------- number of true face presentations where, FA indicates the false acceptance and FR indicates the false rejection
FAR +FRR Half Total error rate = HTER = ---------
True positive rate = 1 — FRR
The HTER is a special case of Decision Cost function and is often known as equal error rate when the system is adjusted. Plotting the FAR and FRR for different threshold values, the ROC curves for both the databases are obtained are shown in Figures 3 and 4. From this ROC the optimal threshold value ‘t’ for each database is obtained. These threshold values are used for effective implementations of the face recognition system. Table I shown the values of HTER and recognition rates of both face recognition systems. The Figure 3 shows the ROC curves for the proposed systems for JNTUK database respectively.
From Table I and Figures 3 and 5, it is observed that the proposed algorithm identifies with 97.18% and 96.67% for JNTUK and Yale databases correctly. From the ROC curves, it is observed the proposed models perform better.
The efficiency of the developed system with respective to the size of the database is also studied by varying the number of face images from 5 to 120 available in JNTUK and Yale databases. The HTER and recognition rates for different sizes of the databases from JNTUK and Yale are computed and shown in Table II. Figure 4 shows the relationships between the number of faces in the databases and the performance measures of the system by using DTMGMM.
From Table II and Figure 4, it is observed that the recognition rates of both the system increase when the number of face in the database increases. The recognition rate increases upto a size of 25 images and stabilize there after. This may be due to the more number of observations available for training the recognition system and efficiency in estimating the model parameters increases with observations. However, the recognition rate is above 91% for all sizes and it stabilizes after a size of 25 faces. This indicates the face recognition system is suitable for small and large databases.
From the above distributions it is observed that the face recognition system with doubly truncated multivariate Gaussian mixture model with hierarchical clustering algorithm is more efficient compared to that of doubly truncated multivariate Gaussian mixture model with K-means.
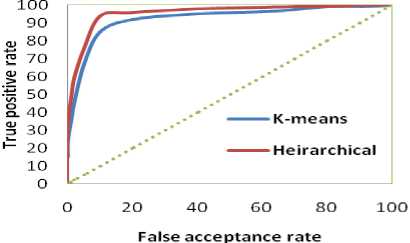
Figure 3: ROC curve for DTMGMM for JNTUK
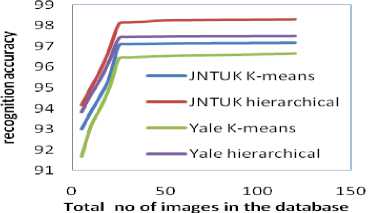
Figure 4: Recognition rate for different databases using DTMGMM
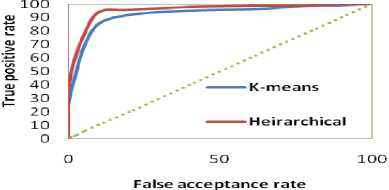
Figure 5: ROC curve for DTMGMM using YALE
TABLE I. Recognition rates using DTGMM
|
Database |
Recognition system |
HTER |
Recognition rate |
|
JNTUK |
DTMGMM with K- means |
2.66 |
97.18+0.8 |
|
DTMGMM with hierarchical |
2.0835 |
98.33+0.7 |
|
|
Yale |
DTMGMM with K- means |
2.0835 |
96.67+0.7 |
|
DTMGMM with hierarchical |
2.5 |
97.5+0.9 |
TABLE II. The values of HTER and recognition rate for different databases using DTMGMM
|
Total number of images |
K-means algorithm |
Hierarchical clustering algorithm |
||||||
|
JNTUK |
Yale |
JNTUK |
Yale |
|||||
|
HTER |
Recognition rate |
HTER |
Recognition rate |
HTER |
Recognition rate |
HTER |
Recognition rate |
|
|
5 |
4.167 |
93 |
4.25 |
91.667 |
4.13 |
94.167 |
4.167 |
93.833 |
|
10 |
3.333 |
93.833 |
4.167 |
92.667 |
2.66 |
95 |
3.083 |
94.667 |
|
15 |
3.832 |
94.6 |
3.333 |
93.667 |
2.5 |
95.833 |
2.915 |
95.4 |
|
20 |
2.833 |
95.4 |
3.333 |
94.667 |
3.083 |
96.867 |
2.66 |
96.3 |
|
25 |
3.083 |
96.2 |
2.915 |
95.45 |
2.084 |
97.5 |
3.832 |
97 |
|
30 |
2.915 |
97.105 |
3.333 |
96.48 |
2.66 |
98.17 |
2.833 |
97.448 |
|
40 |
2.833 |
97.12 |
3.25 |
96.51 |
2.915 |
98.22 |
2.583 |
97.458 |
|
50 |
3.75 |
97.135 |
3.083 |
96.54 |
3.333 |
98.27 |
2.583 |
97.464 |
|
60 |
2.833 |
97.15 |
3.25 |
96.57 |
2.583 |
98.28 |
2.66 |
97.47 |
|
80 |
2.666 |
97.165 |
3.25 |
96.61 |
2.084 |
98.3 |
2.5 |
97.48 |
|
100 |
2.915 |
97.173 |
2.915 |
96.65 |
2.66 |
98.32 |
2.66 |
97.49 |
|
110 |
3.75 |
97.177 |
3.083 |
96.66 |
2.5 |
98.325 |
2.5 |
97.495 |
|
120 |
2.66 |
97.18 |
2.915 |
96.67 |
2.084 |
98.33 |
2.5 |
97.5 |
TABLE III. RECOGNITION RATES OF DIFFERENT FACE RECOGNITION SYSTEM
|
Database |
Recognition system |
HTER |
Recognition rate |
|
JNTUK |
GMM and K-means under DCT |
5.5834 |
88.33+1.5 |
|
GMM and hierarchical under DCT |
4.75 |
90+1.3 |
|
|
GMM and K-means under logarithm DCT |
5.583 |
90.83+1.3 |
|
|
GMM and hierarchical under logarithm DCT |
5.165 |
91.67+1.2 |
|
|
DTMGMM and K-means under DCT |
3.748 |
96.7+1.3 |
|
|
DTMGMM and hierarchical under DCT |
3.333 |
97.5+0.9 |
|
|
DTMGMM and K-means under logarithm DCT |
2.66 |
97.18+0.8 |
|
|
DTMGMM and hierarchical under logarithm DCT |
2.084 |
98.33+0.7 |
|
|
Yale |
GMM and K-means under DCT |
6 |
87.5 +2.1 |
|
GMM and hierarchical under DCT |
5.167 |
89.17+1.8 |
|
|
GMM and K-means under logarithm DCT |
5.95 |
90.1 + 1.9 |
|
|
GMM and hierarchical under logarithm DCT |
5.467 |
91.07+1.8 |
|
|
DTMGMM and K-means under DCT |
4.167 |
95.83+1.2 |
|
|
DTMGMM and hierarchical under DCT |
3.749 |
96.93+0.8 |
|
|
DTMGMM and K-means under logarithm DCT |
2.084 |
96.67+0.7 |
|
|
DTMGMM and hierarchical under logarithm DCT |
2.5 |
97.5+0.9 |
О 20 40 60 80 100
False acceptance rate ---DCT DTMGMM K-means ----DCT DTMGMM hierarchical
----logarithm DCT DTMGMM K-means ----logarithm DCT DTMGMM heirarchical
DCT GMM K-means DCT GMM hiearchical logarithm DCT GMM K-means logarithm DCT GMM hierarchical
Figure 6: ROC curve for DCT and DCT in logarithm domain using GMM and DTMGMM for JNTUK
TABLE IV. Recognition rates
|
Total number of images |
Recognition rates |
|||||||
|
K-means algorithm |
hierarchical clustering algorithm |
|||||||
|
JNTUK |
Yale |
JNTUK |
Yale |
|||||
|
DCT |
logarithm DCT |
DCT |
logarithm DCT |
DCT |
logarithm DCT |
DCT |
logarithm DCT |
|
|
5 |
92.5 |
93 |
90.833 |
91.667 |
93.3333 |
94.167 |
93 |
93.833 |
|
10 |
93.3333 |
93.833 |
92.5 |
92.667 |
94.1667 |
95 |
93.667 |
94.667 |
|
15 |
94.1667 |
94.6 |
93.333 |
93.667 |
95 |
95.833 |
94.667 |
95.4 |
|
20 |
95 |
95.4 |
94.167 |
94.667 |
95.8333 |
96.867 |
95.437 |
96.3 |
|
25 |
95.8333 |
96.2 |
94.8 |
95.45 |
96.6667 |
97.5 |
96.3 |
97 |
|
30 |
96.3 |
97.105 |
95.4 |
96.48 |
97 |
98.17 |
96.667 |
97.448 |
|
40 |
96.65 |
97.12 |
95.805 |
96.51 |
97.4964 |
98.22 |
96.891 |
97.458 |
|
50 |
96.6682 |
97.135 |
95.810 |
96.54 |
97.4974 |
98.27 |
96.897 |
97.464 |
|
60 |
96.6751 |
97.15 |
95.815 |
96.57 |
97.4981 |
98.28 |
96.903 |
97.47 |
|
80 |
96.6835 |
97.165 |
95.821 |
96.61 |
97.4991 |
98.3 |
96.915 |
97.48 |
|
100 |
96.6884 |
97.173 |
95.827 |
96.65 |
97.4996 |
98.32 |
96.925 |
97.49 |
|
110 |
96.6966 |
97.177 |
95.829 |
96.66 |
97.4998 |
98.325 |
96.93 |
97.495 |
|
120 |
96.7 |
97.18 |
95.83 |
96.67 |
97.5 |
98.33 |
96.934 |
97.5 |
-
VIII. COMPARATIVE STUDY
In this section a comparative study of the developed face recognition system based on DTMGMM with K-means and face recognition system based on DTMGMM with hierarchical clustering algorithms under logarithm DCT domain with the face recognition systems developed based on DTGMM with K-means or hierarchical clustering algorithm using DCT coefficients and the face recognition systems based on GMM with K-means or Hierarchical clustering under both DCT domain and logarithm DCT domain is given (Haritha et al.,(2012)).
Table III presents the half error rate and recognition rates with their confidence intervals for the face recognition system of (i) DTMGMM and K-means under logarithm DCT domain, (ii) DTMGMM and Hierarchical under logarithm DCT domain, (iii) DTMGMM and K-means under DCT, (iv) DTMGMM and Hierarchical under DCT, (v) GMM and K-means under logarithm DCT domain, (vi) GMM and Hierarchical under logarithm DCT domain, (vii) GMM and K-means under DCT and (viii) GMM and Hierarchical under DCT for JNTU database.
From Table III, it is observed that the recognition rate of the face recognition system based on DTMGMM and hierarchical clustering under logarithm DCT domain is having 98.33% with confidence interval of ± 0.7 and it is much superior than other face recognition models given in Table III. It is also observed that for the face recognition systems based on both DTMGMM and GMM are having higher recognition rates for the feature vector considered with DCT logarithmic domain than that of DCT without logarithmic domain. This clearly shows the face recognition system can be improved with a higher recognition rate by adopting logarithm DCT coefficients which compensate illumination and normalize the image capturing conditions.
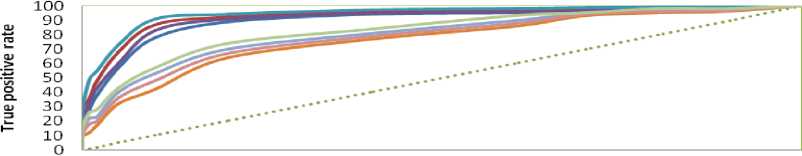
The Figure 6 shows the ROC curves of the face recognition systems of (i) DTMGMM and K-means under logarithm DCT domain, (ii) DTMGMM and Hierarchical under logarithm DCT domain, (iii) DTMGMM and K-means under DCT, (iv) DTMGMM and Hierarchical under DCT, (v) GMM and K-means under logarithm DCT domain, (vi) GMM and Hierarchical under logarithm DCT domain, (vii) GMM and K-means under DCT and (viii) GMM and Hierarchical under DCT for JNTU database.
From Figure 6, it is observed that the face recognition system based on DTMGMM with hierarchical under logarithmic domain is better compared to other face recognition systems. It also shows that the face recognition systems based on DTMGMM successfully identifies the claimant’s face. The ROC curves are observed as above the diagonal line indicates that the face recognition systems are having good recognition rates. However, the face recognition system using logarithm DCT domain performs better than that of other systems because the proposed system minimizes the effect of illumination on the face image.
The Figure 6 shows the ROC curves of the face recognition systems of (i) DTMGMM and K-means under logarithm DCT domain, (ii) DTMGMM and Hierarchical under logarithm DCT domain, (iii) DTMGMM and K-means under DCT, (iv) DTMGMM and Hierarchical under DCT, (v) GMM and K-means under logarithm DCT domain, (vi) GMM and Hierarchical under logarithm DCT domain, (vii) GMM and K-means under DCT and (viii) GMM and Hierarchical under DCT for JNTU database.
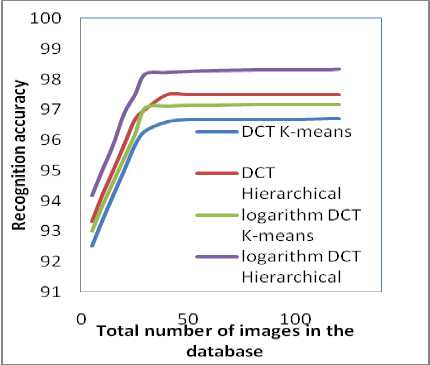
Figure 7: Recognition rate for JNTUK database
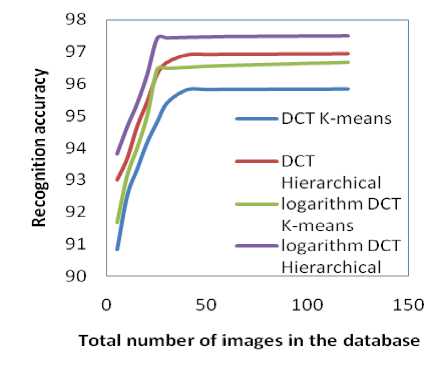
Figure 8: Recognition rate for Yale database
A comparative study on number of images in the database and the recognition rates of the systems is also carried to study the effect of size of database on the performance of the face recognition system. Figure 7 and Figure 8 show the relationships between recognition rate and the no of images in the database for JNTUK and Yale.
From the Table IV and Figure 7 and 8, it is observed that the number of images in the databases have a significant influence on the recognition rates, when the size is very small (below 10). However, in all the systems the recognition rate increases upto 25 and stabilizes thereafter. Here also it is observed the recognition rate stabilizes at a much lower size of 25 images for the face recognition systems with logarithm DCT domain. This clearly shows by considering the logarithm DCT domain effectively improve the face recognition system accuracy even for small and large databases.
-
IX. CONCLUSION
A face recognition system based on doubly truncated multivariate Gaussian mixture model with DCT coefficients under logarithm domain is developed and analyzed. Here, the pixel intensities of each individual face image in the database are pre-processed to eliminate illumination and to make normalization by considering logarithmic transformations. The feature vector extraction is done by computing the DCT coefficients under logarithm domain of the face image of each individual face. Illumination variation usually lies in the low frequency band. So, the low frequency components of the face image are removed by making the low frequency DCT coefficients to zero. This significantly reduces the illumination variation in the face image. The feature vectors of the DCT coefficients under logarithmic domain of the face image data are computed and modeled by using doubly truncated multivariate Gaussian mixture model. The model parameters are estimated by using Expectation Maximization algorithm (EM algorithm). The initialization of the model parameters is done through the feature vector of the face image components obtained through K-means or hierarchical clustering and moment’s method of estimation. A face recognition algorithm with maximum likelihood under Bayesian frame using threshold for the difference between the estimated likelihoods of claimants and imposters is developed and analyzed.
The efficiency of the developed face recognition system is studied by conducting experimentation with two face image databases, namely, JNTUK and Yale. The performance of the developed algorithm is studied by computing the recognition rates, false acceptance rate, false rejection rate, true positive rate and half total error rate. From the ROC curves, it is observed the developed models perform better. It is observed that for the face recognition systems based on DTMGMM are having higher recognition rates for the feature vector considered with DCT under logarithmic domain than that of DCT without logarithmic domain. This shows that the face recognition system can be improved by adopting DCT under logarithm domain, which compensate illumination and normalize the image capturing conditions.
References Face Recognition System Using Doubly Truncated Multivariate Gaussian Mixture Model and DCT Coefficients Under Logarithm Domain
- Adini Y., Moses Y., and Ullman S. Face recognition: the Problem of compensating for Changes in Illumination Direction. IEEE Trans. Pattern Analysis and Machine Intelligence, 1997, 19(7): 721-732.
- Annalisa Franco and Loris Nanni. Fusion of classifiers for illumination robust face recognition. International journal of Expert Systems and Applications, 2009, 36(5): 8946-8954.
- Athinodoros S. Georghiades, Peter N. Belhumeur and David J. Kriegman. From Few to Many: Illumination Cone Models for Face Recognition under Variable Lighting and Pose. IEEE transactions on pattern analysis and machine intelligence, 2001, 23(6): 643-660.
- Bailly-Bailliere E. and etc. The banca database and evaluation protocol. International conference on Audio and Video based Biometric Person Authentication, 2003, 625-638.
- Claudio A. Perez and Luis E. Castillo. Genetic improvements in illumination compensation by the discrete cosine transform and local normalization for face recognition. Proceedings of international symposium on Optomechatronic Technologies, 2008, 7266: 1-5.
- Conrad Sanderson, Fabien Cardinaux and Samy Bengio. On Accuracy/Robustness/ Complexity Trade-Offs in Face Verification. Proceedings of the Third International Conference on Information Technology and Applications (ICITA’05), 2005, 638-645.
- Gross R. and Brajovic V. An image Pre-processing algorithm for illumination invariant face recognition. Proc. 4th International Conference on Audio- and Video-Based Biometric Person Recognition (AVBPA), 2003, 10-18.
- Gonzalez R. and Woods R. Digital Image Processing. Prentice Hall, New Jersey, 1992.
- Haritha D., Srinivasa Rao K. and Satyanarayana Ch. Face recognition algorithm based on doubly truncated Gaussian mixture model using DCT coefficients. International journal of Computer Applications, 2012, 39(9): 23-28.
- Haritha D., Srinivasa Rao K. and Satyanarayana Ch. Face recognition algorithm based on doubly truncated Gaussian mixture model using hierarchical clustering algorithm coefficients. International journal of Computer science issues, 2012, 9(2): 388-395.
- Hazım Kemal Ekenel and Rainer Stiefelhagen. Automatic Frequency Band Selection for Illumination Robust Face Recognition. Proc. of 20th international conference on Pattern Recognition, 2010, 2684-2687.
- Kalpana.C. Jondhale. Performance Analysis of DVT in Logarithm Domain and Two -Point Normalization Method for Illumination and Expression Variation in Face Recognition. IEEE international conf. on computer science and Technology, 2010, 122-125.
- Messer K., Matas J., Kittler J., Luettin j. and Maitre G. Xm2vtsdb: The extended m2vts database. International conference on Audio and Video Based Person Authentication, 1999, 964: 965-966.
- Qian Tao and Raymond Veldhuis. Illumination normalization based on simplified local binary patterns for a face verification system. IEEE international Symposium on Biometrics, 2007, 1-6.
- Satyanarayana Ch., Potukuchi D. M. and Pratap Reddy L. Performance Incremental training method for face Recognition using PCA. Springer, proceeding of the international journal of real image processing, 2007, 1(4): 311-327.
- Satyanarayana Ch., Haritha D., Neelima D. and Kiran kumar B. Dimensionality Reduction of Covariance matrix in PCA for Face Recognition. Proceedings of the International conference on Advances in Mathematics: Historical Developments and Engineering Applications (ICAM 2007), 2007, 400-412.
- Satyanarayana Ch., Haritha D., Sammulal P. and Pratap Reddy L. updation of face space for face recognition using PCA. Proceedings of the international conference on RF & signal processing system (RSPS-08), 2008, 1: 195-202.
- Satyanarayana Ch., Haritha D., Sammulal P. and Pratap Reddy L. Incremental training method for face Recognition using PCA. proceeding of the international journal of Information processing, 2009, 3(1): 13-23.
- Satyanarayana Ch., Prasad PVRD., Mallikarjuna Rao G., Haritha D., Pratap Reddy L. A Comparative performance evaluation using PCA for Face Recognition. Proceeding of the international journal of Science & Technology, 2008, 4(4):. 8-16.
- Shan S., Gao W., Cao B., and Zhao D. Illumination normalization for robust face recognition against varying lighting conditions. Proc. IEEE workshop on Analysis and Modelling of Faces and Gestures, 2003, 157-164.
- Shan Du and Ward R. Wavelet-based illumination normalization for face recognition. Proc. of IEEE International Conference on Image Processing, 2005, 2: 954-957.
- Short J. Illumination Invariance for Face verification. PhD thesis, University of surrey, 2006.
- Short J., Kittler J., and Messer K. A comparison of photometric normalisation algorithm for face verification. Proc. Int’l Conf. AFGR, 2004, 254-259.
- Weilong chen, Meng Joo Er and Shiqian Wu. Illumination Compensation and Normalization Using Logarithm and Discrete Cosine Transform, 8th international conference on Control, Automation, Robotics and vision Kunming, IEEE, 2004.
- Xudong Xie and Kin-Man Lam. An efficient illumination normalization method for face recognition. Pattern Recognition Letters, 2006, 27: 609–617.
- Zhao W. and Chellappa R. Robust Face Recognition Using symmetric Shape-from-Shading, technical report, Center for Automation Research Univ. of Maryland, 1999.
- Zhao W., Chellappa R., and Rosenfeld A. Face Recognition: A literature survey. ACM Computing surveys, 2003, 35: 399-458.
- Ziad M. Hafed and Martin D. Levine. Face Recognition using Discrete Cosine Transform. Proc. International Journal of Computer Vision, 2001, 43(3): 167–188.
