Facial Expression Recognition Based on Features Derived From the Distinct LBP and GLCM

Author: Gorti Satyanarayana Murty, J Sasi Kiran, V.Vijaya Kumar
Journal: International Journal of Image, Graphics and Signal Processing(IJIGSP) @ijigsp
Article in issue: 2 vol.6, 2014.
Free access
Automatic recognition of facial expressions can be an important component of natural human-machine interfaces; it may also be used in behavioural science and in clinical practice. Although humans recognise facial expressions virtually without effort or delay, reliable expression recognition by machine is still a challenge. This paper, presents recognition of facial expression by integrating the features derived from Grey Level Co-occurrence Matrix (GLCM) with a new structural approach derived from distinct LBP’s (DLBP) ona 3 x 3 First order Compressed Image (FCI). The proposed method precisely recognizes the 7 categories of expressions i.e.: neutral, happiness, sadness, surprise, anger, disgust and fear. The proposed method contains three phases. In the first phase each 5 x 5 sub image is compressed into a 3 x 3 sub image. The second phase derives two distinct LBP’s (DLBP) using the Triangular patterns between the upper and lower parts of the 3 x 3 sub image. In the third phase GLCM is constructed based on the DLBP’s and feature parameters are evaluated for precise facial expression recognition. The derived DLBP is effective because it integrated with GLCM and provides better classification performance. The proposed method overcomes the disadvantages of statistical and formal LBP methods in estimating the facial expressions. The experimental results demonstrate the effectiveness of the proposed method on facial expression recognition.
Distinct LBP, First Ordered Compressed Image, Statistical, Structural approaches, Triangular pattern
Short address: https://sciup.org/15013221
IDR: 15013221
Text of the scientific article Facial Expression Recognition Based on Features Derived From the Distinct LBP and GLCM
Published Online January 2014 in MECS
A facial expression is a visible manifestation of the affective state, cognitive activity, intention, personality, and psychopathology of a person [14]; it plays a communicative role in interpersonal relations. Facial
Copyright © 2014 MECS expressions, and other gestures, convey non-verbal communication cues in face-to-face interactions. These cues may also complement speech by helping the listener to elicit the intended meaning of spoken words. As cited in [15] (p. 1424), Mehrabian reported that facial expressions have a considerable effect on a listening interlocutor; the facial expression of a speaker accounts for about 55 percent of the effect, 38 percent of the latter is conveyed by voice intonation and 7 percent by the spoken words.
There is a duality existing between facial expression recognition and face recognition. In the literature, the similar processing techniques are often used forboth recognition tasks.
Many statistical approaches are existed for face analysis, which include such techniques as linear discriminant analysis (LDA) [2], independent component analysis (ICA) [3], principal component analysis (PCA) [1] and support vector machine (SVM) [4]. These methods suffer from the generalization problem, which might be far different from that of the training face images. To avoid this problem, non-statistical face analysis method using local binary pattern (LBP) has been proposed.
Initially, LBP was first introduced by Ojala et al. [5] , which showed a high discriminative power for texture classification due to its invariance to monotonic gray level changes.The Facial Action Coding System (FACS) has been widely used to study detailed facial movements for decades. FACS enumerates the possible movements of the human face as facial action units . Thus, FACS has become an objective measure used to identify facial expressions. Fasel and Luettin performed an in depth study in an attempt to understand the sources that drive expressions [6] from FACS. Their results indicate that using FACS may incorporate other sources of emotional stimulus including non-emotional mental and physiological aspects used in generating emotional expressions.
The ‘eigenfaces’ method developed by Turk and Pentland [7] also used for face recognition and related areas. Although a successful method for simple face recognition, this technique would lack feature specificity of underlying muscle movements appropriate to facial expressions. Many researchers used other feature extraction methods including image-processing techniques such as Gabor filters and wavelets for effective facial expression identification. Bartlett used a similar approach for feature extraction employing a cascade of classifiers used to locate the best filters for feature extraction [8]. Michel and Kaliouby used a method for extracting features [9]. Their method employs a feature point tracking system similar to active shape models. According to their research, Cohen suggests that using feature point tracking shows on average a 92% agreement with manual FACS coding by professionals [10]. The above literature has its own limitations to recognize facial expression. To avoid such problems a novel method is derived for facial expressions in the present paper. The entire paper is organized as follows. In section 2, the methodology is presented. The section 3 contains the results and discussions followed by comparison with recent methods. Conclusions are presented in the section four.
-
II. METHODOLOGY
Derivation of facial expression using the features derived from Grey Level Co-occurrence Matrix (GLCM) based onDLBP’s of First order Compressed Image (FCI). Most of the statistical methods [1,2,3,4] suffer from the generalization problem due to the unpredictable distribution of the face images in real environment, which might be far different from that of the training face images. The structural method like LBP suffers from illumination effect. To avoid these problems in the statistical and structural methods, the present paper combined structural and statistical methods using the proposed DLBP and GLCM features. The proposed method consists of seven steps described below.
STEP 1: RGB to HSV color model conversion
In color image processing, there are various color models in use today. In order to extract gray level features from color information, the proposed method utilized the HSV color space. In the RGB model, images are represented by three components, one for each primary color – red, green and blue. Hue is a color attribute and represents a dominant color. Saturation is an expression of the relative purity or the degree to which a pure color is diluted by white light. HSV color space is a non-linear transform from RGB color space that can describe perceptual color relationship more accurately than RGB color space.
STEP 2: Cropping of Image:
The grey scale facial image is cropped based on the two eyes location; Fig.1 shows an example of the original facial image and the cropped image.
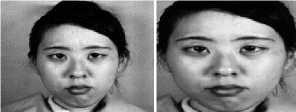
Figure 1. (a) original image (b) cropped image
Conversion of 5×5 window into 3×3 window
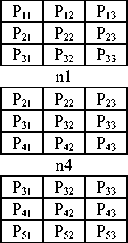
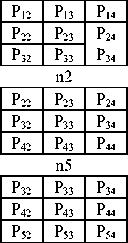
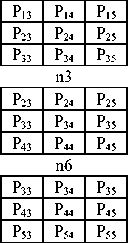
STEP 3: Formation of nine overlapped sub 3 x 3 neighborhoods from a 5 x 5 neighborhood: A neighborhood of 5x5 pixels is denoted by a set containing 25 pixel elements: P= {P 11 … P 15: P 21….. P25:P31 ...P35: P41… P45: P51…. P55}, here P33 represents the intensity value of the central pixel and remaining values are the intensity of neighboring pixels as shown in Fig. 2.
|
P 11 |
P 12 |
P 13 |
P 14 |
P 15 |
|
P 21 |
P 22 |
P 23 |
P 24 |
P 25 |
|
P 31 |
P 32 |
P 33 |
P 34 |
P 35 |
|
P 41 |
P 42 |
P 43 |
P 44 |
P 45 |
|
P 51 |
P 52 |
P 53 |
P 54 |
P 55 |
Figure 2. Representation of a 5 x 5 neighborhood
n6
n7
n8
Figure 3. Formation of nine overlapped 3 x 3 neighborhoods {n1, n2, n3… n9} from Fig. 2.
STEP 4: F ormation of “First order Compressed Image Matrix (FCIM)” of size 3 x 3 from 5 x 5: In step four, from each overlapped 3 x 3 sub matrix of step three , a pixel value for the FCIM of size 3 x 3 is obtained as given in equation 1.1. The FCIM is a 3 x 3 matrix with nine pixel elements (FCP1 to FCP9) as shown in the Fig.
-
4. The FCIM maintains the local neighborhood properties including edge information.
FCP i =Avg of (n i )for i = 1, 2,…9 (1.1)
|
FCP 1 |
FCP 2 |
FCP 3 |
|
FCP 4 |
FCP 5 |
FCP 6 |
|
FCP 7 |
FCP 8 |
FCP 9 |
Figure 4.Representation of grey level FCIM
STEP 5: LBP on FCIM: The FCIM of Fig.4 is converted in to binary based on LBP method as given the equations 1.2 and 1.3
FCP i = 0 if FCP i < FCP 5 (1.2)
FCP i = 1 if FCP i >= FCP 5 (1.3)
STEP 6: Formation of two Distinct LBP’s (DLBP) on FCIM of Step 5: From the binary FCIM of 3 x 3 neighborhoods four Triangular LBP unit values are derived as shown in Fig.5. Each Triangular LBP unit value contains only three pixels, thus it can have a maximum value of seven. To have rotationally invariance the minimum value is chosen for each Triangular LBP. The Upper TLBP’s (UTLBP) i.e TLBP 1 and TLBP 2 are formed from the combination of pixels FCP 1 , FCP 2 , FCP 4 and , FCP 2 , FCP 3 , FCP 6 respectively. The Lower TLBP’s (LTLBP) i.e TLBP 3 and TLBP 4 are formed from the combination of pixels FCP 4 , FCP 7 , FCP 8 and , FCP 6 , FCP 8 , FCP 9 respectively. Based on this, two DLBP’s are evaluated. The two DLBP’s are formed from sum of UTLBP (SUTLBP) and sum of LTLBP (SLTLBP) values of FCIM as given in equations 1.4 and 1.5.
SUTLBP = TLBP 1 + TLBP 2 (1.4)
STEP 7: Formation of GLCM based on DLBP of FCIM: The present paper derived a new method for formation of GLCM based on two DLBP’s i.e.: SUTLBP and SLTLBP values of FCIM. The new GLCM is named as “GLCM on DLBP”. The GLCM on DLBP is obtained by representing the SUTLBP values on X- axis and SLTLBP values on Y-axis. This method has the elements of relative frequencies in both SUTLBP and SLTLBP, since the both values of SUTLBP and SLTLBP range from 0 to 14 only. Therefore the proposed GLCM on DLBP of FCIM will have a fixed size of 15×15.
-
III. RESULTS AND DISCUSSIONS
The present paper utilized four feature parameters defined by Haralicki.e.: contrast,homogeneity,energy and correlation as given in equations 1.6-1.9 respectively on facial images for effective and precise facial expression identification.The proposed GLCM on DLBP method gives complete information about an image. The size of GLCM depends on gray level range of the image. The proposed DLBP on FCI reduced size of the GLCM from 0 to 14 thus reduced overall complexity in evaluating feature parameters .
SLTLBP = TLBP 3 + TLBP 4 (1.5)
|
FCP1 |
FCP2 |
FCP3 |
|
FCP4 |
FCP5 |
FCP6 |
|
FCP7 |
FCP8 |
FCP9 |
(a)
SUTLBP
SLTLBP
UTLBP
LTLBP
(b) (c)
Figure 5. Formation of DLBP on FCIM a) Formation of Triangular LBP on FCIM b) Representation of UTLBP and LTLBP c) Formation of DLBP.
contrast = ∑ , -ln(P )(1.6)
Homogenity = ∑ , ( )(1.7)
Energy = ∑ , -ln(P )(1.8)
Correlation = ∑ , Р ( )( )(1.9)
The entire mechanism from shown in Fig. 6.
step one to step six is
|
139 |
128 |
131 |
134 |
132 |
134 |
133 |
135 |
||||||
|
142 |
140 |
127 |
133 |
138 |
|||||||||
|
134 |
132 |
134 |
|||||||||||
|
142 |
124 |
129 |
145 |
142 |
|||||||||
|
141 |
129 |
128 |
131 |
133 |
134 |
133 |
136 |
||||||
|
137 |
134 |
134 |
137 |
137 |
|||||||||
|
(a) |
(b) |
||||||||||||
|
1 |
1 |
1 |
7 |
7 |
14 |
||||||||
|
1 |
1 |
1 |
|||||||||||
|
7 |
7 |
14 |
|||||||||||
|
1 |
1 |
1 |
|||||||||||
|
(c) |
(d) |
(e) |
|||||||||||
Figure 6.Formation of DLBP on FCIM. (a) Original image (b) FCIM (c) LBP on FCIM (d) Formation of 4 triangular LBP on FCIM (e) formation of DLBP from SUTLBP andSLTLBP.
The proposed scheme established a database contains 213 images of female facial expressions. They were collected by Kamachi and Gyoba at Kyushu University [11], Japan. Ten expressers were asked to pose several different facial expressions. Each expresser, when ready, took pictures ofherself, through remote control, while looking towards the camera through a semi-reflective plastic sheet. Original images have been rescaled and cropped such that the eyes are roughly at the same position with a distance of 60 pixels in the final images (resolution: 256 pixels × 256 pixels). The number of images corresponding to each of the 7 categories of expression (neutral, happiness, sadness, surprise, anger,disgust and fear) is roughly the same. A few of them are shown in Fig.7.
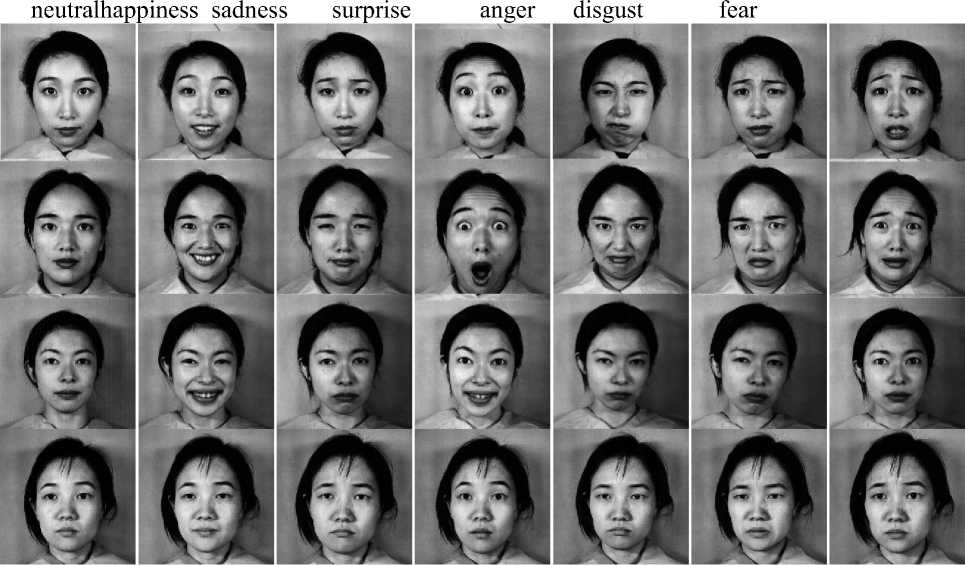
Figure 7.Facial expression database
In the proposed GLCM on DLBP of FCIM method, the sample images are grouped into seven categories of expression i.e. neutral, happiness, sadness, surprise, anger, disgust and fear. The features are extracted from GLCM on DLBP of different facial images and the results are stored in the feature database. Feature set leads to representation of the training images. The feature parameter values of seven categories of facial images are evaluated and tabulated in the table 1, 2, 3,4,5,6 and 7 respectively. To evaluate the proposed GLCM on DLBP method, 30 different facial expressions from Expression data base, Google database and scanned images are considered. The statistical features are extracted from the test images and the results are stored in the test database. The minimum distance between feature database and test database are estimated and stored in the library by using Euclidian distances. Based on this, Test images are classified into appropriate categories’using minimum distance K-nearest neighbor classifier. Successful classification results of test data bases for the proposed method are shown in table 8.
TABLE I. FEATURESETVALUESDERIVEDFROMTHEPROPOSEDGLCM ON DLBPFOR ANGEREXPRESSIONIMAGES
|
Sno |
Image Name |
Contrast |
Correlation |
Energy |
Homogeneity |
|
1 |
KA.AN1.39 |
37.01 |
0.015964 |
0.044 |
0.28327858 |
|
2 |
KA.AN2.40 |
35.77 |
0.095119 |
0.041 |
0.29409369 |
|
3 |
KA.AN3.41 |
37.42 |
0.017763 |
0.045 |
0.29059975 |
|
4 |
KL.AN1.167 |
38.49 |
0.013311 |
0.047 |
0.29213675 |
|
5 |
KL.AN2.168 |
37.27 |
0.023962 |
0.045 |
0.28502493 |
|
6 |
KL.AN3.169 |
37.16 |
0.02366 |
0.042 |
0.28753908 |
|
7 |
KM.AN1.17 |
34.7 |
0.063803 |
0.048 |
0.31161567 |
|
8 |
KM.AN2.18 |
35.54 |
0.068783 |
0.046 |
0.29589786 |
|
9 |
KM.AN3.19 |
35.91 |
0.074118 |
0.053 |
0.31266221 |
|
10 |
KR.AN1.83 |
40.36 |
-0.13046 |
0.04 |
0.23774582 |
|
11 |
KR.AN2.84 |
38.8 |
-0.11573 |
0.037 |
0.24726129 |
|
12 |
KR.AN3.85 |
39.4 |
-0.10166 |
0.043 |
0.24884007 |
|
13 |
MK.AN1.125 |
35.72 |
0.043293 |
0.045 |
0.29038379 |
|
14 |
MK.AN2.126 |
36.08 |
0.040376 |
0.043 |
0.29260514 |
|
15 |
MK.AN3.127 |
35.57 |
0.061949 |
0.042 |
0.29392202 |
TABLE II. FEATURESETVALUESDERIVEDFROMTHEPROPOSEDGLCM ON DLBP OF DISGUSTEXPRESSIONIMAGES
|
Sno |
Image Name |
Contrast |
Correlation |
Energy |
Homogeneity |
|
1 |
KA.DI1.42 |
36.43303571 |
0.042986 |
0.0453 |
0.2951643 |
|
2 |
KA.DI2.43 |
35.82440476 |
0.068164 |
0.04485 |
0.2980416 |
|
3 |
KA.DI3.44 |
35.97098214 |
0.054252 |
0.04982 |
0.3043289 |
|
4 |
KL.DI1.170 |
38.2202381 |
0.020021 |
0.04569 |
0.2952764 |
|
5 |
KL.DI2.171 |
38.78794643 |
0.006981 |
0.04378 |
0.2808898 |
|
6 |
KL.DI3.172 |
38.75446429 |
-0.03209 |
0.04219 |
0.2713537 |
|
7 |
KL.DI4.173 |
38.80729167 |
0.037175 |
0.05168 |
0.2940353 |
|
8 |
KM.DI1.20 |
36.75669643 |
0.022685 |
0.04747 |
0.2951725 |
|
9 |
KM.DI3.22 |
34.09077381 |
0.086991 |
0.04872 |
0.304971 |
|
10 |
KR.DI1.86 |
41.2827381 |
-0.17754 |
0.04141 |
0.228849 |
|
11 |
KR.DI2.87 |
40.24925595 |
-0.13144 |
0.04321 |
0.2416995 |
|
12 |
KR.DI3.88 |
41.77008929 |
-0.16405 |
0.0416 |
0.2312755 |
|
13 |
MK.DI1.128 |
36.43154762 |
0.037152 |
0.04385 |
0.2845721 |
|
14 |
MK.DI2.129 |
36.30803571 |
0.035537 |
0.04533 |
0.289835 |
|
15 |
MK.DI3.130 |
36.58407738 |
0.052007 |
0.04739 |
0.2944185 |
TABLE III.FEATURE SET VALUES DERIVED FROM THE PROPOSED GLCM ON DLBP OF HAPPINESS IMAGES
|
Sno |
Image Name |
Contrast |
Correlation |
Energy |
Homogeneity |
|
1 |
KA.HA1.29 |
38.34 |
-0.019 |
0.041 |
0.261 |
|
2 |
KA.HA2.30 |
38.39 |
-0.022 |
0.041 |
0.267 |
|
3 |
KA.HA3.31 |
37.91 |
-0.003 |
0.044 |
0.268 |
|
4 |
KA.HA4.32 |
38.48 |
-0.004 |
0.043 |
0.276 |
|
5 |
KL.HA1.158 |
38.37 |
0.033 |
0.048 |
0.295 |
|
6 |
KL.HA2.159 |
39.07 |
-0.01 |
0.048 |
0.284 |
|
7 |
KL.HA3.160 |
38.99 |
-0.01 |
0.045 |
0.28 |
|
8 |
KM.HA1.4 |
37.55 |
0.014 |
0.049 |
0.292 |
|
9 |
KM.HA2.5 |
36.29 |
0.058 |
0.049 |
0.298 |
|
10 |
KM.HA3.6 |
37.69 |
0.003 |
0.044 |
0.28 |
|
11 |
KM.HA4.7 |
36.93 |
0.048 |
0.049 |
0.3 |
|
12 |
KR.HA1.74 |
40.08 |
-0.12 |
0.036 |
0.239 |
|
13 |
KR.HA2.75 |
39.53 |
-0.114 |
0.042 |
0.242 |
|
14 |
KR.HA3.76 |
37.39 |
-0.009 |
0.042 |
0.265 |
|
15 |
MK.HA2.117 |
37.02 |
-0.019 |
0.043 |
0.266 |
TABLE IV. FEATURE SET VALUES DERIVED FROM THE PROPOSED GLCM ON DLBP OF NEUTRAL EXPRESSION IMAGES
|
Sno |
Image Name |
Contrast |
Correlation |
Energy |
Homogeneity |
|
1 |
KA.NE1.26 |
37.31 |
0.046 |
0.042 |
0.286 |
|
2 |
KA.NE2.27 |
38.53 |
-0.015 |
0.042 |
0.272 |
|
3 |
KA.NE3.28 |
38.58 |
-0.037 |
0.043 |
0.264 |
|
4 |
KL.NE1.155 |
37.45 |
0.011 |
0.05 |
0.298 |
|
5 |
KL.NE2.156 |
38.46 |
0.034 |
0.047 |
0.29 |
|
6 |
KL.NE3.157 |
37.15 |
-0.004 |
0.038 |
0.274 |
|
7 |
KM.NE1.1 |
37.51 |
0.051 |
0.049 |
0.304 |
|
8 |
KM.NE2.2 |
36.14 |
0.078 |
0.045 |
0.3 |
|
9 |
KM.NE3.3 |
34.88 |
0.118 |
0.052 |
0.318 |
|
10 |
KR.NE1.71 |
41.1 |
-0.139 |
0.041 |
0.235 |
|
11 |
KR.NE2.72 |
40.37 |
-0.134 |
0.042 |
0.237 |
|
12 |
KR.NE3.73 |
40.27 |
-0.108 |
0.04 |
0.241 |
|
13 |
MK.NE1.113 |
37.53 |
-0.034 |
0.044 |
0.269 |
|
14 |
MK.NE2.114 |
36.99 |
0.003 |
0.042 |
0.272 |
|
15 |
MK.NE3.115 |
37.43 |
-0.044 |
0.04 |
0.262 |
TABLE V. FEATURE SET VALUES DERIVED FROM THE PROPOSED GLCM ON DLBP OF SADNESS EXPRESSION IMAGES
|
Sno |
Image Name |
Contrast |
Correlation |
Energy |
Homogeneity |
|
1 |
KA.SA1.33 |
37.62 |
-0.021 |
0.042 |
0.28 |
|
2 |
KA.SA2.34 |
36.01 |
0.064 |
0.04 |
0.286 |
|
3 |
KA.SA3.35 |
37.2 |
-0.034 |
0.041 |
0.265 |
|
4 |
KL.SA1.161 |
37.71 |
0.028 |
0.048 |
0.298 |
|
5 |
KL.SA2.162 |
37.84 |
0.032 |
0.048 |
0.295 |
|
6 |
KL.SA3.163 |
36.05 |
0.06 |
0.046 |
0.301 |
|
7 |
KM.SA1.9 |
34.72 |
0.106 |
0.061 |
0.339 |
|
8 |
KM.SA2.10 |
35.64 |
0.057 |
0.051 |
0.309 |
|
9 |
KM.SA3.11 |
34.4 |
0.006 |
0.04 |
0.274 |
|
10 |
KM.SA5.13 |
35.26 |
0.002 |
0.044 |
0.286 |
|
11 |
KR.SA1.77 |
39 |
-0.088 |
0.04 |
0.243 |
|
12 |
KR.SA2.78 |
40.17 |
-0.124 |
0.042 |
0.24 |
|
13 |
KR.SA3.79 |
40.69 |
-0.125 |
0.041 |
0.233 |
|
14 |
MK.SA1.119 |
36.88 |
0.014 |
0.046 |
0.278 |
|
15 |
MK.SA2.120 |
36.3 |
-0.062 |
0.041 |
0.262 |
TABLE VI. FEATURE SET VALUES DERIVED FROM THE PROPOSED GLCM ON DLBP OF FEAR EXPRESSION IMAGES
|
Sno |
Image Name |
Contrast |
Correlation |
Energy |
Homogeneity |
|
1 |
KA.FE1.45 |
36.18 |
-0.002 |
0.041 |
0.277 |
|
2 |
KA.FE2.46 |
36.69 |
0.055 |
0.053 |
0.307 |
|
3 |
KA.FE3.47 |
35.83 |
0.077 |
0.049 |
0.309 |
|
4 |
KA.FE4.48 |
35.42 |
0.045 |
0.041 |
0.284 |
|
5 |
KL.FE1.174 |
38.03 |
0.007 |
0.047 |
0.292 |
|
6 |
KL.FE2.175 |
36.63 |
0.066 |
0.049 |
0.297 |
|
7 |
KL.FE3.176 |
38.45 |
-0.013 |
0.049 |
0.292 |
|
8 |
KM.FE1.23 |
36.85 |
0.074 |
0.051 |
0.312 |
|
9 |
KM.FE2.24 |
34.57 |
0.023 |
0.043 |
0.277 |
|
10 |
KM.FE3.25 |
34.9 |
0.07 |
0.05 |
0.311 |
|
11 |
KR.FE1.89 |
40.93 |
-0.156 |
0.039 |
0.233 |
|
12 |
KR.FE2.90 |
41.16 |
-0.15 |
0.042 |
0.231 |
|
13 |
KR.FE3.91 |
40.25 |
-0.141 |
0.041 |
0.23 |
|
14 |
MK.FE2.131 |
35.79 |
0.077 |
0.046 |
0.293 |
|
15 |
MK.FE3.132 |
36.74 |
0.03 |
0.043 |
0.281 |
TABLE VII. FEATURE SET VALUES DERIVED FROM THE PROPOSED GLCM ON DLBP OF SURPRISE EXPRESSION IMAGES
|
Sno |
Image Name |
Contrast |
Correlation |
Energy |
Homogeneity |
|
1 |
KA.SU1.36 |
37.3 |
-0.018 |
0.041 |
0.263 |
|
2 |
KA.SU2.37 |
38.04 |
-0.049 |
0.041 |
0.262 |
|
3 |
KA.SU3.38 |
37.72 |
0.007 |
0.041 |
0.28 |
|
4 |
KL.SU1.164 |
36.18 |
0.047 |
0.043 |
0.289 |
|
5 |
KL.SU2.165 |
37.23 |
0.029 |
0.045 |
0.282 |
|
6 |
KL.SU3.166 |
37.16 |
0.057 |
0.046 |
0.286 |
|
7 |
KM.SU1.14 |
36.66 |
0.058 |
0.048 |
0.296 |
|
8 |
KM.SU2.15 |
36.54 |
0.047 |
0.05 |
0.303 |
|
9 |
KM.SU3.16 |
35.57 |
0.073 |
0.047 |
0.303 |
|
10 |
KR.SU1.80 |
39.88 |
-0.113 |
0.041 |
0.241 |
|
11 |
KR.SU2.81 |
39.86 |
-0.115 |
0.041 |
0.241 |
|
12 |
KR.SU3.82 |
40.05 |
-0.123 |
0.041 |
0.232 |
|
13 |
MK.SU1.122 |
37.11 |
-0.039 |
0.041 |
0.26 |
|
14 |
MK.SU2.123 |
36.84 |
0.02 |
0.043 |
0.279 |
|
15 |
MK.SU3.124 |
36.64 |
-0.021 |
0.041 |
0.272 |
TABLE VIII.SUCCESS RATE EVALUATION BY THE PROPOSED GLCM ON DLBP OF FCIM METHOD WITH DIFFERENT FACIAL EXPRESSIONS
|
Sno |
Image Name |
Contrast |
Correlation |
Energy |
Homogeneity |
Group |
Result |
|
1 |
TM.AN1.190 |
34.8 |
0.0715 |
0.043 |
0.29772 |
Anger |
Success |
|
2 |
UY.SU2.144 |
34.17 |
0.0685 |
0.045 |
0.29571 |
Surprise |
Success |
|
3 |
KL.NE2.156 |
38.46 |
0.0339 |
0.047 |
0.29042 |
Neutral |
Success |
|
4 |
UY.SA1.140 |
33.69 |
0.0964 |
0.041 |
0.29785 |
Sadness |
Success |
|
5 |
YM.DI2.65 |
34.15 |
0.105 |
0.047 |
0.30844 |
Disgust |
Success |
|
6 |
NA.HA3.204 |
36.8 |
-0.08 |
0.041 |
0.25138 |
Happiness |
Success |
|
7 |
MK.FE2.131 |
35.79 |
0.0769 |
0.046 |
0.29306 |
Fear |
Success |
|
8 |
gogl_img_01 |
35.22 |
0.0491 |
0.045 |
0.28407 |
Surprise |
Success |
|
9 |
gogl_img_02 |
36.14 |
0.1181 |
0.041 |
0.23704 |
Neutral |
Success |
|
10 |
gogl_img_03 |
34.4 |
0.0018 |
0.04 |
0.24303 |
Sadness |
Success |
|
11 |
gogl_img_04 |
41.28 |
-0.131 |
0.042 |
0.28457 |
Disgust |
Success |
|
12 |
gogl_img_05 |
37.02 |
-0.009 |
0.042 |
0.23882 |
Happiness |
Success |
|
13 |
gogl_img_06 |
41.16 |
-0.141 |
0.046 |
0.28059 |
Fear |
Success |
|
14 |
gogl_img_07 |
40.27 |
-0.134 |
0.052 |
0.31807 |
Neutral |
Success |
|
15 |
gogl_img_08 |
38.8 |
-0.102 |
0.045 |
0.29261 |
Anger |
Success |
K-nearest neighbor is more general than the nearest neighbor. In other words, nearest neighbor is a special case of k-nearest-neighbor, the proposed method evaluated accuracy rate with different k values i.e. 1,3 and 5 and tabulated in table 9. from table9, it is clearly evident that for k=1 results on optimal value.
TABLE IX. ACCURACY RATE USING DIFFERENT VALUES OF K WITH KNN CLASSIFIER BY THE PROPOSED FEATURE VECTOR DERIVED FROM GLCM ON DLBP OF FCIM
|
NN classifiers with different K values |
No of training samples |
No of test samples |
Accuracy in percentage |
|
K=1 |
213 |
30 |
96.67 |
|
K=3 |
213 |
30 |
91.7 |
|
K=5 |
213 |
30 |
86.6 |
A. COMPARISON OF THE PROPOSED GLCM ON DLBP CLASSIFIER WITH OTHER EXISTING METHODS.
Table 10 shows the classification rate for various group of images by the proposed GLCM on DLBP classifier method with other existing methods like feature-based facial expression recognition within an architecture based on a two-layer perception ofZhengyou Zhang[12] and Facial expression analysis by Dela Torre et.al [13]. From table 10, it is clearly evident that, the proposed method exhibits a high classification rate than the existing methods. The graphical representation of the percentage mean classification rate for the proposed method and other existing methods are shown in Fig.8.
TABLE X. CLASSIFICATIONRATEOFTHEPROPOSEDG LCM ON DLBP OF FCIM
METHODWITHOTHEREXISITINGMETHODS
|
Image Dataset |
Architecture based on a two-layer perception |
Facial expression analysis |
Proposed Method |
|
Original |
80.29 |
91.79 |
96.67 |
|
|
81.53 |
89.56 |
96.67 |
|
Scanned |
82.34 |
90.43 |
96.67 |
|
Average |
81.39 |
90.59 |
96.67 |
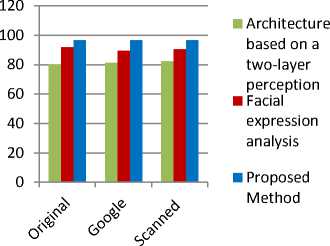
Figure 8.Classification chart of proposed GLCM on DLBP of FCIM with other existing methods
-
IV. CONCLUSIONS
The present paper developed an integrated approach by combining the structural and statistical methods on FCI that outperforms the statistical and other face analysis methods in terms of recognition performance and the robustness to illumination change. Thus the proposed integrated method represents complete information of the facial image. The proposed GLCM on DLBP of FCI is a three phase model for recognizing facial expressions. In the first Phase it, reduced the 5x 5 image in to a 3x 3 sub image without losing any significant information. In the second and third phases GLCM features are derived on Distinct LBP. The computational cost and other complexity involved in the formation of GLCM are reduced, by reducing the size of the GLCM by 15 x 15 using DLBP. The proposed method overcomes the unpredictable distribution of the face images in real environment caused by statistical methods and illumination problems caused by LBP. Comparison of the recognition performance with different methods shows the superiority of the proposed method.
ACKNOWLEDGEMENT
The authors would like to express their gratitude to Dr. P. Rajeshwar Reddy, Chairman, Anurag Group of Institutions (AGOI), Hyderabad for providing necessary infrastructure for Centre for Advanced Computational Research (CACR) at AGOI, which is bringing various research scholars across the nation to work under one proof. The CACR is providing a research platform for exchanging and discussing various views on different research topics in CSE. Authors extended their gratitude to Prof. V VNageswara Rao, Director, Aditya Institute ofTechnology and Management (AITAM), Tekkali, A.P. India for promoting the young staff members towards research activities.
References Facial Expression Recognition Based on Features Derived From the Distinct LBP and GLCM
- M. Turk, A. Pentland, Eigenfaces for recognition, Journal of Cognitive Neu- roscience 3 (1991) 72–86.
- P. Belhumeur, J. Hespanha, D. Kriegman, Eigenfaces vs. fisherfaces: class specific linear projection, IEEE Transactions on Pattern Analysis and Machine Intelligence (1997) 711–720.
- M. Bartlett, J. Movellan, T. Sejnowski, Face recognition by independent component analysis, IEEE Transactions on Neural Networks 13 (2002) 1450–1464.
- B. Heisele, Y. Ho, T. Poggio, Face recognition with support vector machines: global versus component-based approach, in: Proceedings of International Conference on Computer Vision, 2001, pp. 688–694.
- T. Ojala, M. Pietikainen, D. Harwood, A comparative study of texture measures with classification based on feature distributions, Pattern Recognition 29 (1996) 51–59.
- B. Fasel and J. Luettin. Automatic facial expression analysis: A survey. Pattern Recognition, 2003.
- Matthew A. Turk and Alex P. Pentland. Face recognition using eigenfaces. Pattern Recognition, 1991.
- Marian Stewart Barlett, Gwen Littlewort, Ian Fasel, and Javier R. Movellan. Real time face detection and facial expression recognition: Development and applications to human computer interaction. In Proceeding of the 2003 Conference on Computer Vision and Pattern Recognition Workshop, 2003.
- Philipp Michel and Rana El Keliouby. Real time facial expression recognition in video using support vector machines, 2003.
- Ira Cohen, NicuSebe, Fabio G. Cozman, and Thomas S. Huang. Semi-supervised learning for facial expression recognition. In Proceedings of the 5th ACM SIGMM, 2003.
- M. Lyons, S. Akamatsu, M. Kamachi, and J. Gyoba. Coding facial expressions with gabor wavelets. In Proceedings of the Third IEEE International Conference on Automatic Face and Gesture Recognition, Nara, Japan, Apr. 1998.
- Zhengyou Zhang, “Feature-Based Facial Expression Recognition: Sensitivity Analysis and Experiments with a Multi-Layer Perception”, International journal of pattern recognition and Artificial Intelligence 13(6): 1999 pages: 893-911.
- F. Dela Torre and J. F. Cohn. Facial expression analysis. In Th. B. Moeslund, A. Hilton, V. Kruger, and L. Sigal, editors, Guide to Visual Analysis of Humans: Looking at People, pages 377–410. Springer, 2011.
- Donato, M.S. Bartlett, J.C. Hager, P. Ekman, T.J. Sejnowski, "Classifying Facial Actions", IEEE Trans. Pattern Analysis and Machine Intelligence, Vol. 21, No. 10, pp. 974-989, 1999.
- M. Pantic, L.J.M. Rothkrantz, "Automatic Analysis of Facial Expressions: the State of the Art", IEEE Trans. Pattern Analysis and Machine Intelligence, Vol. 22, No. 12, pp. 1424-1445, 2000.
