Feature Selection based Breast Cancer Prediction

Author: Rakibul Hasan, A.S.M. Shafi
Journal: International Journal of Image, Graphics and Signal Processing @ijigsp
Article in issue: 2 vol.15, 2023.
Free access
Breast cancer is one of the main causes of mortality for women around the world. Such mortality rate could be reduced if it is possible to diagnose breast cancer at the primary stage. It is hard to determine the causes of this disease that may lead to the development of breast cancer. But it is still important in predicting the probability of cancer. We can assess the likelihood of occurrence of breast cancer using machine learning algorithms and routine diagnosis data. Although a variety of patient information attributes are stored in cancer datasets not all of the attributes are important in predicting cancer. In such situations, feature selection approaches can be applied to keep the pertinent feature set. In this research, a comprehensive analysis of Machine Learning (ML) classification algorithms with and without feature selection on Wisconsin Breast Cancer Original (WBCO), Wisconsin Diagnosis Breast Cancer (WDBC), and Wisconsin Prognosis Breast Cancer (WPBC) datasets is performed for breast cancer prediction. We employed wrapper-based feature selection and three different classifiers Logistic Regression (LR), Linear Support Vector Machine (LSVM), and Quadratic Support Vector Machine (QSVM) for breast cancer prediction. Based on experimental results, it is shown that the LR classifier with feature selection performs significantly better with an accuracy of 97.1% and 83.5% on WBCO and WPBC datasets respectively. On WDBC datasets, the result reveals that the QSVM classifier without feature selection achieved an accuracy of 97.9% and these results outperform the existing methods.
Breast Cancer Prediction, Machine Learning, Feature Selection, Classification
Short address: https://sciup.org/15018750
IDR: 15018750 | DOI: 10.5815/ijigsp.2023.02.02
Text of the scientific article Feature Selection based Breast Cancer Prediction
According to the statistics of the World Health Organization (WHO) in 2019, cancer is the first or second leading cause of human death around the world [1]. In 2020, approximately 10 million cancer deaths happened and female breast cancer (11.7%) exceeded lung cancer (11.4%) as the most commonly diagnosed cancer. It is also reported that the leading cause of cancer-related death in women is breast cancer [2]. Breast cancer develops when some breast tissues begin to grow abnormally. Breast cancer prevention methods have yet to be identified, therefore scientists have focused on creating new and better approaches to treat the disease after it has developed. Furthermore, efforts have been concentrated on the early identification of breast cancer in women through screening to ensure that more lives can be saved through treatment.
For at least 30 years, researchers have been investigating breast cancer screening methods such as mammography, clinical breast examination, and biopsy. Although mammography is one of the most useful methods for screening womens breast cancer, radiologists’ interpretations of mammograms can vary significantly [3]. The accuracy of surgical biopsy is more accurate than mammography but it is a highly cost and invasiveness process [4]. As a result, it is essential to build better breast cancer detection systems. These detection methods can assist in classifying patients into the benign or noncancerous and malignant or cancerous groups. Early detection of breast cancer increases the likelihood of a patient's survival. To achieve this goal, clinicians will need diagnostic systems with high levels of predictability and reliability that can assist them to distinguish between benign and malignant breast tumors.
Various research have been developed based on machine learning and data mining for breast cancer prediction. Some of them focus on improving learning models, and some concentrate on data pre-processing steps [5, 6]. While others focus on feature selection for identifying relevant features from a dataset to build a more effective classification system [7, 8]. Filters, wrappers, and embedded methods are the three different types of feature selection methods. In this study, a wrapper-based feature selection method has been used. The wrapper method finds optimal features by repeatedly evaluating subset combinations about the prediction model's accuracy. Although it is computationally more expensive but has high accuracy [9].
In this study, a breast cancer prediction approach is developed from Wisconsin breast cancer datasets with the assistance of machine learning. Feature optimization is used to apprehend the most unerring features. In our exploration, LR, LSVM, and QSVM classifiers are applied to construct the final prediction.
The rest of this research is structured as follows. Section 2 focuses on related works. The methodology and breast cancer datasets are described in Section 3. Sections 4 and 5 are for experimental results and discussion. Finally, Section 5 draws the conclusion and future directions of this work.
2. Literature Review
In medical science, a significant number of machine-learning based research has been initiated and ongoing to achieve a deeper understanding of successful breast cancer diagnosis using breast cancer datasets from the University of California, Irvine (UCI) machine learning repository.
E. A. Bayrak et al. [10] used Support Vector Machine (SVM) and Artificial Neural Network (ANN) classifiers to predict breast cancer from the WBC dataset. They utilized Sequential Minimal Optimization (SMO) and LibSVM algorithms for the classification of SVM. They also employed Multilayer Perceptron (MLP) and voted perceptron methods for the classification of SVM in WEKA software. They obtained the highest accuracy of 96. 9957% using SMO-SVM with 10-fold cross-validation.
3. Materials and Methodology3.1 Dataset Description
Authors [11] presented a breast cancer diagnosis scheme using K-Nearest Neighbour (KNN), Naive Bayes (NB), and Fast Decision Tree (FDT) classifiers. They used Particle Swarm Optimization (PSO) for feature selection. All three classifiers were evaluated on WPBC data and obtained the highest accuracy of 81.3% using the NB classifier. The behavior of two platforms (Spark and Weka) was compared by AlGhunaim et al. [12]. According to their experimental results, they showed that the SVM classifier outperformed the other classifiers. For gene expression and DNA methylation datasets, they obtained an accuracy of 99.68% and 98.73 %, respectively. They also combined the two datasets and achieved an accuracy of 97.33%. Authors [13] employed a deep learning algorithm with multiple activation functions such as Rectifier, Maxout, Tanh, and Exprectifier to classify breast cancer. They attained the highest classification accuracy of 96.99% by utilizing the Exprectifier function.
A neural network with feed-forward backpropagation algorithm was constructed in [14] for the classification of breast cancer and obtained a correct classification rate of 96.63% when applied on theWBC dataset. Microsoft Azure machine learning (AzureML) platform was utilized by K. Alshouiliy et al. [15] to analyze the WDBC dataset for breast cancer prediction. They applied decision trees and decision jungle for classification purposes. Their findings revealed that the decision jungle (97%) outperformed than decision tree (95%) In [16], authors developed an ensemble-based stacking classifier. They implemented different classification methods over the WDBC dataset and fine-tuned their parameters to achieve a better classification rate. By integrating the findings of those classifiers, they got 97.20% accuracy.
Six different machine-learning based classification algorithms (Random Forest, KNN, Decision Trees, NB, LR, and SVM) were applied on the WDBC dataset for the classification of breast cancer [17]. By combining Linear Discriminant Analysis (LDA) and LR, they improved their accuracy. The authors [18] suggested a technique for predicting and analyzing the WDBC dataset. Using Principal Component Analysis (PCA), they selected the top 6 and 10 features. Their suggested model reached 97.52% accuracy when applying Random Forest (RF) classifier with the top selected 10 features. For the prediction of the WPBC dataset, A. I. Pritom et al. [19] used the NB, SVM, and C4.5 Decision Tree. After ranking all the features, authors selected the 11 top-ranked features for classification and gained 76.26% accuracy for NB classifier. A good set of parameters of the KNN algorithm was proposed in [20] for breast cancer prognosis from WPBC dataset. Aalaei Sh et al. [21] developed a Genetic Algorithm (GA) based feature selection technique for breast cancer diagnosis on WBC, WDBC, and WPBC datasets. Authors used three renowned classifiers namely PS, ANN, and GA to analyze the efficacy of their suggested technique. They also compared their outcomes with and without the feature selection approach. Based on their experimental results it is clear that the features selection with the ANN classifier (97.3% and 79.2%) performed better than the other two classifiers on the WDBC, and WPBC datasets. Feature selection-based PS-classifier (96.9%), on the other hand, obtained the highest accuracy on WBC dataset.
On the WBC dataset, Vikas Chaurasia et al. [22] presented a technique for predicting breast cancer survivability using three prominent data mining approaches (NB, RBF Network, J48). After applying 10-fold cross-validation, their experimental results indicated that the NB classifier performed better classification results (97.36%) than RBF (96.7%) network and J48 (93.41%). Authors [23] presented a model for breast cancer classification on the WDBC dataset with the performance of three types of Bayes classifiers: Tree Augmented Naive Bayes (TAN), Boosted Augmented Naive
Bayes (BAN), and Bayes Belief Network (BBN). When compared to other networks, they discovered that the TAN Bayes classifier with Gradient Boosting (GB) technique improved classification accuracy (94.11%). Huang et al. [24] compared the performance of SVM and SVM ensembles in breast cancer prediction. Authors proved that the feature selection based on GA with linear SVM bagging method and GA with RBF kernel SVM boosting method can be a good prediction model for the WBC dataset.
This section discusses the structure of the proposed approach along with the corresponding datasets.
In this article, we have used three breast cancer datasets: WBCO, WDBC, and WPBC acquired from the UCI machine learning repository [25]. Table 1 contains a summary of the sample dataset.
Table 1. Sample dataset
|
Data Set |
Short Name |
No. of Attributes |
No. of Instances |
No. of Class |
|
Wisconsin Breast Cancer Original |
WBCO |
10 |
699 |
2 (B=Benign, M=Malignant) |
|
Wisconsin Diagnosis Breast Cancer |
WDBC |
32 |
569 |
2 (B=Benign, M=Malignant) |
|
Wisconsin Prognosis Breast Cancer |
WPBC |
34 |
198 |
2 (N=Non-Recur, R=Recur) |
-
3.2 Methodology
-
3.3 Pre-processing
-
3.4 Feature Selection
Fig. 1 depicts the architecture of the proposed method.
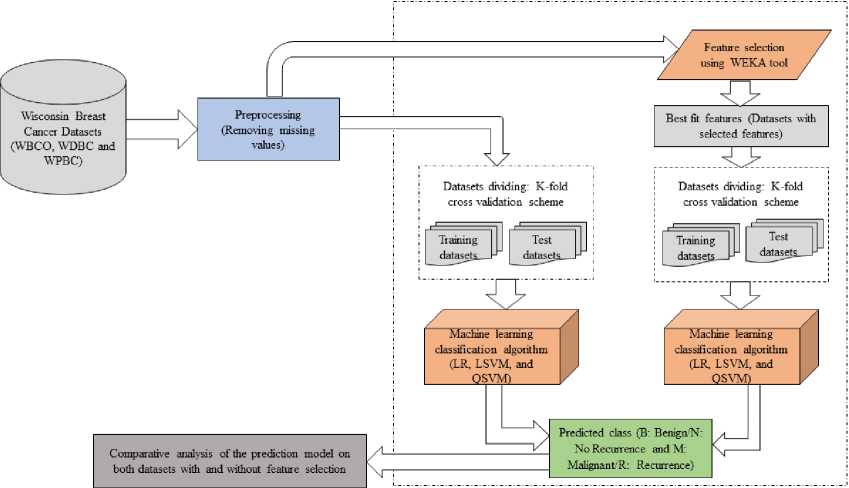
Fig. 1. Architecture of the proposed approach
We have removed the missing values from the datasets. Table 2 shows the pre-processed table.
Table 2. Pre-processed table
|
Datasets |
No. of instances (original) |
No. of Missing values |
No. of instances (pre-processed) |
Dataset distribution |
|
WBCO |
699 |
16 |
683 |
B=444, M=239 |
|
WDBC |
569 |
None |
569 |
B=357, M=212 |
|
WPBC |
198 |
4 |
194 |
N=148, R=46 |
The purpose of feature selection or attribute selection is to reduce the number of features by deleting irrelevant and unreliable features while increasing the classifier's potency. The benefits of feature selection are to reduce the cost of running the classifier in terms of speed and memory, as well as to reduce the curse of feature dimensionality. For feature selection, we have employed WEKA machine learning tools. We have used ClassifierAttributeEval for the attribute evaluator which applies a user-defined classifier to determine the value of an attribute. We have utilized function logistic as a user specified classifier. For search method and attribute selection mode, we have used BestFirst and full training set. All others parameters have been set as default in WEKA environment.
-
3.5 Machine Learning Classification Algorithms
-
3.5.1 Logistic Regression
-
3.5.2 Support Vector Machine
Machine learning is an application of Artificial Intelligence (AI) that enables computers to automatically learn and develop from a past dataset without the need for manual programming. The algorithms of machine learning start with datasets, from which they analyze that data and make a prediction based on the trained model in the near future.
For breast cancer predictions, we have used two important machine learning classification algorithms namely logistic regression and quadratic support vector machine classifiers. All the classifier experiments described in this work have been carried out with MATLAB tools.
Logistic Regression (LR) is a powerful supervised machine learning algorithm. It exhibits the association between an outcome variable (label) and each of the variables that influence it (features). Individual variable contributions to the final fit can be easily understood, and the outputs of back-fitting the data can be directly evaluated as probabilities [26]. In contrast to linear regression, the response variables in logistic regression can be categorical or continuous. A logistic regression output is more informative than the output of other classification techniques and continuous data is not strictly required by the model.
SVM is a well-known supervised machine learning technique that may be used for both classification and regression. The main goal of the SVM is to find the optimum decision boundary that can divide two or more classes (with the maximum margin) so that we can correctly classify new data points. It offers the highest accuracy rate when predicting large datasets. It is a famous machine learning algorithm built on 3D and 2D modeling [27]. SVM algorithms utilize a set of mathematical functions known as kernels. A kernel function takes data as input and transforms it into the desired form. In our study, we have applied a linear and quadratic kernel SVM to classify the datasets. QSVM is a nonlinear kernel with excellent mathematical adaptability and direct geometric explanation [28] that may outperform LSVM. LSVM and QSVM kernel equations are shown in Eq. (1) and (2) [29]. Their kernel difference is depicted in Fig. 2.
^ Linear — У * X + Ь
^ Quadratic — (у * X + Ь)
Where x and y are the input n-dimensional feature values, b is the kernel parameter, and K is the Kernel function.
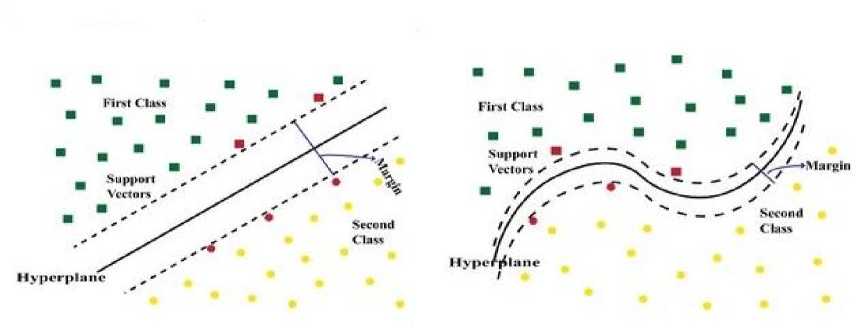
(a) (b)
Fig. 2. (a) A linear and (b) a quadratic kernel
4. Experimental Evaluation
We have analyzed the performance of our proposed method with the help of different performance indexes such as sensitivity (Sen), specificity (Spe), precision (Pre), miss rate, false discovery rate, and accuracy (Acc) (Table 4). These evaluation metrics have been calculated using the confusion matrix shown in Table 3. We have also incorporated Area Under the Curve (AUC) Receiver Operating Characteristics (ROC) to assess the performance criteria. Ten-fold crossvalidation (10-FCV) is performed to determine the validity of this research.
Table 3. Confusion matrix
|
Actual class |
Predicted class Positive Negative |
|
Positive |
True Positive, TP False Negative, FN |
|
Negative |
False Positive, FP True Negative, TN |
Table 4. Performance indexes
|
Evaluation metrics |
Formula |
|
Sensitivity/Recall/True Positive Rate (TPR) |
TP TP + FN |
|
Miss Rate/False Negative Rate (FNR) |
FN FN + TP |
|
Precision/Positive Predictive Value (PPV) |
TP TP + FP |
|
False Discovery Rate (FDR) |
FP FP + TP |
|
Specificity/True Negative Rate (TNR) |
TN TN + FN |
|
Accuracy/Overall Accuracy |
TP + TN TP + TN + FP + FN |
We have applied our suggested feature selection approach on the Wisconsin breast cancer datasets. Table 5 displays the features that are found to be significant.
Table 5. Optimal feature selection result
Dataset Selected features
WBCO Clumpthickness, Uniformcellsize, Uniformcellshape, Barenuclei, Normalnucleoli, Mitoses
WDBC Texture_mean, Area_se, Smoothness_se, Concavity_se, Fractal_dimension_se, Perimeter_worst, Smoothness_worst
WPBC Time, Mean_radius, Mean_symmetry, SE_area, Worst_radius, Worst_Perimeter
Case Study I:
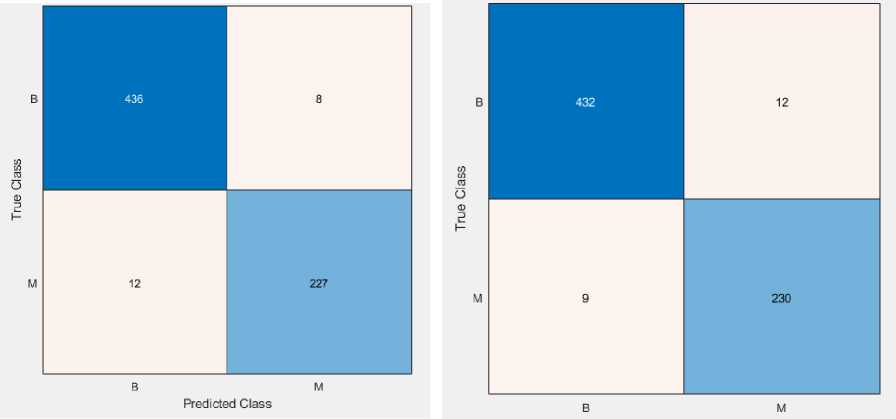
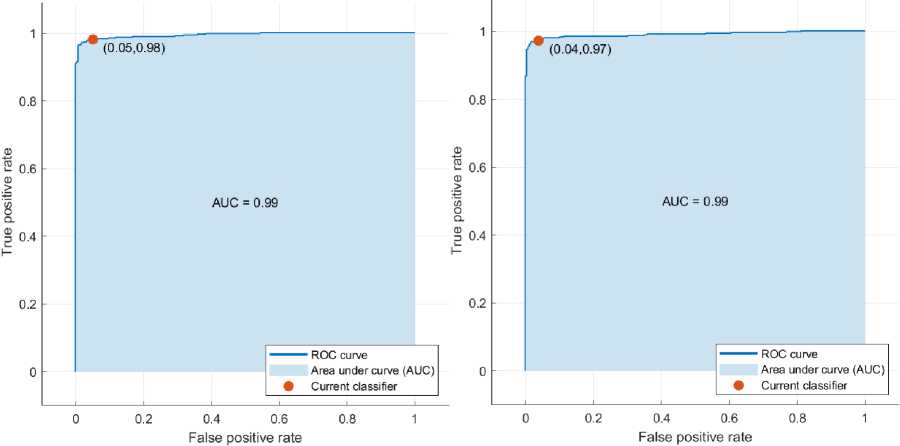
We have applied LR and QSVM classifiers with feature selection on the WBCO dataset. Fig. 3 and 4 depict the confusion matrix and ROC curve. Tables 6 and 7 present the summarized results.
(b)
(a)
Fig. 3. Confusion matrix of (a) LR and (b) QSVM classifier on the WBCO dataset
Table 6. Calculation of performance metrics using LR classifier on the WBCO dataset
|
Class |
TP |
FP |
TN |
FN |
Sensitivity |
FNR |
Precision |
FDR |
Specificity |
Accuracy |
|
Benign |
436 |
12 |
227 |
8 |
98.2 |
1.8 |
97.3 |
2.7 |
95.0 |
|
|
Malignant |
227 |
8 |
436 |
12 |
95.0 |
5.0 |
96.6 |
3.4 |
98.2 |
97.1 |
|
Weighted Measure |
97.1 |
97.1 |
96.1 |
Table 7. Calculation of performance metrics using QSVM classifier on the WBCO dataset
|
Class |
TP |
FP |
TN |
FN |
Sensitivity |
FNR |
Precision |
FDR |
Specificity |
Accuracy |
|
Benign |
432 |
9 |
230 |
12 |
97.3 |
2.7 |
98.0 |
2.0 |
96.2 |
|
|
Malignant |
230 |
12 |
432 |
9 |
96.2 |
3.8 |
95.0 |
5.0 |
97.3 |
96.9 |
|
Weighted Measure |
96.9 |
97.0 |
96.5 |
(a) (b)
Fig. 4. ROC curve of (a) LR and (b) SVM classifier on the WBCO dataset
Case Study II:
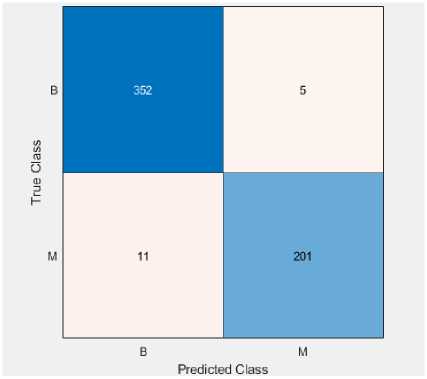
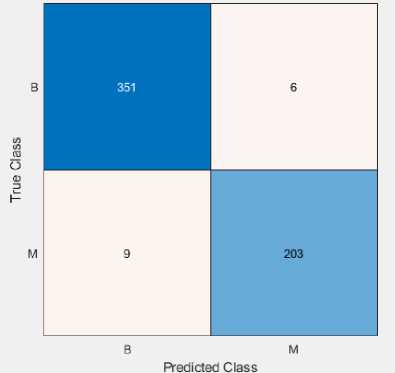
On the WDBC, we have used stated classifiers (LR and QSVM) with feature selection. The confusion matrix and ROC curve of explained classifiers are shown in Fig. 5 and 6. Tables 8 and 9 give the outcome of the performance indexes.
(a)
Fig. 5. Confusion matrix of (a) LR and (b) SVM classifier on the WDBC dataset
(b)
Table 8. Calculation of performance metrics using LR classifier on the WDBC dataset
|
Class |
TP |
FP |
TN |
FN |
Sensitivity |
FNR |
Precision |
FDR |
Specificity |
Accuracy |
|
Benign |
352 |
11 |
201 |
5 |
98.6 |
1.4 |
97.0 |
3.0 |
94.8 |
|
|
Malignant |
201 |
5 |
352 |
11 |
94.8 |
5.2 |
97.6 |
2.4 |
98.6 |
97.2 |
|
Weighted Measure |
97.2 |
97.2 |
96.2 |
|||||||
|
Table 9. Calculation of performance metrics using QSVM classifier on the WDBC dataset |
||||||||||
|
Class |
TP |
FP |
TN |
FN |
Sensitivity |
FNR |
Precision |
FDR |
Specificity |
Accuracy |
|
Benign |
351 |
9 |
203 |
6 |
98.3 |
1.7 |
97.5 |
2.5 |
95.8 |
|
|
Malignant |
203 |
6 |
351 |
9 |
95.8 |
4.2 |
97.1 |
2.9 |
98.3 |
97.4 |
|
Weighted Measure |
97.4 |
97.3 |
96.7 |
|||||||
(b)
(a)
Fig. 6. ROC curve of (a) LR and (b) SVM classifier on the WDBC dataset
Case Study III:
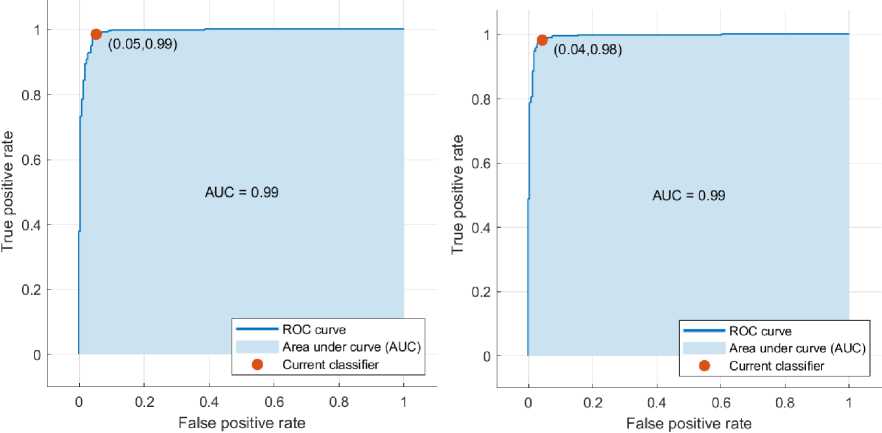
Fig. 7 and 8 show the confusion matrix and ROC curve of the described classifier with feature selection on the WPBC dataset. Tables 10 and 11 summarize the results of performance metrics.
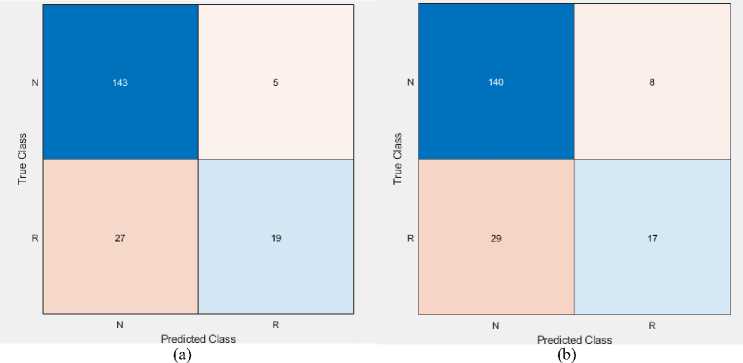
Fig. 7. Confusion matrix of (a) LR and (b) SVM classifier on the WPBC dataset
Table 10. Calculation of performance metrics using LR classifier on the WPBC dataset
|
Class |
TP |
FP |
TN |
FN |
Sensitivity |
FNR |
Precision |
FDR |
Specificity |
Accuracy |
|
Non-Recur |
143 |
27 |
19 |
5 |
96.6 |
3.4 |
84.1 |
15.89 |
41.3 |
|
|
Recur |
19 |
5 |
143 |
27 |
41.3 |
58.7 |
79.2 |
20.8 |
96.6 |
83.5 |
|
Weighted Measure |
83.5 |
83.0 |
54.4 |
Table 11. Calculation of performance metrics using QSVM classifier on the WPBC dataset
|
Class |
TP |
FP |
TN |
FN |
Sensitivity |
FNR |
Precision |
FDR |
Specificity |
Accuracy |
|
Non-Recur |
140 |
29 |
17 |
8 |
95.6 |
4.4 |
82.8 |
17.2 |
37.0 |
|
|
Recur |
17 |
8 |
140 |
29 |
37.0 |
63.0 |
68.0 |
32.0 |
95.6 |
80.9 |
|
Weighted Measure |
81.7 |
79.3 |
50.9 |
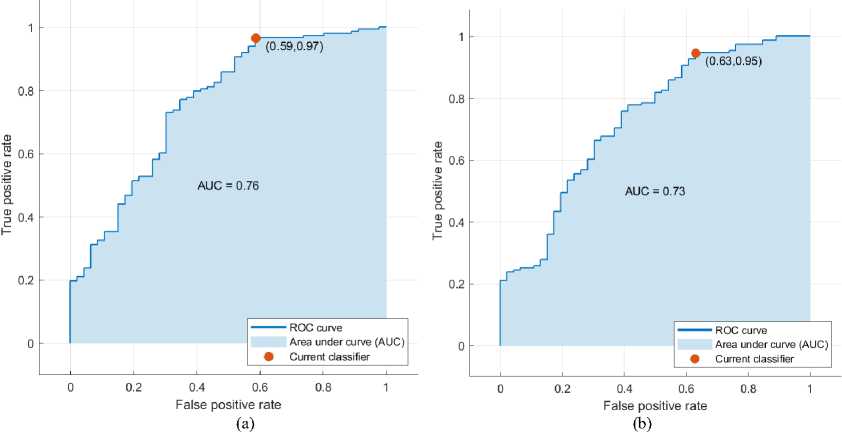
Fig. 8. ROC curve of (a) LR and (b) SVM classifier on the WPBC dataset
In this study, we have applied the LSVM classifier without and with feature selection on the WBCO, WDBC, and WPBC datasets. Also, we employed LR and QSVM classifier on both the datasets with all features. Table 12 presents a comparative analysis of three classifiers with and without feature selection on both databases.
Table 12. Comparative analysis of LR LSVM, and QSVM classifiers on both datasets with and without feature selection
|
WBCO |
WDBC |
WPBC |
||||||||||||||||
|
Without FS |
With FS |
Without FS |
With FS |
Without FS |
With FS |
|||||||||||||
|
й |
2 > |
2 > Z) О |
й |
2 > |
2 > Z) О |
й |
2 > z |
2 > JZ) О |
2 |
2 JZ) О |
2 |
2 JZ) О |
й |
2 |
2 JZ) О |
|||
|
Sen |
96.7 |
98 |
97.0 |
97.1 |
97.8 |
96.9 |
94.9 |
97 |
97.9 |
97.2 |
95.9 |
97.4 |
78.4 |
80 |
74.2 |
83.5 |
77.4 |
81.7 |
|
Spe |
95.9 |
95 |
96.8 |
96.1 |
95.8 |
96.5 |
94.6 |
99 |
96.8 |
96.2 |
97.5 |
96.7 |
60.3 |
57.9 |
53.1 |
54.4 |
75 |
50.9 |
|
Pre |
96.8 |
97.3 |
97.0 |
97.1 |
97.8 |
97.0 |
95.0 |
99.4 |
97.9 |
97.2 |
98.6 |
97.3 |
78.0 |
95.6 |
73.9 |
82.9 |
99.3 |
79.3 |
|
Acc |
96.8 |
96.9 |
96.9 |
97.1 |
97.1 |
96.9 |
94.9 |
97.7 |
97.9 |
97.2 |
96.5 |
97.4 |
78.4 |
77.8 |
74.2 |
83.5 |
77.3 |
80.9 |
5. Discussion
In this research, a wrapper-based feature selection model is used to recognize significant attributes. Wrapper methods provide a good prediction rate since they select features based on their relevancy and redundancy. It also finds the best subset of features and appears to be less vulnerable to overfitting compared to another feature selection model.
According to Table 12, it is shown that without feature selection both the LSVM and QSVM classifier outperforms the LR classifier on the WBCO dataset (96.9% vs 96.8%). It is also observed from Table 12 that both the LR and LSVM classifiers achieved the highest classification accuracy with feature selection (97.1%). Table 13 compares the accuracy of LR, LSVM, and QSVM classifiers on the WBCO dataset to other published works using various feature selection approaches.
Table 13. Accuracy comparison on the WBCO dataset
References Feature Selection based Breast Cancer Prediction
- World Health Organization (WHO). Global Health Estimates 2020: Deaths by Cause, Age, Sex, by Country and by Region, 2000-2019.
- Sung, H., Ferlay, J., Siegel, RL., Laversanne, M., Soerjomataram, I., Jemal, A., Bray, F. (2020). Global cancer statistics: GLOBOCAN estimates of incidence and mortality worldwide for 36 cancers in 185 countries. CA Cancer J Clin, 71: 209- 249. https://doi.org/10.3322/caac.21660.
- Elmore, JG., Wells, CK., Lee, CH., Howard, DH., Feinstein, AR. (1994). Variability in radiologists' interpretations of mammograms, N Engl J Med. 331:1493-1499.
- Vimpeli, SM., Saarenmaa, I., Huhtala, H., Soimakallio, S. (2008). Large-core needle biopsy versus fine-needle aspiration biopsy in solid breast lesions: comparison of costs and diagnostic value, Acta Radiol. 49(8):863-9. doi: 10.1080/02841850802235751. PMID: 18618302.
- Zhang, Y.D., Satapathy, S.C., Guttery, D.S., Gorriz, J.M., Wang, S.H. (2021). Improved breast cancer classification through combining graph convolutional network and convolutional neural network, Inf. Process. Manag. 58, 102439.
- Zhang, Y.D., Pan, C., Chen, X., Wang, F. (2018). Abnormal breast identification by nine-layer convolutional neural network with parametric rectified linear unit and rank-based stochastic pooling, J. Comput. Sci. 27, 57–68.
- Chandrashekar, G., Sahin, F. (2014). A survey on feature selection methods. Comput. Electr. Eng, 40, 16–28.
- Saeys, Y., Inza, I., Larrañaga, P. (2007). A review of feature selection techniques in bioinformatics. Bioinformatics. 23, 2507–2517.
- Babiker, M., Karaarslan, E., Hoscan, Y. (2019). A hybrid feature-selection approach for finding the digital evidence of web application attacks, Turkish J. Electr. Eng. Comput. Sci., 27, 4102-4117.
- Bayrak, E.A., Kırcı, P., Ensari, T. (2019). Comparison of Machine Learning Methods for Breast Cancer Diagnosis. Scientific Meeting on Electrical-Electronics & Biomedical Engineering and Computer Science (EBBT), Istanbul, Turkey, pp. 1-3, doi: 10.1109/EBBT.2019.8741990.
- Sakri, S.B., Abdul Rashid N.B., Muhammad Zain, Z. (2018). Particle Swarm Optimization Feature Selection for Breast Cancer Recurrence Prediction, IEEE Access, vol. 6, pp. 29637-29647. doi: 10.1109/ACCESS.2018.2843443.
- Alghunaim, S., Al-Baity, H.H. (2019). On the scalability of machine-learning algorithms for breast cancer prediction in big data context, IEEE Access, vol. 7, pp. 91535-91546.
- Mekha, P., Teeyasuksaet, N. (2019). Deep Learning Algorithms for Predicting Breast Cancer Based on Tumor Cells. Joint International Conference on Digital Arts, Media and Technology with ECTI Northern Section Conference on Electrical, Electronics, Computer and Telecommunications Engineering (ECTI DAMT-NCON), pp. 343-346, doi: 10.1109/ECTI-NCON.2019.8692297.
- Azmi, MSBM., and Cob, Z.C. (2010). Breast Cancer prediction based on Backpropagation Algorithm. IEEE Student Conference on Research and Development (SCOReD), pp. 164-168, doi: 10.1109/SCORED.2010.5703994.
- Alshouiliy, K., Shivanna, A., Ray, S., AlGhamdi, A., Agrawal, D.P. (2019). Analysis and Prediction of Breast Cancer using AzureML Platform. IEEE 10th Annual Information Technology, Electronics and Mobile Communication Conference (IEMCON), pp. 0212-0218, doi: 10.1109/IEMCON.2019.8936294.
- Basunia, M.R., Pervin, I.A., Al Mahmud, M., Saha, S., Arifuzzaman, M. (2020). On Predicting and Analyzing Breast Cancer using Data Mining Approach. IEEE Region 10 Symposium (TENSYMP), pp. 1257-1260, doi: 10.1109/TENSYMP50017.2020.9230871.
- Kaya, S., Yağanoğlu, M. (2020). An Example of Performance Comparison of Supervised Machine Learning Algorithms Before and After PCA and LDA Application: Breast Cancer Detection. Innovations in Intelligent Systems and Applications Conference (ASYU), pp. 1-6, doi: 10.1109/ASYU50717.2020.9259883.
- Ray, S, AlGhamdi, A., Alshouiliy, K., Agrawal, D.P. (2020). Selecting Features for Breast Cancer Analysis and Prediction. International Conference on Advances in Computing and Communication Engineering (ICACCE), pp. 1-6, doi: 10.1109/ICACCE49060.2020.9154919.
- Pritom, A.I., Munshi, M.A.R., Sabab, S.A., and Shihab, S. (2016). Predicting breast cancer recurrence using effective classification and feature selection technique. 19th International Conference on Computer and Information Technology (ICCIT), pp. 310-314, doi: 10.1109/ICCITECHN.2016.7860215.
- Pawlovsky, A. P., and Nagahashi, M. (2014). A method to select a good setting for the kNN algorithm when using it for breast cancer prognosis. IEEE-EMBS International Conference on Biomedical and Health Informatics (BHI), pp. 189-192, doi: 10.1109/BHI.2014.6864336.
- Aalaei, Sh., Shahraki, H., Rowhanimanesh, AR., Eslami, S. (2016). Feature selection using genetic algorithm for breast cancer diagnosis: experiment on three different datasets, Iran J Basic Med Sci; 19:476-482.
- Chaurasia, V., Pal, S., Tiwari, B. (2018). Prediction of benign and malignant breast cancer using data mining techniques. Journal of Algorithms & Computational Technology, 119-126. doi:10.1177/1748301818756225.
- Banu, AB., Subramanian, PT. (2018). Comparison of Bayes classifiers for breast cancer classification. Asian Pac J Cancer Prev (APJCP). 19(10):2917–20.
- Huang, MW., Chen, CW., Lin, WC., Ki, SW., Tsai, CF. (2017). SVM and SVM ensembles in breast cancer prediction, PLoS One, 12:1–14.
- UCI Breast Cancer Wisconsin (Diagnostic) Dataset, https://archive.ics.uci.edu/ml/machine-learning-databases/breast-cancer-wisconsin/, Last Access: 12.04.2021.
- Nadkarni, P. (2016). Core Technologies: Machine Learning and Natural Language Processing, Clinical Research Computing, Academic Press, Pages 85-114, ISBN 9780128031308, https://doi.org/10.1016/B978-0-12-803130-8.00004-X.
- Tran, H. (2019). A survey of machine learning and data mining techniques used in multimedia system, Dept. Comput. Sci., Univ. Texas Dallas Richardson, Richardson, TX, USA, Tech. Rep.
- Zhang, Y.-D., Wu, L. (2012). An MR brain images classifier via principal component analysis and kernel support vector machine. Prog. Electromagn. Res. 2012, 130, 369–388.
- Attallah, O., Sharkas, M. A., & Gadelkarim, H. (2020). Deep learning techniques for automatic detection of embryonic neurodevelopmental disorders. Diagnostics, 10(1), 27.
