Fertility in the North of Russia: Spatial and Ethnic Patterns

Author: Smirnov A.V., Lytkina U.V., Chuprova E.A.
Journal: Economic and Social Changes: Facts, Trends, Forecast @volnc-esc-en
Section: Social and economic development
Article in issue: 2 т.18, 2025.
Free access
The North of Russia comprises cities and districts that differ in fertility and reproductive behavior; this fact makes the territory an interesting object for demographic research. The paper considers fertility in the North of Russia at the regional and municipal levels, both in conditional and in real generations. Such an approach helps to identify spatial and ethnic patterns. Fertility analysis by region and ethnicity has shown a rapid decrease in differences between Russia’s constituent entities, which indicates the accelerated completion of the demographic transition in territories with high fertility. At the same time, reproductive behavior patterns within regions are becoming more diverse, which is a sign of the second demographic transition. Indicators above the level of simple reproduction are preserved only among Tuvans and some small-numbered indigenous peoples of the North. At the municipal level, fertility in conditional generations was estimated using data from the population censuses of 2010 and 2021, and in real generations by calculating the total fertility rate using the indirect standardization method for 2015-2023. We identified groups of territories in the North of Russia with high and low fertility rates. It is shown that the median fertility rate in the northern territories has decreased significantly in recent years. A correlation analysis of fertility rates and the ethnic composition of the population revealed that fertility in a municipality is determined primarily by the proportion of titular ethnic groups and small-numbered indigenous peoples of the North, and among young cohorts - only by the proportion of small-numbered peoples. The results obtained are of interest for developing demographic policy measures and making forecasts at the regional and municipal levels. In further research, it is recommended to pay attention to the dependence of fertility on the development of the social infrastructure in the North of Russia
Fertility, real and conditional generations, spatial analysis, ethnic patterns, municipalities, north of Russia
Short address: https://sciup.org/147251357
IDR: 147251357 | UDC: 314.3(470.1/2+571) | DOI: 10.15838/esc.2025.2.98.11
Text of the scientific article Fertility in the North of Russia: Spatial and Ethnic Patterns
The research was supported by Russian Science Foundation grant 24-78-10061, project/24-78-10061/.
The total fertility rate in Russia decreased from 1.76 to 1.41 in 2015–2023, which makes it relevant to study the North of Russia, in some regions of which fertility rates significantly exceed the national average. It is preferable to analyze fertility rates at the municipal level because of the high ethnic mosaicism of the North – taking into account differences in the national composition and spatial location of territories. It is important to understand which northern cities and districts have a higher reproductive potential and why.
Our study analyzes fertility in the municipalities of the North of Russia for 2010–2023 both in conditional generations (by calendar year of birth of children) and in real generations (by year of birth of mothers). Simultaneous consideration from both perspectives is the most methodologically correct approach for studying the fertility evolution processes (Zakharov, 2023, p. 7). Conditional generations are considered with the help of the total fertility coefficient obtained by the method of indirect standardization. These data help to explain short-term changes due to the current socio-economic situation. However, using only total fertility rates can lead to misinterpretations and give misleading signals (Sobotka, Lutz, 2011). The real generations are derived from the results of the 2010 and 2021 censuses. They help to understand long-term historical trends in fertility.
The article begins by reviewing existing studies of fertility in the northern regions of Russia and the world. Then the paper presents the research methodology and an overview of data sources. The research results are divided into two sections. The first one describes fertility patterns at the regional level. It considers the fertility of Russians, titular ethnic groups of the national republics (Kareli, Komi, Tuvinians, and Yakuts) and small-numbered indigenous peoples of the North. The second section is devoted to the fertility analysis at the municipal level in conditional and real generations. Ethnic factors promoting fertility are identified using correlation analysis. The conclusion summarizes the research results.
Fertility in the North in the optics of conditional and real generations
Fertility in Russia has been studied at all levels – from federal to municipal and settlement levels. The research (Zakharov, 2023) considers the most complete time series of the total fertility of the 20th–21st century on the scale of the whole country in real and conditional generations. P.A. Kishenin calculated the final fertility in real generations for 83 regions of Russia for 1935–2000; the data from 1973 are projected, since women born later have not yet reached reproductive ages (Kishenin, 2023). A.N. Petrosyan examined fertility in Russia at the municipal level in the conditional generations 2011–2019 by calculating the total fertility rate. He used the method of indirect standardization to estimate fertility for 2,304 municipal entities of the first level (Petrosyan, 2021).
At the regional level, the dynamics of fertility levels have been studied both in the North (Fauser et al., 2024) and in the Arctic (Smirnov, 2023), including in real generations (Sinitsa, 2017). In recent years, among the Northern regions, only the Magadan Region is characterized by a fertility rate below the national average, but in the second half of the 2010s, there was a trend toward a reduction in total fertility throughout the North (Fauser et al., 2024, p. 138). At the municipal level, censuses have examined fertility in the Yamal-Nenets Autonomous Area (Arkhangelsky, 2021) and the Komi Republic (Fauzer, 2023). The example of the Republic of Sakha (Yakutia) reveals differences in fertility rate of municipalities by their economic specialization (Lebedeva et al., 2022, p. 411). The highest indicators were demonstrated by agricultural territories. Sample surveys show that young northerners, as well as Russian residents in general, have a decreasing desired and expected number of children (Popova, 2022, p. 102), with women having lower indicators than men (Arkhangel’skii, Kalachikova, 2021, pp. 168–169). Research works have considered the periodization of demographic policy measures in the North (Zyryanova, Popova, 2021) and comparative analysis of maternity capital programs (Vakulenko et al., 2024).
International studies have examined fertility in northern European countries (Heleniak, 2024) and the global Arctic (Heleniak, Bogoyavlenskiy, 2014), including municipal data (Jungsberg et al., 2019). For a long time, Northern Europe was characterized by high fertility relative to most of the developed world (Comolli et al., 2021). This was attributed to a generous social security system, long parental leave, and high equality between the sexes in both the labor market and the household. In 2010, total fertility was 1.87 children per woman in Finland, 1.98 in Sweden and 2.22 in Iceland. After 2010, the rates declined steadily and by 2024 were almost identical to the European average: 1.26, 1.43 and 1.56 respectively1.
Scandinavian demographers’ studies show that the downward trend in total fertility is primarily due to a decline in first-born children (Ohlsson-Wijk, Andersson, 2022), i.e., an increase in the share of the population that is childless (Jonsson, 2024). This is particularly pronounced among women under 30 years of age (Hellstrand et al., 2021). Fertility declines and child birth is postponed also among couples living together (Hellstrand et al., 2022). Researchers attribute the changes to uncertainty and gloomy perceptions of the future among new generations of northern residents (Neyer et al., 2022). Immigration does not affect the situation significantly, as fertility differences between natives and migrants narrow within one or two generations (Hohn et al., 2022).
In a number of northern countries, fertility depends on the ethnic composition of the population, the share of small-numbered indigenous peoples of the North (Bogoyavlenskiy, Siggner, 2004, p. 33). For example, in Canada, fertility among the Inuit of the northern territories is twice as high as among the non-indigenous population (Morency, 2018, p. 45). In the USA, infertility is 1.4 times more common among Alaska Natives and American Indians than among whites (Craig et al., 2019). In Russia, ethnic differentiation of fertility based on the results of the 2021 census in real generations was studied using data from Moscow (Arkhangelsky, 2024). Ethnic and spatial patterns of fertility on the scale of Northern Russia at the municipal level have not yet been considered.
Methods and data
The object of the study is the Far North population and equated areas2 in 2010–2021. We consider the first level of municipal structure – urban districts, municipal districts, and municipal areas. In total, the North includes 294 territories with a combined population of 9.35 million as of 2021 (6.4% of Russia’s population). These territories cover about 69% of the country’s area and are of great economic importance. Only 13 regions that are fully included in the Far North bring 32.3% of tax payments to the federal budget3.
It is important to consider the fertility rate in the North of Russia taking into account the national composition of the population. The share of small-numbered indigenous people of the North exceeds half of the total population in 20 municipalities with a combined population of 134,300 people. The largest nationalities in them are the Dolgans, Koryaks, Nenets, Soyots, Tuvinians-Tojins, Khanty, Chukchi, Evenks, and Eveny. In another 41 municipalities, more than half of the residents are representatives of the titular ethnic groups of the national republics (Altaians, Buryats, Komi, Tuvinians, and Yakuts). As of the beginning of
2024, the population of these territories amounted to 1,114.2 thousand people. The combined share of small-numbered indigenous people of the North and titular ethnic groups exceeds 10% in 117 municipalities (Fig. 1).
At the regional level, we will consider only 13 constituent entities of the Russian Federation, the territories of which are fully included in the list of the Far North and equated areas. These are the Republics of Karelia, Komi, Sakha (Yakutia) and Tyva; the Kamchatka Territory; the Arkhangelsk, Magadan, Murmansk, and Sakhalin regions; the Nenets, Khanty-Mansi, Chukotka, and Yamal-Nenets autonomous areas. Data on fertility in the regions in conventional generations were obtained from the Unified Interagency Information and Statistical System (EMISS). Data in real generations are taken from the appendix to the article (Kishenin, 2023). This is the most complete in terms of time coverage publicly available dataset on fertility by region. The value for the whole North was calculated as a weighted average of the number of women in the 13 Northern regions.
The method of indirect standardization was used to estimate the total fertility rate (TFR) of municipalities (Petrosyan, 2021, p. 50). We chose it for two reasons. First, Rosstat does not publish agespecific fertility rates at the municipal level, which are necessary for the application of other methods. Second, even if the data were available, due to the small population of some municipalities of the North, the use of direct methods to calculate the fertility rate would give a large error. We used the following formula:
TFRt = TFR Russia
B t
x---------------
£ 49= 15 ASFR Russi a x
:pt , (1) 1000
where:
TFRi – total fertility rate of municipality I;
B – actual number of births;
ASFR – age-specific fertility rates by five-year groups;
P – female population.
Figure 1. Share of titular and small-numbered indigenous people (top, %) and largest nationality (bottom) by municipality in the North of Russia, 2021
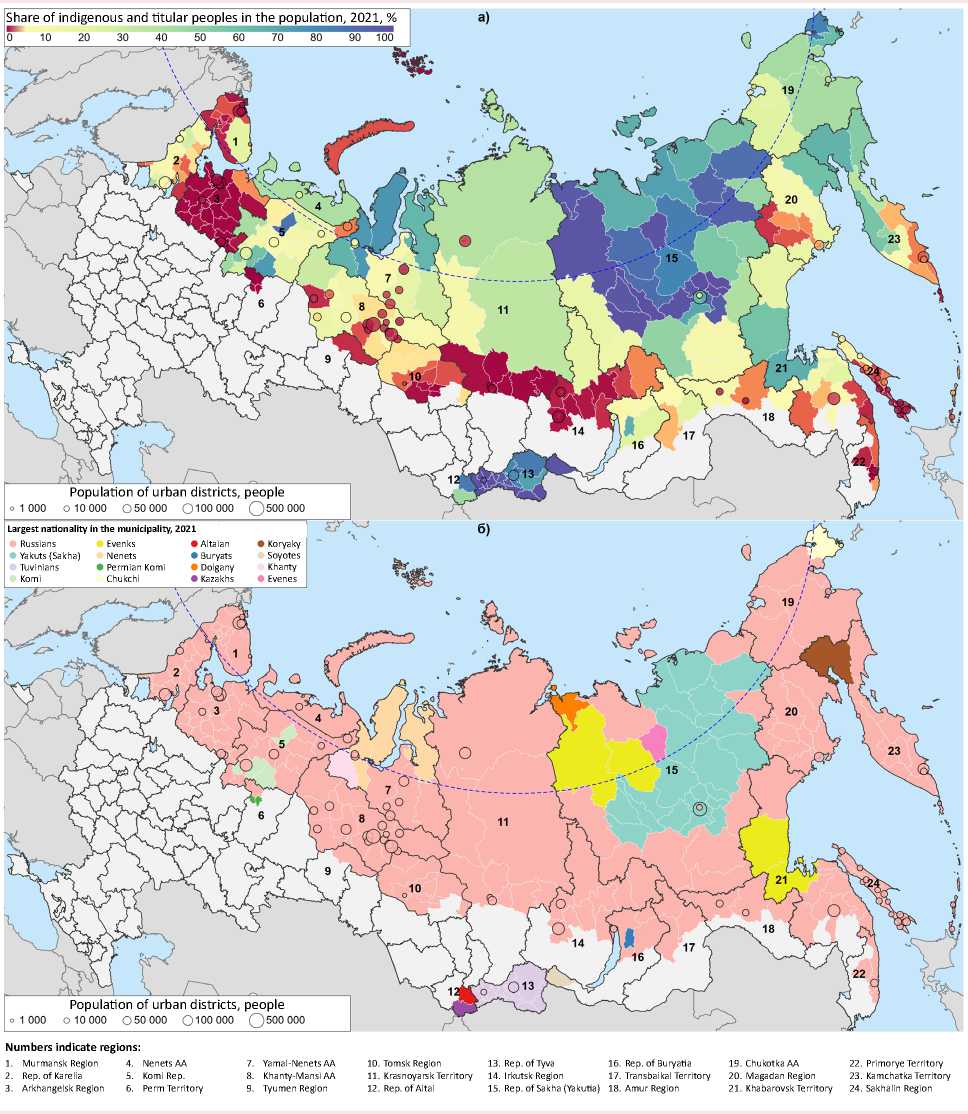
According to: Results of the All-Russian Population Census 2020–2021. Territorial bodies of Rosstat.
We took fertility rate in Russia of the corresponding years as a standard. The indicator was calculated for a three-year time period by averaging the values to reduce the impact of statistical outliers. The data for calculations were obtained from the Database of Indicators of Municipal Entities4 (BDPMO) and EMISS5.
We used data from the 2010 and 2021 population censuses in the context of municipalities and five-year age groups obtained from the territorial bodies of Rosstat to estimate fertility rate at the municipal level in real generations. For those regions for which the necessary tables were unavailable on the Rosstat website, they were provided upon request. Fertility maps in the North were constructed using the VegaLite.jl package in the Julia programming language.
Research results: regional level
Fertility rate in 13 northern regions (Fig. 2a) exceeds the national average, and the gap has increased compared to the 1990s. The republics of Tyva and Sakha (Yakutia) are particularly interesting. While in the former the TFR was significantly above the average for the North and in some years exceeded 3 births per woman, Yakutia, which was characterized by high fertility until 2015, equaled the average for the North. The Russian North did not reach the level of simple reproduction even in the most favorable 2014–2015, when fertility rate was 2.01. In real generations (Fig. 2b) , the level of simple reproduction was last achieved for the generation born in 1943. All subsequent generations did not provide expanded reproduction, although they exceeded the average Russian level. When
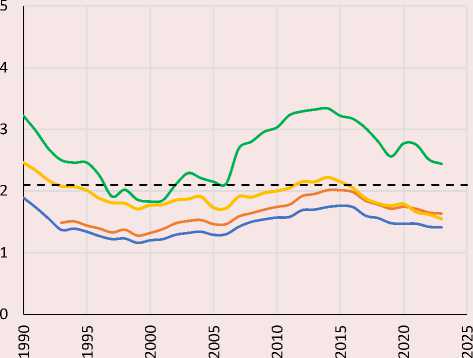
Russia
Northern regions
Republic of Tyva
Republic of Sakha (Yakutia)
Simple reproduction rate
Figure 2. Total fertility of conventional and real generations in Russia and northern regions: calendar years 1990–2023, generations born in 1935–1995, number of births per woman
Russia
Northern regions
Republic of Tyva
Republic of Sakha (Yakutia)
Simple reproduction rate
According to: EMISS. Total fertility rate. Availble at: ; (Kishenin, 2023).
Data on real generations born in 1973–1995 are projected. The value for the northern regions is calculated as a weighted average of the total number of women.
analyzing real generations, the Republics of Tyva and Sakha (Yakutia) also stand out. Of all the northern regions, only Tyva has more than two children per woman, even for generations born in the 1990s, although in this region the final fertility rate has more than halved since 1935 (from 4.7 to 2.2) and is projected to decline further. Women born in Tyva in the early 21st century are likely to have a final fertility lower than two.
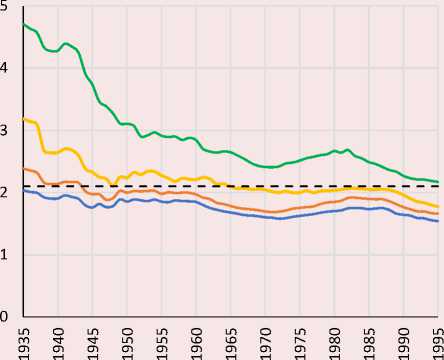
During the intercensal period of 2010–2021, the number of childless women in the North at young ages (15–29 years old) has significantly increased (Fig. 3), which is a sign of the second demographic transition, the revision of individual views on marriage and family. At the same time, the share of women with two children aged 20–34 increased. The share of women who had three children increased at all ages up to and including 49 years of age. At the same time, the share of women with one child decreased in the ages up to 39 years. We can state that the variability of reproductive behavior has increased. Cohorts born before 1940 stand out in terms of the number of women with many children. According to the 2010 census, more than a third of them had three or more children. In 2021, among women of the same ages born before 1951, already less than a quarter had three or more children. In all age groups over 50, the final childlessness rate was quite low, not exceeding 6.3%.
Fertility varies by ethnic groups and territories. Russians make up 74.6% of the population of the North of Russia. According to the data of the 2021 census, fertility among Russian women was below the level of simple reproduction in all regions and age groups (Tab. 1) . The only exception is women of the Nenets Autonomous Area who were born earlier than 1961. Nevertheless, fertility rate of Russians exceeds the national average in most northern regions. For example, in the 30–34 age group (born in 1987–1991), values below the national average (1.30) were recorded only in the Chukotka AA (1.28), the Magadan (1.27) and Sakhalin regions
Figure 3. Distribution of women in the northern regions by age groups and number of children born, 2010 and 2021, %
100%
90%
80%
70%
60%
50%
40%
30%
20%
10%
0%

4.9
6.4
11.6
15.8
43.7
46.,9
37.3
40.6
43.8
34.2
38.4
29.6
23.3
24.2
32.8
22.3
19.5
15.0
14.9
9.2
9.2
6.3
5.5
5.6
63.4 69.2
5.0
5.0
4.8
2010 2021
2010 2021
2010 2021
2010 2021
2010 2021
2010 2021
2010 2021
15-19 years
20-24 years
25-29 years
30-34 years
35-39 years
40-4 9 years
50-59 years
60-69 years
70 a nd more years
14.8 15.5
50.5
48.6 48.6

24.3
□ no children □ 1 child □ 2 children □ 3 children □ 4 and more children
According to: Results of the 2010 and 2021 population censuses. Available at:
Table 1. Average number of children born in real generations to Russian women in the northern regions of Russia, 2021 census
|
Region |
Age, years old |
|||||||
|
20–24 |
25–29 |
30–34 |
35–39 |
40–49 |
50–59 |
60–69 |
70 and more |
|
|
Nenets АA |
0.46 |
1.09 |
1.64 |
1.88 |
1.86 |
1.91 |
2.15 |
2.36 |
|
Republic of Tyva |
0.45 |
1.23 |
1.63 |
1.82 |
1.72 |
1.75 |
1.91 |
1.97 |
|
Republic of Sakha (Yakutia) |
0.46 |
1.04 |
1.53 |
1.75 |
1.77 |
1.78 |
2.00 |
2.09 |
|
Khanty-Mansi AA |
0.31 |
0.93 |
1.46 |
1.74 |
1.73 |
1.68 |
1.91 |
2.05 |
|
Arkhangelsk Region (without AA) |
0.31 |
0.94 |
1.49 |
1.73 |
1.68 |
1.74 |
2.02 |
2.06 |
|
Yamal-Nenets AA |
0.33 |
0.88 |
1.44 |
1.71 |
1.70 |
1.67 |
1.85 |
1.96 |
|
Komi Republic |
0.38 |
1.03 |
1.49 |
1.70 |
1.64 |
1.67 |
1.91 |
2.02 |
|
Republic of Karelia |
0.27 |
0.89 |
1.43 |
1.67 |
1.62 |
1.61 |
1.85 |
1.86 |
|
Chukotka AA |
0.42 |
0.89 |
1.28 |
1.57 |
1.58 |
1.60 |
1.73 |
1.85 |
|
Kamchatka Territory |
0.39 |
0.89 |
1.34 |
1.56 |
1.56 |
1.55 |
1.77 |
1.80 |
|
Murmansk Region |
0.31 |
0.87 |
1.34 |
1.60 |
1.54 |
1.51 |
1.73 |
1.74 |
|
Russia |
0.28 |
0.83 |
1.30 |
1.53 |
1.55 |
1.56 |
1.72 |
1.75 |
|
Magadan Region |
0.35 |
0.86 |
1.27 |
1.51 |
1.55 |
1.54 |
1.76 |
1.83 |
|
Sakhalin Region |
0.33 |
0.84 |
1.26 |
1.47 |
1.49 |
1.52 |
1.74 |
1.80 |
According to: Results of the All-Russian Population Census 2020–2021. Volume 5. Table 14 Rosstat. Available at: vpn/2020
(1.26). The highest values are in the Nenets AA and Tyva (1.64 and 1.63). In the age group from 25 to 29, all northern regions exceed the national average. We can assume that the reproductive attitudes of Russians are influenced by the environment, total fertility in the territory of residence, as well as its degree of urbanization. The difference between the minimum and maximum value for the northern regions in most age groups is about 0.4 births per woman.
Among the titular ethnic groups of the national republics, Tuvinians have the highest fertility rate (Tab. 2) . At the age of 30–34, there are more than two children per woman, and by the end of the reproductive age the value approaches 2.5. Fertility rate of Tuvinian women in Tyva is higher than outside its borders. The Tuvinian-Tojin sub-ethnos, which is one of the smallest, stands out. Already by the age of 30-34 years the average number of children is 2.5, by 40–49 years – 2.7. Yakuts are the second titular
Table 2. Average number of children born in real generations to women of titular nationalities of the republics of the North of Russia by region and age group, census 2021
|
Nationality |
Region |
Age, years old |
|||||||
|
20–24 |
25–29 |
30–34 |
35–39 |
40–49 |
50–59 |
60–69 |
70 and more |
||
|
Tuvinians-Tojins |
Republic of Tyva |
0.63 |
1.78 |
2.50 |
2.76 |
2.70 |
2.64 |
3.19 |
4.25 |
|
Tuvinians |
Republic of Tyva |
0.59 |
1.47 |
2.09 |
2.42 |
2.47 |
2.40 |
2.90 |
3.76 |
|
Russia |
0.55 |
1.45 |
2.08 |
2.42 |
2.46 |
2.39 |
2.88 |
3.74 |
|
|
Yakuts |
Republic of Sakha (Yakutia) |
0.40 |
1.17 |
1.91 |
2.34 |
2.40 |
2.36 |
2.52 |
3.00 |
|
Russia |
0.40 |
1.17 |
1.90 |
2.32 |
2.40 |
2.35 |
2.51 |
2.98 |
|
|
Komi Izhemtsy |
Komi Republic |
0.72 |
1.46 |
1.85 |
2.10 |
2.10 |
2.11 |
2.46 |
3.32 |
|
Nenets AA |
0.42 |
1.55 |
2.24 |
2.14 |
2.25 |
2.23 |
2.59 |
3.48 |
|
|
Yamal-Nenets AA |
0.49 |
0.99 |
2.05 |
2.00 |
2.29 |
2.15 |
2.45 |
3.22 |
|
|
Komi |
Murmansk Region |
0.60 |
1.19 |
1.89 |
1.96 |
1.83 |
1.88 |
1.96 |
2.35 |
|
Russia |
0.42 |
1.21 |
1.72 |
1.92 |
1.86 |
1.90 |
2.16 |
2.44 |
|
|
Komi Republic |
0.45 |
1.27 |
1.73 |
1.93 |
1.85 |
1.89 |
2.16 |
2.44 |
|
|
Karelians |
Republic of Karelia |
0.25 |
0.83 |
1.49 |
1.74 |
1.68 |
1.76 |
1.98 |
2.13 |
|
Russia |
0.24 |
0.77 |
1.38 |
1.70 |
1.67 |
1.75 |
1.97 |
2.07 |
|
According to: Results of the All-Russian Population Census 2020-2021. Volume 5. Table 14. Rosstat. Available at: vpn/2020
ethnos that reproduce themselves, but the figures are somewhat lower than those of Tuvinians. The number of children born per woman above two is reached by the age of 35–39. In the younger generations of Yakuts, fertility rate is noticeably lower than in Tuvinians, as evidenced by the previously discussed dynamics of fertility in the context of republics (Fig. 2b). The Komi have the lowest fertility rate in the Komi Republic, where 88.5% of the nationality live. In reproductive ages, the number of children per woman is no more than 1.93 (35–39-year-olds), and more than 2 – only for women born before 1961. Higher fertility rates among Komi women are recorded in the Nenets and Yamal-Nenets autonomous areas, where the value of 2 is reached already in the age group from 30 to 34 years. The Komi-Izhemtsy sub-ethnic group also demonstrates high fertility rates – 2.1 births per woman aged 35– 39. Karelians are characterized by the lowest fertility rate among the titular ethnic groups of the northern republics. The level of simple reproduction is reached only for women born before 1951. The indicators are slightly higher than for Russians in Russia.
Fertility of titular ethnic groups is heterogeneous. While European ethnic groups (Komi and Karelians) do not differ much from Russians in terms of fertility rates, Asian ethnic groups (Yakuts and especially Tuvinians) have higher fertility rates. If we do not consider the smallest ethnic groups, where the number of women is less than 100 per region, the results of the 2021 census provide information on the number of births among 16 small-numbered indigenous peoples of the North by region and age group (Tab. 3).
Table 3. Average number of children born in real generations to women of small-numbered indigenous people of the North of Russia by region and age group, 2021 census
|
Nationality* |
Region |
Age, years old |
|||||||
|
20–24 |
25–29 |
30–34 |
35–39 |
40–49 |
50–59 |
60–69 |
70 and more |
||
|
Nenets |
Yamal-Nenets AA |
0,91 |
1,85 |
2,59 |
2,99 |
3,43 |
3,51 |
3,86 |
4,42 |
|
Nenets AA |
0.81 |
1.58 |
2.29 |
2.59 |
2.50 |
2.58 |
3.15 |
3.75 |
|
|
Dolgans |
Republic of Sakha (Yakutia) |
0.39 |
1.44 |
2.33 |
3.07 |
3.07 |
2.95 |
3.68 |
3.90 |
|
Khanty |
Yamal-Nenets AA |
0.60 |
1.62 |
2.40 |
2.75 |
2.85 |
2.98 |
3.19 |
4.32 |
|
Khanty-Mansi AA |
0.71 |
1.50 |
2.04 |
2.36 |
2.27 |
2.28 |
2.58 |
2.78 |
|
|
Koryak |
Magadan Region |
1.33 |
1.79 |
2.03 |
1.72 |
3.43 |
2.16 |
2.47 |
1.75 |
|
Kamchatka Territory |
0.79 |
1.38 |
1.87 |
2.19 |
2.24 |
2.24 |
2.42 |
3.20 |
|
|
Republic of Sakha (Yakutia) |
0.65 |
1.47 |
2.20 |
2.54 |
2.65 |
2.72 |
3.13 |
3.61 |
|
|
Even |
Chukotka AA |
1.06 |
1.26 |
2.15 |
2.39 |
2.21 |
2.77 |
2.56 |
3.82 |
|
Kamchatka Territory |
0.98 |
1.02 |
2.00 |
2.40 |
2.44 |
2.30 |
2.45 |
2.95 |
|
|
Magadan Region |
0.75 |
1.23 |
1.60 |
2.08 |
2.05 |
1.98 |
2.28 |
3.29 |
|
|
Chukchi |
Chukotka AA |
0.77 |
1.51 |
1.90 |
2.23 |
2.47 |
2.63 |
2.77 |
3.19 |
|
Kamchatka Territory |
1.12 |
1.33 |
1.75 |
2.31 |
2.19 |
2.29 |
2.90 |
2.93 |
|
|
Evenki |
Republic of Sakha (Yakutia) |
0.57 |
1.44 |
2.06 |
2.49 |
2.55 |
2.57 |
2.88 |
3.34 |
|
Selkup |
Yamal-Nenets AA |
0.80 |
1.47 |
2.11 |
2.34 |
2.42 |
2.38 |
2.80 |
3.13 |
|
Niwch |
Sakhalin Region |
0.63 |
1.22 |
2.04 |
2.24 |
2.29 |
2.31 |
2.51 |
2.39 |
|
Mansis |
Khanty-Mansi AA |
0.56 |
1.37 |
2.03 |
2.17 |
2.21 |
2.23 |
2.43 |
2.69 |
|
Chuvan |
Chukotka AA |
0.79 |
1.06 |
1.82 |
2.40 |
2.08 |
2.39 |
2.17 |
2.96 |
|
Eskimo |
Chukotka AA |
0.78 |
1.48 |
1.49 |
2.12 |
2.13 |
2.28 |
2.70 |
3.27 |
|
Itelmes |
Kamchatka Territory |
0.63 |
1.28 |
1.79 |
1.98 |
1.96 |
1.93 |
2.08 |
2.38 |
|
Magadan Region |
0.73 |
0.83 |
1.30 |
1.41 |
1.83 |
2.09 |
2.20 |
2.21 |
|
|
Kamchadal |
Kamchatka Territory |
0.60 |
1.14 |
1.65 |
1.98 |
1.88 |
1.86 |
2.17 |
2.24 |
|
Saami |
Murmansk Region |
0.54 |
1.16 |
1.63 |
1.92 |
1.89 |
1.94 |
2.09 |
2.29 |
|
Vepse |
Republic of Karelia |
0.08 |
0.64 |
1.10 |
1.53 |
1.53 |
1.58 |
1.91 |
1.88 |
* Specifies nationalities representing at least 0.2% of those indicating nationality in the region and with at least 100 women aged 15+. According to: Results of the All-Russian Population Census 2020–2021. Volume 5. Table 14. Rosstat. Available at: vpn/2020
The majority of small-numbered indigenous people are still in the mode of extended reproduction: Dolgans, Koryaks, Mansi, Nenets, Nivkhs, Selkups, Khanty, Chuvans, Chukchis, Evenks, Eveny. The demographic transition to small children in areas densely populated by these peoples has not yet been completed. For women of some nationalities, the average number of children in late reproductive ages exceeds three: the Nenets in the Yamal-Nenets Autonomous Area, Dolgans in Yakutia, and Koryaks in the Magadan Region. At the same time, fertility rate of the same Nenets, but in the Nenets Autonomous Area, is significantly lower and reaches only 2.6 births. The Khanty in the Khanty-Mansiysk AA are characterized by a lower fertility rate than in the Yamal-Nenets AA. Among older generations of women aged over 70, the highest rate is among the Nenets in the Yamal-Nenets AA (4.4).
According to 2021 data, some small-numbered indigenous peoples have not reached the level of simple reproduction. These are Itelmens, Kamchadals, Saami, and Veps. The latter two nationalities live in the European North near large cities, which contributes to their assimilation and transformation of reproductive attitudes. The Veps in Karelia have only 1.53 children per one woman aged 35–39, which is almost equal to the level of Russians. It is interesting that among Veps even older women (70 years and more) have given birth to less than two children in their lifetime. Eskimos occupy an intermediate position between the two groups of ethnic groups, being approximately at the level of simple reproduction – 2.12 children for women aged 35–39.
Thus, Tuvinians and the majority of small-numbered indigenous people are still characterized by a higher fertility rate than the Russian average. A number of other peoples, including the Komi and Karelians, are showing signs of the second demographic transition. The age of motherhood is increasing, the two-child family is no longer the social norm, and there is greater variability in fertility rates. For a more complete understanding of fertility processes in the North, let us move to the municipal level of analysis.
Fertility in the municipalities of the North of Russia
Changes in real generations of fertility for 2010– 2021 at the municipal level are not uniform among different age groups (Tab. 4). The median value of fertility increased only among 25–44-year-olds. The calendar shift due to maternity capital and favorable socioeconomic situation increased fertility among these generations in the intercensal period. While in 2010 among 30–34-year-olds only 20 municipalities had more than two children born per woman, in 2021 – already in 54. At the same time, the number of municipalities with less than one child per woman decreased from 139 to 59. A significant increase in fertility rate was also observed at the age of 35 to 39 years.
At the same time, among younger and older ages the situation is the opposite, fertility rates have decreased. The decline in the number of children in older ages clearly indicates the impact of demographic transition. If in 2010 there were quite a few municipalities where there were more than four children per woman, now there are only among those over 70 years of age. The only exception is the Mongun-Taiginsky District of Tyva, where in 2021 there were more than four children per woman aged 65–69. Among women of reproductive age, the highest value is in Anabarsky District (3.2 for women aged 40–44). Areas where the average number of children for 18–19-year-old women was higher than 0.5 have practically disappeared. In the age category of 20–24-year-old women, the number of territories with low fertility (less than 0.5) almost doubled. Adolescent fertility also decreased – the median value of the average number of children among 15–17-year-olds decreased from 0.015 to 0.009.
Table 4. Distribution of municipalities of the North of Russia by average number of children per woman by age group, 2010 and 2021
|
Year and average number of children |
All, 15 or more years old |
Including by age, years old: |
||||||||||||
|
15–17 |
18–19 |
20–24 |
25–29 |
30–34 |
35–39 |
40–44 |
45–49 |
50–54 |
55–59 |
60–64 |
65–69 |
70 and more |
||
|
2010, total municipalities, of which: |
294 |
294 |
294 |
294 |
294 |
294 |
294 |
294 |
294 |
294 |
294 |
294 |
294 |
294 |
|
0.00–0.49 |
– |
294 |
287 |
80 |
– |
– |
– |
– |
– |
– |
– |
– |
– |
– |
|
0.50–0.99 |
– |
– |
7 |
213 |
76 |
– |
– |
– |
– |
– |
– |
– |
– |
– |
|
1.00–1.49 |
59 |
– |
– |
1 |
209 |
139 |
36 |
6 |
– |
– |
– |
– |
2* |
– |
|
1.50–1.99 |
171 |
– |
– |
– |
9 |
135 |
198 |
184 |
138 |
99 |
68 |
77 |
57 |
21 |
|
2.00–2.49 |
62 |
– |
– |
– |
– |
20 |
54 |
70 |
117 |
142 |
163 |
147 |
138 |
91 |
|
2.50–2.99 |
2 |
– |
– |
– |
– |
– |
6 |
34 |
33 |
35 |
37 |
38 |
42 |
91 |
|
3.00–3.49 |
– |
– |
– |
– |
– |
– |
– |
– |
6 |
14 |
15 |
16 |
23 |
33 |
|
3.50–3.99 |
– |
– |
– |
– |
– |
– |
– |
– |
– |
4 |
5 |
6 |
16 |
15 |
|
4.00 and more |
– |
– |
– |
– |
– |
– |
– |
– |
– |
– |
6 |
10 |
16 |
43 |
|
midpoint |
1.76 |
0.02 |
0.20 |
0.60 |
1.12 |
1.51 |
1.75 |
1.87 |
2.03 |
2.14 |
2.18 |
2.18 |
2.29 |
2.68 |
|
2021, total municipalities, of which: |
294 |
294 |
294 |
294 |
294 |
294 |
294 |
294 |
294 |
294 |
294 |
294 |
294 |
294 |
|
0.00–0.49 |
– |
294 |
292 |
142 |
– |
– |
– |
– |
– |
– |
– |
– |
– |
1** |
|
0.50–0.99 |
– |
– |
1 |
144 |
51 |
– |
– |
– |
– |
– |
– |
– |
– |
– |
|
1.00–1.49 |
22 |
– |
1** |
8 |
212 |
59 |
9 |
4 |
18 |
15 |
3 |
2 |
1 |
– |
|
1.50–1.99 |
192 |
– |
– |
– |
31 |
180 |
178 |
183 |
189 |
181 |
154 |
115 |
86 |
69 |
|
2.00–2.49 |
77 |
– |
– |
– |
– |
54 |
74 |
68 |
57 |
68 |
101 |
126 |
143 |
139 |
|
2.50–2.99 |
3 |
– |
– |
– |
– |
1 |
31 |
37 |
30 |
28 |
32 |
38 |
42 |
32 |
|
3.00–3.49 |
– |
– |
– |
– |
– |
– |
2 |
2 |
– |
2 |
4 |
12 |
16 |
32 |
|
3.50–3.99 |
– |
– |
– |
– |
– |
– |
– |
– |
– |
– |
– |
1 |
5 |
7 |
|
4 and more |
– |
– |
– |
– |
– |
– |
– |
– |
– |
– |
– |
– |
1 |
14 |
|
midpoint |
1.82 |
0.01 |
0.09 |
0.50 |
1.21 |
1.69 |
1.89 |
1.91 |
1.84 |
1.84 |
1.98 |
2.09 |
2.15 |
2.24 |
* Urban district Novaya Zemlya and Ostrovnaya.
** – Urban district Novaya Zemlya.
According to: Results of the 2010 and 2021 Population Censuses. Territorial bodies of Rosstat.
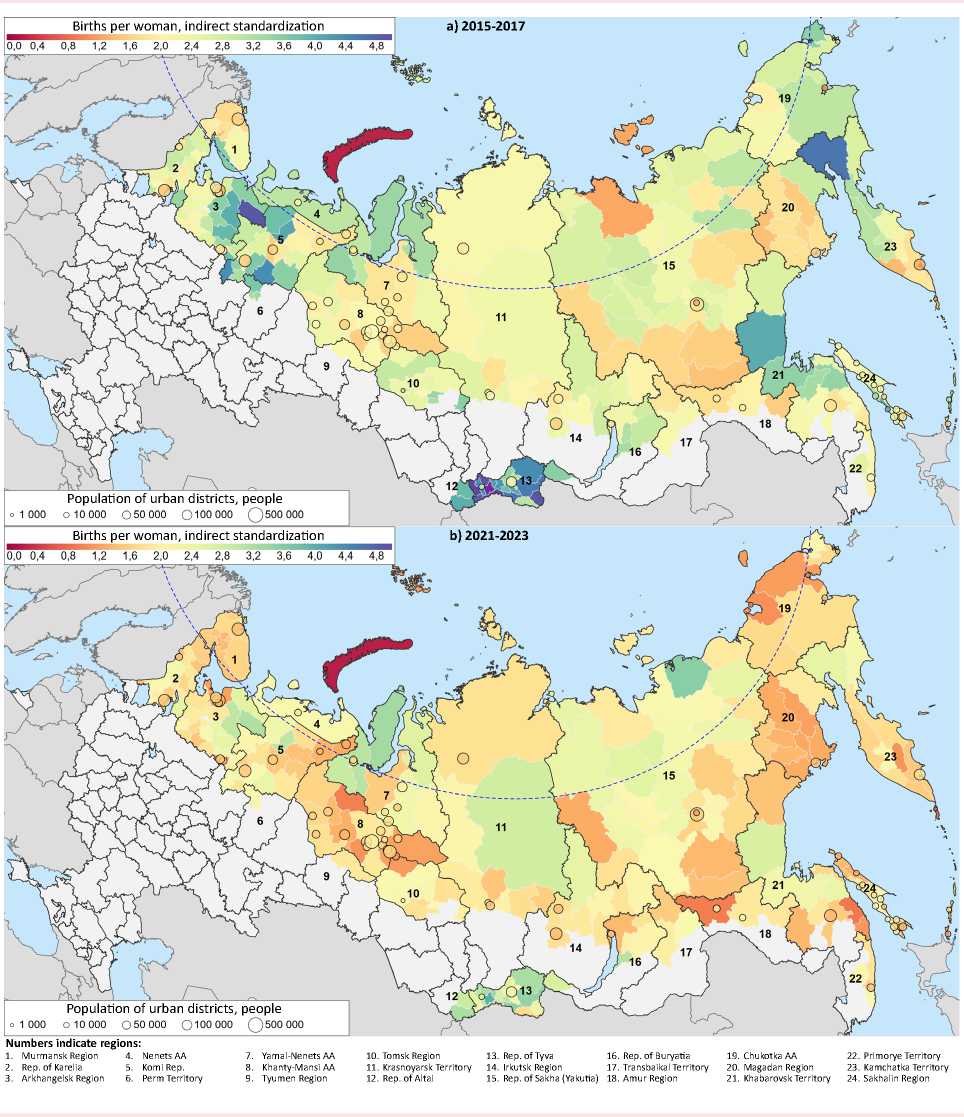
Let us consider the spatial differentiation of fertility on the example of 30–34-year-old women (Fig. 4) . This is approximately the middle of the reproductive period. It is not difficult to notice that the territories of high fertility have spatial localization in the areas inhabited by indigenous peoples. These are practically the entire Tyva Republic (Tuvinians), the east of the Altai Republic (Altaians, Kazakhs), the north of Yakutia (Yakuts, Dolgans, Evenks, Eveny), the Yamal Peninsula (Nenets, Khanty), remote areas of the Khabarovsk Territory (Evenks), some territories of Kamchatka
(Koryaks, Eveny). In the Komi Republic, the Izhemsky District, where predominantly Komi-Izhemsky people live, stands out. Low fertility rates are concentrated in large cities, in regions with a low share of rural population (Murmansk and Sakhalin regions), in the extractive northeast of the Komi Republic, and in most of the Republic of Karelia. For most age groups, the lowest fertility rate was recorded in Novaya Zemlya urban district, which is not surprising, given its defense function. The vast majority of other urban districts are also characterized by low fertility rates.
Figure 4. Number of children per woman aged 30 to 34 by municipalities of the North of Russia, 2010 and 2021
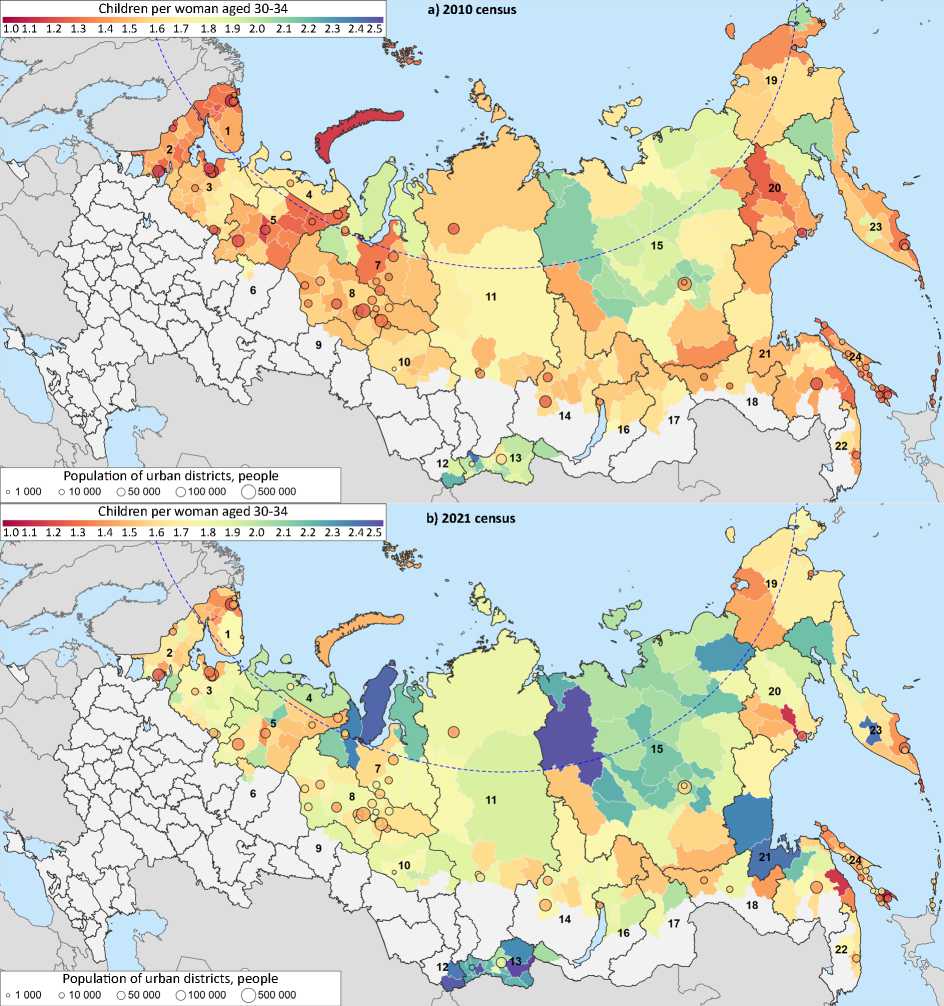
Numbers indicate regions:
-
1. Murmansk Region
-
2. Rep. of Karelia
-
3. Arkhangelsk Region
-
4. Nenets AA
-
5. Komi Rep.
-
6. Perm Territory
-
7. Yamal-Nenets AA
-
8. Khanty-Mansi AA
-
9. Tyumen Region
-
10. Tomsk Region 13. Rep. of Tyva 16. Rep. of Buryatia
-
11. Krasnoyarsk Territory 14. Irkutsk Region 17. Transbaikal Territory
-
12. Rep. of Altai 15. Rep. of Sakha (Yakutia) 18. Amur Region
-
19. Chukotka AA 22. Primorye Territory
-
20. Magadan Region 23. Kamchatka Territory
-
21. Khabarovsk Territory 24. Sakhalin Region
According to: Results of the population censuses of 2010 and 2021. Territorial bodies of Rosstat.
Table 5. Distribution of municipalities of the North of Russia by the value of the total fertility rate and the largest nationality, averaged values 2015–2017 and 2021–2023
|
TFR (indir.) |
All, 2015– 2017 |
By largest nationality |
All, 2021– 2023 |
By largest nationality |
||||||
|
Russians |
Tuvinians |
Yakuts |
Others |
Russians |
Tuvinians |
Yakuts |
Others |
|||
|
Total municipalities |
287 |
223 |
19 |
22 |
23 |
287 |
223 |
19 |
22 |
23 |
|
0.00–0.99 |
1 |
1 |
– |
– |
– |
5 |
5 |
– |
– |
– |
|
1.00–1.49 |
12 |
12 |
– |
– |
– |
60 |
59 |
– |
1 |
– |
|
1.50–1.74 |
29 |
26 |
– |
3 |
– |
65 |
61 |
1 |
2 |
1 |
|
1.75–1.99 |
60 |
58 |
– |
2 |
– |
54 |
50 |
– |
3 |
1 |
|
2.00–2.24 |
42 |
39 |
1 |
1 |
1 |
44 |
31 |
1 |
9 |
3 |
|
2.25–2.49 |
28 |
24 |
– |
3 |
1 |
23 |
9 |
4 |
5 |
5 |
|
2.50–2.99 |
48 |
33 |
1 |
11 |
3 |
20 |
5 |
5 |
1 |
9 |
|
3.00–3.49 |
32 |
17 |
3 |
2 |
10 |
14 |
3 |
7 |
– |
4 |
|
3.50–3.99 |
15 |
11 |
1 |
– |
3 |
1 |
– |
– |
1 |
– |
|
4 and more |
20 |
2 |
13 |
– |
5 |
1 |
– |
1 |
– |
– |
|
midpoint |
2.25 |
2.11 |
4.36 |
2.54 |
3.44 |
1.80 |
1.69 |
2.78 |
2.08 |
2.54 |
|
According to: BDPMO of Rosstat, EMISS. |
||||||||||
Figure 5. Total fertility rate of municipalities of the North of Russia, calculated by the method of indirect standardization, averaged values for 2015–2017 and 2021–2023
According to: BD PMO of Rosstat EMISS.
Table 6. Correlation matrix of fertility rates and ethnic composition of municipalities of the North of Russia (n = 294)
|
Indicator (2021) |
Average number of children born by age, 2021 |
TFR, 2021– 2023 |
|||||||
|
15–17 years |
18–19 years |
20–24 years |
25–29 years |
30–34 years |
35–39 years |
40–44 years |
45–49 years |
||
|
Number of nationalities |
-0.03 |
-0.23 |
-0.40 |
-0.55 |
-0.58 |
-0.55 |
-0.53 |
-0.55 |
-0.52 |
|
Share of Russians, % |
-0.06 |
-0.09 |
-0.30 |
-0.57 |
-0.74 |
-0.82 |
-0.84 |
-0.82 |
-0.57 |
|
Share of titular, % |
-0.05 |
0.01 |
0.09 |
0.42 |
0.60 |
0.68 |
0.69 |
0.69 |
0.50 |
|
Share of small-numbered indigenous people, % |
0.22 |
0.23 |
0.48 |
0.44 |
0.41 |
0.44 |
0.43 |
0.42 |
0.28 |
|
Share of titular and small-numbered indigenous people, % |
0.07 |
0.13 |
0.33 |
0.60 |
0.75 |
0.83 |
0.84 |
0.83 |
0.59 |
|
Share of others, % |
-0.06 |
-0.17 |
-0.20 |
-0.22 |
-0.20 |
-0.19 |
-0.20 |
-0.22 |
-0.20 |
|
Mosaicism index |
0.09 |
-0.01 |
0.23 |
0.17 |
0.17 |
0.16 |
0.17 |
0.13 |
0.05 |
Note. Values significant at the 0.999 level are in bold.
According to: Census results – 2021; BDPMO of Rosstat, EMISS.
indicators are also characteristic of the majority of small-numbered indigenous peoples. The Nenets, Dolgans, Khanty and Even are particularly notable. At the same time, the Itelmen, Kamchadals, Sami and Veps have fertility rates below the level of simple reproduction.
The analysis of the population of municipal entities in real generations demonstrated that the average number of children among women aged 20 to 39 years increased over 2010–2021. However, these indicators are largely due to the calendar shift associated with the implementation of fertility stimulation programs and the generally favorable socio-economic situation in the early 2010s. The data of conditional generations obtained by the method of indirect standardization of CSR show that from 2015–2017 to 2021–2023 fertility rate decreased in 89.2% of municipal entities in the North of Russia. The median value of the total fertility rate for all municipalities decreased from 2.25 to 1.80. Municipal analysis confirmed the rapid convergence of reproductive attitudes of small-numbered indigenous people indigenous with the rest of the population. Although areas of compact settlement of small-numbered indigenous people still show higher results, the gap is narrowing.
Correlation analysis has shown that the share of titular and small-numbered indigenous people in the population describes fertility rate better than other indicators of ethnic composition. For women aged 15 to 24, fertility is most strongly correlated with the share of small-numbered indigenous people in the population. The identified regularities can be used in the construction of demographic forecasts at the regional and municipal levels, as well as in the development of measures of demographic policy.
We can conclude that for some time to come the small-numbered indigenous peoples of the North will be in the mode of expanded reproduction. At the same time, regional demographic and social policy should be ready for the convergence of reproductive plans and needs of indigenous peoples with the rest of the Russian population. Simultaneously with the decrease in the final fertility rate, the way of life and economic behavior of the small-numbered indigenous peoples of the North will be transformed. Further research should pay attention to the issues of fertility dependence in the municipalities of the North of Russia on the location of social infrastructure facilities in the conditions of high migration outflow.
