Fish industry of the Murmansk oblast in the system of the regional economic safety

Author: Vasilyev Anatoliy Mikhailovich
Journal: Economic and Social Changes: Facts, Trends, Forecast @volnc-esc-en
Section: Branch-wise and regional economy
Article in issue: 5 (17) т.4, 2011.
Free access
The value of the fish industry of the European North of the Russian Federation in the system of food and economic safety of the region and the country is considered. The structure and the condition of the fishing fleet, fishery economic efficiency, and the potential factors of the development (the raw base, the technical policy, normative legal provisioning) are analyzed. The directions of the increase of the efficiency of the regional fish industry’s functioning are proved.
European north of the russian federation, fish industry, industrial and financial activity, potential factors of development
Short address: https://sciup.org/147223299
IDR: 147223299 | UDC: 639.2/3(470.21)
Text of the scientific article Fish industry of the Murmansk oblast in the system of the regional economic safety
As world practice shows, sustainable economic development is not possible without the multiplying of human capital. Its value in terms of modernization of all aspects of social life is increasing steadily. As the World Bank estimates [1], in the developed countries 64% of the national wealth belongs to human capital, 16% to physical, and only 20% to raw materials factor.
In Russia, by contrast, raw capital occupies 72%, in 14% – physical and human capital; Russia takes 71st place in the world by the quality of human capital [5].
In this regard, human capital is listed as a key factor of the transition to an innovative type of economic development, designated in the Concept of socio-economic development of the Russian Federation until 2020 [9].
* The paper was prepared with the financial support of the Russian Humanitarian Foundation (the project «Public health of the regions of the Northwest Federal District of Russia and the Republic of Belorussia as a strategic component of the labor potential» № 11-22-01002a/Bel).
Man as an important part of social wealth has been considered in the works of representatives of classical political economics [6]. In the works of economists of the subsequent schools it was noted that the man is not only the main means of production of this wealth, but also “serves as the ultimate goal of wealth...” [11].
The foundation of human capital theory was laid down in the second half of the twentieth century. Then the idea of priority of human development received scientific evidence and recognition of the society (T. Schultz in 1979, and H. Becker in 1992 were awarded with the Nobel Prize in economics for laying the foundations of the theory), it was launched in national development and international cooperation projects.
The subsequent evolution of this theory has provided recognition in the new millennium of science, education, technology and healthcare as the key factors in the socio-economic development.
Russian researchers define human capital as a set of qualities that affect labor productivity and are a source of income for individuals, families, businesses and society [4]. These qualities are usually considered to be natural abilities, knowledge, abilities, skills acquired through formal training or education or through personal experience, creativity, and moral-psychological and physical health, motivation of activities, providing the opportunity to generate income.
Study of scientific basis for sustainable socio-economic systems shows that the concept of “sustainable development” in its broadest sense is interpreted as the harmonization and balanced development of economic, social and environmental subsystems [18]. At the heart of the concept of “sustainable development” there is the principle of “reproduction of human rights”, according to which the access to resources and opportunities for a balanced development should be provided with not only present but also future generations.
Sustainability includes the issues of equitable distribution of development opportunities within each generation, without sacrificing anyone’s interests, needs and opportunities. In this vein, human capital development must be related to such goals as freedom of choice of lifestyle and basic life benefits, a long healthy and active life, continuing education throughout life, the possibility of obtaining the resources necessary for decent living, high quality of life and harmonious development.
Thus, population viewed in the context of the ideology of human capital development, quantitative and qualitative potential of its reproduction is a condition, the basis and the goal of sustainable development of the society and the state [10].
Health and demographic processes. Government policy in any area of public life should be first of all accentuated to addressing the most urgent, priority tasks. In recent years, the problem of depopulation – a steady population decline in Russia – has been included into them. A fundamental factor in shaping demographic processes is the public health; the development of such processes as mortality and fertility, and life expectancy largely depends on its level.
Thus, the health of the nation shall determine the number and quality of human resources not only at present but also in the future [15, p. 18]. A population possessing a certain living and labor potential loses it at every stage of generations due to injury, illness, abortions, stillbirth, premature mortality, etc.
The currant demographic situation in Russia is characterized by a persistent population decline that began in 1992. During the period from 1992 to 2009 it decreased by 4.3%. Reduction was observed mainly in Asian pert of the country (-11.3%). In the European part of Russia there was observed a slight (-2.6%) decrease in population, mainly in the period from 2002 to 2009 The analysis of population changes in federal districts reveals that in the European part of Russia, the problem is most acute in the North-West Federal District (-11.8%). The data in table 1 show the unevenness of depopulation process within the district and allow to allocate especially problem “northern” areas: the Murmansk Oblast (-27.9%), Komi Republic (-21.5%), the Arkhangelsk Oblast (-18.8%) and relatively problem-free the Kaliningrad (+4.3%) and the Leningrad (-2.7%) Oblasts. The position of the Vologda Oblast is close to the median.
Significant reduction in population between 1992 (the year with a maximum number) and the present is due to its large natural wastage. Despite the favorable trends in natural population growth in recent years and the level of net migration, the situation remains critical, especially in the northern regions and republics of the NWFD (tab. 2) .
Another trend of modern development is the demographic impoverishment of the village, because the reduction of the population is more characteristic of rural areas. Population decline in the NWFD was 12% (urban and rural – 11 and 13% respectively). In the Vologda Oblast the overall decrease in population was 10% over the same period, urban population – almost 6%, rural – 19%.
The natural loss of the villagers in the Vologda Oblast in 2009 was 75% of the overall reduction, in the rest it was due to out-migration. The share of urban population in the Oblast has increased by 4% (tab. 3) .
The urbanization of Russian territories is taking place, exposing rural communities, which poses a threat to rural development and its sustainable development.
Table 1. Population change in the NWFD subjects
|
Territory |
Population size, thous. people (on January, 1) |
Population change in relation to the number at the beginning of the period,% |
||||
|
1992 |
2002 |
2009 |
1992/2002 |
2002/2009 |
1992/2009 |
|
|
North-West Federal District |
15259 |
13972 |
13462 |
-8,4 |
-3.7 |
-11.8 |
|
Murmansk Oblast |
1170 |
905 |
843 |
-22.6 |
-6.9 |
-27.9 |
|
Komi Republic |
1222 |
1029 |
959 |
-15.8 |
-6.8 |
-21.5 |
|
Arkhangelsk Oblast |
1554 |
1350 |
1262 |
-13.1 |
-6.5 |
-18.8 |
|
Pskov Oblast |
837 |
769 |
696 |
-8.1 |
-9.5 |
-16.8 |
|
Novgorod Oblast |
748 |
700 |
646 |
-6.4 |
-7.7 |
-13.6 |
|
Republic of Karelia |
789 |
721 |
687 |
-8.6 |
-4.7 |
-12.9 |
|
Vologda Oblast |
1353 |
1278 |
1218 |
-5.5 |
-4.4 |
-10.0 |
|
St. Petersburg |
4986 |
4688 |
4582 |
-8.6 |
-2.3 |
-8.1 |
|
Leningrad Oblast |
1678 |
1672 |
1632 |
-0.4 |
-2.4 |
-2.7 |
|
Kaliningrad Oblast |
898 |
955 |
937 |
6.3 |
-1.9 |
4.3 |
Sources: Regions of Russia. Socio-economic indicators / 2004: stat. coll. / Rosstat. – M., 2004. – 966 p.; Demographic Yearbook of Russia 2009: stat. coll. / Rosstat. – M., 2009. – 525 p.
Table 2. Typology of NWFD regions by indicators of population dynamics (1992 – 2009)
|
Results of aggregate change |
Results of natural change |
Results of migration |
Subject of the North-West Federal District |
|
Population reduction |
Natural loss |
Migration loss |
Komi Republic, Karelia, Arkhangelsk and Murmansk Oblasts |
|
Natural loss |
Migration increase |
Leningrad, Novgorod, Pskov, Vologda Oblasts, St. Petersburg |
|
|
Population increase |
Natural loss |
Migration increase |
Kaliningrad Oblast |
|
Natural increase |
Migration loss |
Nenets Autonomous District |
Table 3. The share of urban population in total population on 1 January, %
|
Territory |
1992 |
1995 |
2000 |
2005 |
2008 |
2009 |
2009 to 1992 in % |
|
Russian Federation |
73.6 |
72.9 |
73.13 |
72.9 |
73.1 |
73.1 |
100 |
|
North-West Federal District |
82.3 |
81.9 |
82.2 |
82.3 |
82.3 |
82.4 |
100 |
|
Vologda Oblast |
65.9 |
67.4 |
68.7 |
68.0 |
68.6 |
68.8 |
104 |
The natural loss of population in the region is not compensated by the migration movement. Since 2001, the level of net migration in the Vologda Oblast remains very low (fig. 1) : in 2009 it amounted to only 0.5 people for 10 thousand people of the population.
For comparison: in 2008 in Russia (international migration) and in the NWFD the net migration rates were 3 – 4 times more than in the Vologda Oblast (17 and 21 people per 10 thousand people of the population, respectively). In the European Union in 2008 the figure was 29 people per 10 thousand people of the population.
The increase in gender disparities. The gender ratio is of primary importance in the reproduction of population. Saving gender parity is good for demographic development. Demographers estimated the sex ratio distortion in Russia that emerged in the XX century, had no equal in the country’s history. In 1946, women outnumbered men by 33.9% [2, p. 158].
Thereafter, for more than half a century, until 1995, the gender structure of the Russian population improved. Under the influence of the processes having occurred in the society in the 90s of the twentieth century (supermortality of men, ethnic conflicts, etc.), the gender ratio began to deteriorate again and by the time of the 2002 census, the number of women again exceeded the number of men by 14.7%. These disparities have remained by 2009 (14%; in the Vologda Oblast – 15.5%).
High mortality rate and a significant difference in life expectancy between men and women (in the Russian Federation in 2009 – 62.7 years and 74.7 years respectively) shall affect the further increase in gender imbalance (for example, in early 2009 there were 85 men per 100 women in the Vologda Oblast, and in 2020 this figure will be equal to 83).
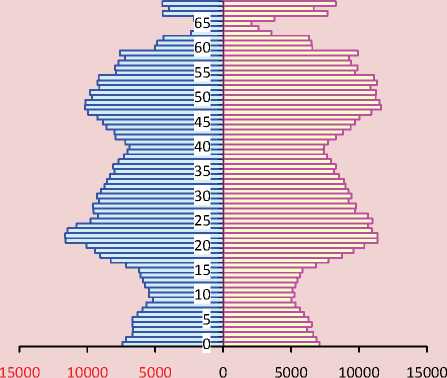
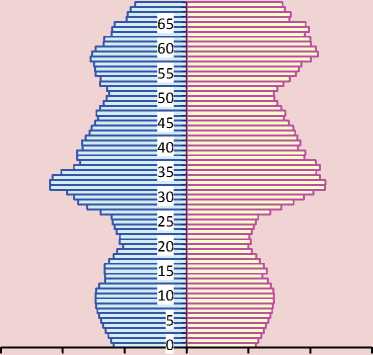
Many possible changes in the demographic sphere are clearly visible when comparing modern and prognostic age-sex pyramids:
Figure 1. Migration increase / decrease in the Vologda Oblast, people
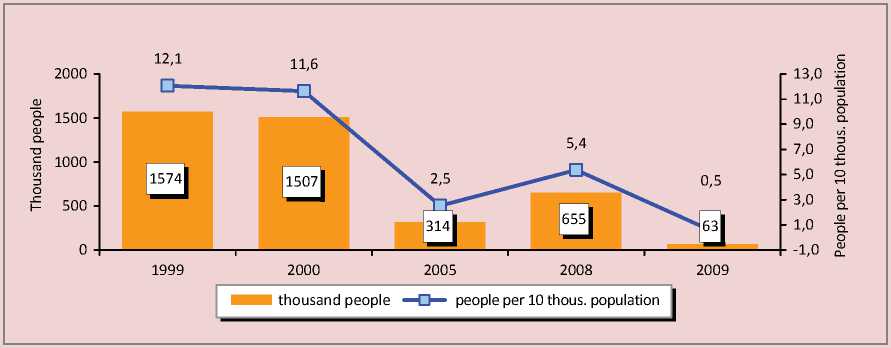
Source: Statistical Yearbook of the Vologda Oblast: stat. collection. – Vologda, 2009. – P. 47, authors’ calculations.
-
> compression of the pyramid to the age axis shows the decrease of the total population size;
-
> the tapered base indicates a decline in fertility;
-
> the increased asymmetry of the age-sex pyramid indicates an increase in gender disparities;
-
> the broad upper part warns of the imminent increase in mortality, etc. (fig. 2) .
Figure 2. Sex and age composition of the population of the Vologda Oblast (left – at the beginning of 2009; right – the forecast at the beginning of 2020; people)
The analysis shows that the demographic situation in the Vologda Oblast is far from favorable. Even in comparison with the average for Russia and the NWFD the Vologda Oblast loses: it has a higher level of mortality, a significant economic burden on individuals of working age, low levels of migration.
Life expectancy. The integral indicator of public health and demographic development is the life expectancy, which has been lower for a long historical period in Russia than in developed countries.
But if in 1970s the gap was not very great, now it is 15 – 19 years for men and 7 – 11 years for women.
Given the conventional separation of the states according to the level of income adopted in the international statistics, there are four groups of countries (high, upper middle, lower middle and low income). Russia is in a group of lower middle income, and health indicators of our countrymen at the present stage of historical development are comparable to those of developing countries such as Morocco and Nigeria (tab. 4) .
The period since 2000 to 2008 was characterized by stabilization of the political and socio-economic processes in the Russian Federation, economic recovery and living standards improvement. This is certainly reflected in the state of public health. During this period, the life expectancy of the population has grown by nearly 3 years – from 65 in 2000 to 67.9 in 2008 (tab. 5) . The level of infant mortality has decreased by 40%.
However, such small positive moves cannot be regarded as the beginning of sustainable change in public health of the Russian population for the better.
Men
Women
Figure 2. Sex and age composition of the population of the Vologda Oblast (left – at the beginning of 2009; right – the forecast at the beginning of 2020; people)
15000 10000 5000 0 5000 10000 15000
Men Women
Table 4. Infant mortality, average life expectancy and gross national product in Russia, in the world and in some countries (2007)
Area Child mortality under 1 year per 1,000 of live births Life expectancy at birth (years) GDP per 1 inhabitant (PPP int. doll.)* Men Women The whole world 46 65 70 9872 High level (average life expectancy of 80 years) USA 6 76 81 45850 Canada 5 78 83 35310 Japan 3 79 86 34600 Rwanda 109 49 51 14400 Argentina 14 71 79 12990 Highest average level (average life expectancy of 70 years) Brazil 20 70 76 9370 Egypt 30 66 70 5400 Lowest avera ge level (average life expectancy of 68 years) Morocco 32 70 75 3990 Russia 10 60 73 2930 Nigeria 83 48 50 1770 Low level (average life expectancy of 57 years) Haiti 57 59 64 1150 Guinea 93 52 56 1120 PPP int. doll. – purchasing power parity in international dollar rate Source: World development indicators 2007. – Washington: DC, World Bank, 2008. – URL: (selection February 13, 2009). Source: World health statistics 2009 / World Health Organization, 2009. – URL:
Table 5. Life expectancy of the population in the NWFD
|
Region |
1991 |
1995 |
2000 |
2005 |
2006 |
2007 |
2008 |
2009 |
|
North-West Federal District |
68.9 |
63.7 |
64.5 |
64 |
65.6 |
67 |
67.4 |
68.2 |
|
Novgorod Oblast |
67.2 |
62 |
62.8 |
61.7 |
62.7 |
64 |
63.6 |
64.5 |
|
Pskov Oblast |
67.6 |
62 |
61.9 |
60.2 |
61.2 |
64.1 |
63.6 |
64.5 |
|
Komi Republic |
67.9 |
61 |
63.5 |
62.3 |
64.2 |
65.8 |
66.2 |
66.5 |
|
Karelia Republic |
68.2 |
60.8 |
62.9 |
62.1 |
63.8 |
65.1 |
65.5 |
66.6 |
|
Leningrad Oblast |
67.9 |
62.3 |
63 |
62 |
63.1 |
64.6 |
65.2 |
66.7 |
|
Murmansk Oblast |
70.4 |
63 |
64.5 |
63.8 |
65.2 |
66.7 |
66.7 |
67.2 |
|
Vologda Oblast |
69 |
64 |
65.7 |
63.1 |
65.4 |
67 |
66.9 |
67.3 |
|
Arkhangelsk Oblast |
69.1 |
62.8 |
62.8 |
62.9 |
64.8 |
66.3 |
66.9 |
67.6 |
|
Kaliningrad Oblast |
68.5 |
64.7 |
63.6 |
61.5 |
64.1 |
65.8 |
66.5 |
67.7 |
|
St. Petersburg |
69.5 |
66 |
66.7 |
67.8 |
68.9 |
69.9 |
70.5 |
71.2 |
With great caution we can only assume that the population began to adapt to the prevailing socio-political and socio-economic situation. It should be borne in mind that the situation can move in any direction.
An important reason for Russia’s lag in terms of LE from the developed countries is the low value of the gross national product per capita. In Russia the figure is 16 times lower than in the U.S., 12 times lower than in Japan and Canada. The value of GDP is an integral indicator: low GNP is the poor quality of food, bad water in the water supply system, fake alcohol, low salaries of doctors and the appropriate level of medical care, inability to purchase medical equipment, needed (expensive) drugs, poor quality or complete absence of treatment facilities at factories, sewage flows leading to an increase in infectious diseases, as well as prostitution, including the children’s one, crime, corruption which aggravate the negative situation, the growing social and material differentiation and polarization of the population, etc. [13, pp. 41-55].
In addition to the GNP, a depth and breadth of social inequality, which is formed as a result of the implementation of redistributive relations, have not less, but even greater impact on the quality of the population and sustainable development of the areas [3].
Aging of the population. In direct relation to the natural reproduction and migration is the formation of population age structure, the deterioration of which occurred in parallel with the processes of depopulation. Demographers concern that for the first time in Russian history, the proportion of elderly population has exceeded the proportion of children. In 56 regions of the country the share of children and adolescents account for less than one fifth of the population (at the beginning of 2000 there were 41 such regions, in 1990 – 3).
According to the UN classification of the state population is considered old if the proportion of people aged 65 and older among the inhabitants is more than 7%; at the beginning of 2009 10% of the Russians were in the above age groups. In the Vologda Oblast the share the
“old” population was twice the limit set by the WHO. Among the regions of NWFD the most critical situation is observed in the Novgorod and Pskov Oblasts (tab. 6) .
At first glance, the causes of aging seem obvious. Many people believe that in general the population is aging in the same way as separate individuals: life expectancy has increased, so, in total the whole population is aging. It is logical; there is every reason to believe that the achievement of a growing number of people the lower limit of the elderly age by reducing death rates in the previous period of life is an important prerequisite for the formation of the population aging process. But the main reason defining this process in the modern period is not the increase in forthcoming life expectancy for people of elderly age but the declining share of young people as a result of fertility decline. There is a circular relationship: the higher are the fertility rates, the younger the population in average is, and vice versa – the higher is the proportion of young people, the higher the fertility rates are.
Degradation of the demographic structure of the population has a direct impact on the overall level of fertility. To illustrate this thesis, we consider the change in the total fertility rate required for simple reproduction. In 2007 – 2008 for the replacement of parental cohorts with children’s generations it was necessary to an average Russian woman of childbearing age
Table 6. The proportion of population aged 65 and older in the regions of the North-West Federal District, in %
At the same time, achieving at least a minimal population growth, which is extremely needed in Russia, suggests higher rates of fertility: it means that in 2007 per one woman of reproductive age it would require 2.2 – 2.5 of live births, and already in 2025 at least 3.5 – 4.
The process of demographic disadvantage growth (causing a permanent increase in the minimum birth rates required to exit the demographic hole) is associated with adverse changes in the sex-age composition of the population. Low fertility of the past years leads to a situation of rapid reduction in the number of female reproductive contingents, which automatically triggers a further decline in fertility in the very approximate future. Reduction in the population represents the most serious threat to the national state security. Maintaining the current level of fertility and mortality will lead to the fact that the population of our country could reach about 123 million by the beginning of 2025, having decreased by 20 million people compared to 2006 (or 1/7).
Labor potential as a form of human capital implementation. For Russia, which has nominated the task of society modernization as the priority objective, a high-quality human capital is required. Demographic resources of the society in which human capital is formed, have quantitative measurement.
One of the quantitative indicators reflecting the problem field of labor potential as a major component of human capital is the population of working and younger working age. Currently, these indicators show negative trends for the sustainable development of territories.
The number of working age population, the main carrier of the labor potential of the Russian society, is beginning to decline noticeably today already. This trend will continue in the future. According to the forecast of Rosstat by 2030 working age population in Russia will decrease by almost 12% (tab. 7) . According to the calculations made in ISEDT RAS, the reducing of this population category in the Vologda Oblast will amount to 18% by 2020 [19].
The effectiveness of the state’s innovation efforts depends greatly on the proportion of young people in the total labor force. In this regard we have to state that this category of the population is projected to remain unchanged and will be the same 16% as in the base year of the forecast. The share of Russian population aged 60 and older will increase by 27% by 2030 .
In other words, between 2008 and 2030, the population aging will continue, the consequences of which will be significant for demographic (“base” for low fertility and high mortality rates), economic (slowdown in labor substitution, increase the load on the workingage population) and social (increase in spending on social welfare, increased load on social infrastructure) aspects of social life.
Reducing the number of working age people can be a significant obstacle to further economic growth. Labor force shortage which is not always apparent under the conditions of crisis economic phenomena, in the long term would require compensation, either by increasing labor productivity (and besides for GRP growth rate in the Vologda Oblast to be comparable with that of the GDP of the Russian Federation, the region will require higher labor productivity growth rates than those that are planned for the whole country), or the migration of labor force from other regions of the Russian Federation and from abroad [19].
Extremely high mortality rate of working age people has an adverse effect on the quantitative indicators of Russia’s labor potential: about one third of all deaths per year are able- bodied adults, which is on average three times higher than in the developed countries and two times higher than in the developing ones [1].
One of the first leading causes of death is occupied by external causes (accidents, poisoning, injuries). Deaths from injuries in Russia are much higher than in the developed countries (tab. 8) .
Quantitative reduction in the labor force is compounded by reduction of its quality. Monitoring measuring of the qualitative state of the labor potential in the region held in the Vologda Institute of Socio-Economic Development of Territories of RAS since 1997, show a downward characteristics trend, urgently needed in the transition to innovative development.
Thus, the index of creativity, which is calculated by the original method (in terms of man’s relation to creative work and his or her actual participation in the creative work), is the lowest among the eight basic quality indices1 of labor potential (tab. 9) .
Table 7. Population forecast of the Russian Federation by age groups (inertial version, at the beginning of the year)
|
Years |
Younger than working age |
Working age |
Older than working age |
|||
|
thous. people |
as a percentage of the total population |
thous. people |
as a percentage of the total population |
thous. people |
as a percentage of the total population |
|
|
2011 |
23185.4 |
16.3 |
87524.0 |
61.7 |
31286.7 |
22.0 |
|
2020 |
25935.1 |
18.3 |
79033.2 |
55.7 |
36939.7 |
26.0 |
|
2025 |
25148.2 |
17.8 |
77148.0 |
54.8 |
38619.9 |
27.4 |
|
2030 |
22845.4 |
16.4 |
76770.5 |
55.1 |
39755.9 |
28.5 |
|
Source: gks.ru |
||||||
Table 8. Deaths from injuries and external causes (per 100 thousand people)
Country Index How much mortality rate in Russia higher Russia 159 - France 48 3,3 times USA 47 3,3 times Japan 39 4,1 times Germany 29 5,5 times Source: Aganbegyan A.G. On Health Care Reform (January 2011). – Available at:
Table 9. Evaluation of labor potential quality of the Vologda Oblast [19]
|
The composition of the measured indicators |
Index value |
Rank |
Trend line (since 1997 to 2009) |
|
|
1997 |
2009 |
|||
|
Moral level |
0.775 |
0.757 |
1 |
\ decreasing |
|
Mental health |
0.699 |
0.739 |
2 |
/ increasing |
|
Sociability |
0.733 |
0.736 |
3 |
– parallel to the time axis |
|
Physical health |
0.682 |
0.728 |
4 |
/ increasing |
|
Cultural level |
0.609 |
0.674 |
5 |
/ increasing |
|
Need for achievement |
0.612 |
0.643 |
6 |
/ increasing |
|
Cognitive capacity |
0.630 |
0.614 |
7 |
\ decreasing |
|
Creative potential |
0.593 |
0.572 |
8 |
\ decreasing |
|
The integral index of labor potential quality (social competence) |
0.655 |
0.674 |
/ increasing |
|
1 The system of labor potential quality components is represented as a “tree” of properties, the apex of which is the most common property, social competence. According to the methodology, based on the monitoring, such structural components of labor potential are measured as population’s physical and mental health, cognitive capacity, creativity, sociability, cultural and moral level, need for achievement. The integral index of individual quality, as well as the partial indices may not acquire a zero or negative value (as, for example, there cannot be zero-health). It is always a positive value greater than zero. The maximum value is unity.
The cognitive capacities of the population measured in this study also tend to diminish in the long term. The main reasons for this situation are reduction of the base level of general education and basic breach of continuity in the development of professional knowledge and skills. The results of the International Programme for Student Assessment (PISA)2, which made measurements four times in 2000 – 2009 show that the results of the Russian students are lower than their peers in OECD countries. A decrease in intellectual performance of the labor potential of Russian regions is also contributed by the so-called “brain drain”. Researchers estimate [14, p. 25-30] that “the scope of this process over the last 25 years amounted to about 1 million people”.
The current state of intellectual potential, a major component of human capital creates risks for the transition to innovative development. On the one hand, the domestic economy is full of manpower with higher education, on the other hand, as the studies show, they are used inefficiently and do not act as “engine” of innovation progress.
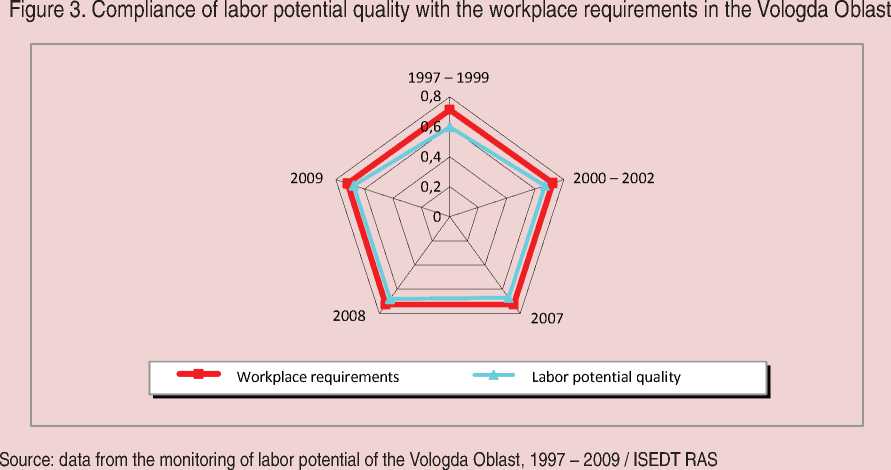
Targets of the labor potential development, both individually and on a social level is to match the demands of innovative economy (fig. 3) .
However, the conducted analysis shows that the requirements of the economy to the quality of the working population increase more rapidly than the quality of labor potential, which indicates that having high degree of depreciation of fixed assets of enterprises3 and their low innovation activity people work “with their last strength”, i.e. in addition to quantitative loss there is quality workforce “wear”.
World experience shows that “human capital significantly enhances the competitive position of workers: the greater it is, the higher economic activity and employment is, the less the risk of falling into unemployment and the shorter its duration is, the higher the earnings and greater the access to attractive jobs are; the more intense the professional and territorial mobility is” [8].
The dynamics of relative indicators of economic activity of the Vologda Oblast’s population in 1992 – 2008’s has two periods:
-
- since 1992 to 1995 the level of economic activity was declining, employment and unemployment rates were increasing;
-
- since 1995 to 2008, opposite trends were seen: the level of economic activity and employment in the region has risen and unemployment declined (tab. 10) . In 2009, in connection with the financial and economic crisis, these trends were again interrupted.
Changes in employment and unemployment rates in the Vologda Oblast in the period since 1992 to 2009 had similar trends as the trends of these indicators in the average NWFD and Russia.
In Russian conditions, education has a significant impact on key labor market indicators. So, if the level of education increases the employment rate grows significantly: it reaches the maximum value (81%) for people having diplomas of higher education (tab. 11) . A similar relationship can be traced between education and wages. With regard to unemployment, its level is about two times lower among people with higher education than in most other groups.
Table 10. Key indicators of labor utilization, in %
|
Indicator |
Years |
|||||
|
1992 |
1995 |
2000 |
2005 |
2008 |
2009 |
|
|
Russian Federation |
||||||
|
Level of economic activity |
70.3 |
64.8 |
65.5 |
- |
67.7 |
75.7 |
|
Employment rate |
- |
90.5 |
58.5 |
61.1 |
63.4 |
62.2 |
|
Unemployment rate |
5.2 |
9.5 |
10.6 |
7.2 |
6.3 |
8.2 |
|
North-West Federal District |
||||||
|
Level of economic activity |
71.8 |
67.3 |
66.4 |
- |
71.2 |
70.8 |
|
Employment rate |
- |
- |
60.0 |
64.8 |
67.5 |
66.0 |
|
Unemployment rate |
5.8 |
10.7 |
9.6 |
5.5 |
5.2 |
6.8 |
|
the Vologda Oblast |
||||||
|
Level of economic activity |
70.0 |
67.4 |
67.9 |
68.1 |
69.0 |
70.7 |
|
Employment rate |
- |
91.2 |
62.3 |
64.6 |
65.0 |
65.1 |
|
Unemployment rate |
3.0 |
8.8 |
8.3 |
5.2 |
5.9 |
7.9 |
|
Source: Statistical Yearbook of the Vologda Oblast. – Vologda, 2010. |
||||||
Table 11. Employment rate of the RF population in terms of education (as a percentage of the population of the respective educational group)
|
Year |
Total |
Having education |
||||||
|
higher professional* |
incomplete higher professional |
secondary vocational |
basic vocational |
secondary (complete) general |
basic general |
having no basic general |
||
|
2000 |
58.7 |
79.3 |
54.3 |
72.7 |
68.7 |
57.2 |
33.2 |
16.5 |
|
2001 |
58.4 |
80.0 |
40.8 |
72.2 |
69.6 |
54.4 |
27.4 |
11.8 |
|
2002 |
59.4 |
79.8 |
41.6 |
73.6 |
70.1 |
54.8 |
27.1 |
11.4 |
|
2003 |
60.1 |
80.8 |
42.4 |
74.2 |
75.2 |
53.5 |
29.6 |
12.7 |
|
2004 |
60.2 |
81.5 |
39.3 |
73.7 |
74.2 |
52.6 |
26.7 |
10.4 |
|
2005 |
61.5 |
82.0 |
40.0 |
75.4 |
76.0 |
52.9 |
28.2 |
14.5 |
|
2006 |
61.7 |
81.9 |
37.6 |
75.4 |
76.1 |
52.0 |
28.2 |
12.5 |
|
2007 |
63.2 |
83.2 |
39.7 |
75.8 |
75.9 |
51.7 |
29.0 |
11.4 |
|
2008 |
63.1 |
82.9 |
37.0 |
74.8 |
73.6 |
52.1 |
25.2 |
11.6 |
|
2009 |
62.3 |
81.2 |
- |
73.5 |
71.2 |
49.0 |
25.2 |
10.7 |
* 2009 – including individuals with post-graduate education.
Table 12. Dynamics of labor productivity and the average monthly wage, in % to 2000
|
Indicators |
2000 |
2005 |
2006 |
2007 |
2008 |
2009 |
|
Labor productivity in Russia |
100 |
130.1 |
139.9 |
149.9 |
156.76 |
146.81 |
|
Labor productivity in the Vologda Oblast |
100 |
136.9 |
123.7 |
131.0 |
135.62 |
131.46 |
|
Average monthly real wages in Russia |
100 |
203.2 |
231.7 |
264.8 |
297.3 |
294.5 |
|
Average monthly real wages in the Vologda Oblast |
100 |
182.6 |
202.1 |
217.1 |
237.0 |
227.2 |
|
Source: Regions of Russia. Socio-economic indicators. 2010: stat. collection // Rosstat. - M., 2010. - 996 p. |
||||||
People having minimum of human capital are more often subject to the most severe, stagnant forms of unemployment, while having higher education provides them almost complete immunity.
One of the main indicators of balance in the economy is the ratio of wages and productivity. Anticipatory increase in labor productivity relative to wages means the presence of sources of expanded reproduction financing in the economic sectors [7, p. 27-38]. In the Vologda Oblast, as well as in Russia as a whole, the situation is reversed – wages are increasing faster than labor productivity. Thus, over the period 2000 – 2009 average real wages in the Vologda Oblast grew 2.3 times, while labor productivity has declined (tab. 12) , indicating a narrowing of the sources of economic development.
The most fundamental issue of human capital of Russia is how the resources that our economy gets as a result of its operation are distributed among the populations. Even according to the official estimates of Rosstat it turns out that more than 30% of total revenues, which are available in the country go to less than 10% of the population. And the poorest get less than 2% of these revenues. That is, even by the official standards the inequality is very large. The face of poverty in Russia is mainly formed by the working population. This situation may be changed by redistribution of over incomes of the so-called “elite” [20].
Human capital renovation is the priority direction of the country’s sustainable development. The prospects for Russia’s transition to post-industrial stage of development depend on the quality and structure of human capital. But this requires a clear system policy of the state in this area.
In conclusion, we should note that characterizing the stability of the territory, we cannot ignore that it is determined not only by the economic situation and production capacity, technology and infrastructure, but to a great extent by the condition and dynamics of the population, its quantitative and qualitative characteristics, economic activity and intellectual potential. At the same time, our analysis shows that the trends of human capital development lead to a decrease in the stability of NWFD regions, as is evidenced by:
-
- population decline;
-
- low life expectancy;
-
- aging population;
-
- increase of economic burden on the working population;
-
- contraction of the sources of economic development.
The population is a carrier of a particular capital, the human one, which is an essential component of national wealth, therefore, in forming the regional policy the development of human capital should be considered as a factor of enhancing the territory’s sustainability.
References Fish industry of the Murmansk oblast in the system of the regional economic safety
- Fishery and fish production in the Murmansk Oblast/Federal Service of the State Statistics; Territorial body of the Federal Service of the State Statistics in the Murmansk Oblast. -Murmansk, 2006 -2010.
- Vasilyev, A.M. Taxation in the fish branch/A.M. Vasilyev//Federalism. -2007. -№ 2. -Pp. 141-154.
- About the basic directions of the tax policy for the period 2007 -2009: the Report of the Ministry of Finance of the Russian Federation. . -Available at: http://www.regions.ru/news/1982531/
- Shevchenko, V.V. Comparative estimation of the power inputs of the Russian and foreign fishing fleets on catching valuable and technical kinds of fish/V.V. Shevchenko, M.V. Monakov//Fish resources. -2005. -№ 4. -Pp. 24-26.
- Prishchepa, B.F. Reserve of the raw-material base of fish industry in the seas of the European North and Northern Atlantic/B.F. Prishchepa//Fish industry. -2008. -№ 1. -Pp. 57-64.
- Fishery in the Northern Atlantic: reality and prospects: theses of the reports of the international conference in March, 15 -16, 2007. -Murmansk. -2007. -72 p.
- Economic efficiency of the Russian fishery fleet’s use in the Barents Sea. -М., 2007. -P. 53.
- Shevchenko, V.V. Bio-economy of the industrial fishery of the Barents Sea/V.V. Shevchenko, V.A. Belyaev. -Murmansk, 2009. -306 p.
- On the basic directions of the tax policy for the period of 2007 -2009 . -Available at: http://www.nisp.ru/news
- About some results of the industrial activity in fishery and processing of the fish products in the Murmansk Oblast (on the data for 2005 -2007)/Territorial body of the Federal Service of the State Statistics in the Murmansk Oblast.
