Flood runoff modelling for the planning of civil engineering protective construction: the case of Turgen soum, Uvs aimag

Author: Gombodorj Gantulga, Tsegmid Bazarkhand, Donorov Dorligjav, Sugar Munkhnaran, Batsuuri Bolormaa, Chinbat Zaya, Purevtogtokh Munkh-Erdene
Journal: Природа Внутренней Азии @nature-inner-asia
Section: География
Article in issue: 1 (23), 2023.
Free access
The study is aimed at planning civil engineering constructions based on the estimation of maximum runoff volume during the flood and determination of susceptible parcels for flood risk in the dry riverbed which directs to the centre of Turgen soum, Uvs province. We have determined the channel width, flood level, bank height, flood-prone households and parcels by flood runoff modelling using HEC-RAS software. The hydraulic analysis of civil engineering construction to avoid risk was implemented by Flow pro software. The volume of water flowing through a channel was carried out by Pipe flow advisor software. The hydraulic parameters were estimated using a digital elevation model. The maximum discharge of flood with 1% rainfall feeding was Q1%=11.06 m3/s when daily precipitation was at maximum. Therefore, there is a need for the planning of civil engineering construction that can drain the amount of the estimated discharge. The application of flood runoff modelling with the help of HEC-RAS software showed that the inundation width, channel bottom width, the difference between the highest point and the lowest point, and slope angle for the civil engineering construction were 10.66 m, 2 m, 6.01, and 0.0028, respectively. The flood-prone areas in the soum centre were 32 parcels with an area of 4.8 hectares. The hydraulic estimation results revealed 11.06 m3/s for discharge and 2 m for channel bottom width, while 0.8 m for water depth. Based on this estimation, the ferroconcrete channel for the flood will be planned to be the width of 2 m and height of 1 m and it is also calculated to be 0.2 m from the surface water level to the edge of the channel. We have suggested that the total length and discharge of the channel would be 1673 m and 13.896 m3/s.
Civil engineering protective construction, flood risk, flow modelling
Short address: https://sciup.org/148326751
IDR: 148326751 | UDC: 627.514 | DOI: 10.18101/2542-0623-2023-1-121-138
Моделирование паводкового стока для планирования инженерно-защитного сооружения: на примере сомона Турген аймака Увс
Исследование направлено на планирование инженерных сооружений на основе оценки максимального объема стока во время половодья и определения подверженных паводковому риску участков в пересохшем русле реки, направляющемся к центру Турген сомона аймака Увс. Путем моделирования паводкового стока с использованием программного обеспечения HEC-RAS были определены ширина русла, уровень затопления, высота берега, домохозяйства и участки, подверженные затоплению. Гидравлический расчет инженерных сооружений для предотвращения риска был выполнен с помощью программного обеспечения Flow pro. Объем воды, протекающей по каналу, определялся программой Pipe flow Advisor. Гидравлические параметры оценивались с помощью цифровой модели рельефа. Максимальный расход половодья при 1%-ном атмосферном питании составил Q =11,06 м3/с при максимальном количестве суточных осадков. В связи с этим возникает необходимость планирования инженерных сооружений, способных отводить объем расчетного сброса. Применение моделирования паводкового стока с помощью программы HEC-RAS показало, что ширина затопления, ширина дна русла, разница между самой высокой точкой и самой низкой точкой, а также угол уклона инженерного сооружения составили 10,66 м, 2 м, 6,01 и 0,0028 соответственно. Подтопляемыми территориями в центре сомона оказалось 32 участка площадью 4,8 га. По результатам гидравлической оценки расход воды составил 11,06 м3/с, ширина дна русла - 2 м, глубина воды - 0,8 м. Исходя из этой оценки железобетонный канал для паводка будет запланирован шириной 2 м и высотой 1 м, а также рассчитан на 0,2 м от уровня поверхностных вод до края канала. Общая длина и расход канала составят 1 673 м и 13,896 м3/с.
Text of the scientific article Flood runoff modelling for the planning of civil engineering protective construction: the case of Turgen soum, Uvs aimag
Planning engineering measures for urban planning and construction stages are consists of urban planning, construction, and renovation planning of ger district and residences is a good basis for preventing different risks and hazards in the urban areas [Tsolmon, 2015]. The importance of engineering construction is a way to protect any city and buildings against surface water runoff [Diaconu, 2021]. There is a need to set up engineering constructions based on a detailed study of surface water flow to prevent flood risk. As mentioned in the urban and town planning and construction standards, engineering facilities should be prepared to protect from environmental hazards such as flood risks, avalanches, landslides, drain surface water runoff, and decrease groundwater levels during the formulation of urban and town planning and construction design.
However, the application of the standard has not been enough in soums and/or towns1 . The development documents being formed during the urban master plan and the partial master plan have not been fully defined on the design of engineering facilities regarding flood risk estimation. Today, we are facing special needs to estimate the extent of risk in the area and to plan engineering constructions for the mitigation and elimination of flood hazards.
Materials and Methods
Study area
Turgen soum centre is regarded as the Kharkhiraa-Turgen mountain areas subregion in the Great Mountainous region of Altay according to physical geographical classification.
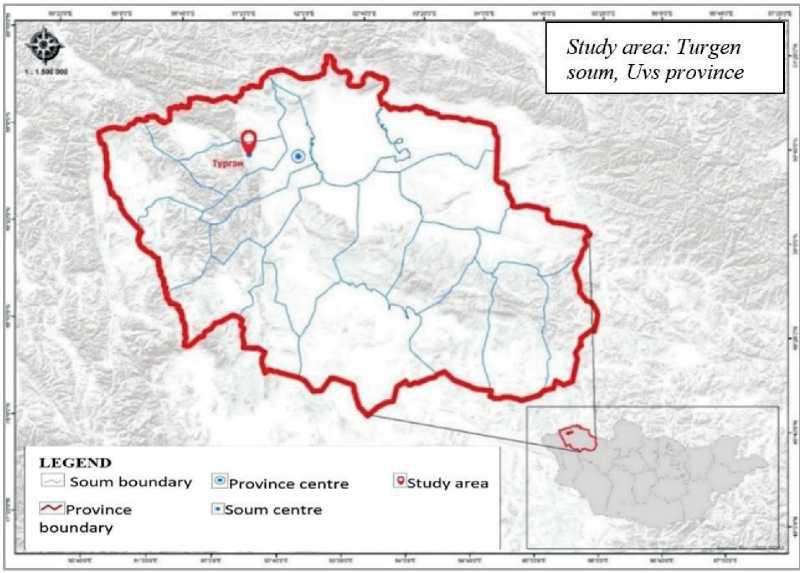
Fig. 1. Map of the study area
Methods
This study consisted of three main stages: basic investigation, data analysis, and results (Fig. 2).
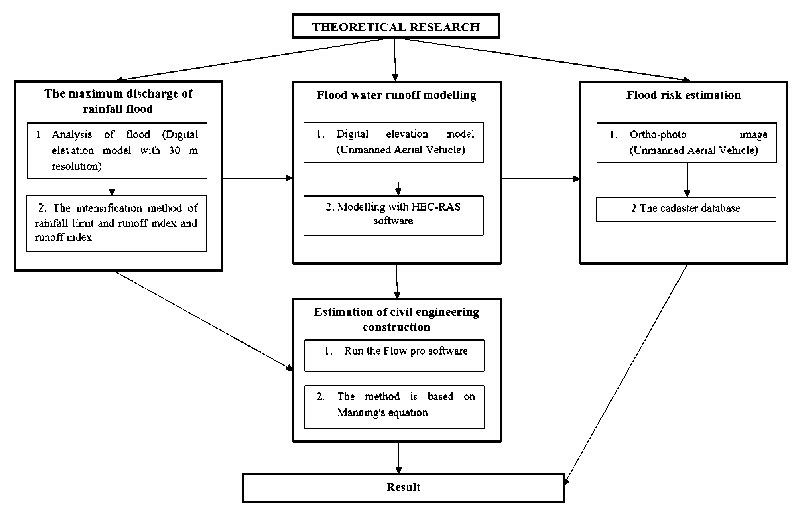
Fig. 2. Workflow of the study
The digital elevation model with 30 m spatial resolution and orthophoto images with 0.1 m resolution created by unmanned aerial vehicles were used to determine key parameters for the planning of engineering constructions. The orthophoto images were processed with the help of AgiSoft software. In this study, we determined the discharge by flood analysis, the intensification method of rainfall limit, and the runoff index in ArcGIS software. Also, runoff modelling was carried out by HEC-RAS 5.07 and civil engineering protective constructions were performed by Flow pro.
The processing of digital elevation model and orthophoto image: Orthophoto were produced by unmanned aerial vehicle and then processed by Agisoft software [Diaconu, 2021].
Flood analysis: The hydrology tool of ArcGIS is used to model flood runoff in the catchment [Diaconu, 2021].
The intensification method of rainfall limit and runoff index: The methods are applied for the determination of discharge for small rivers, streams, gullies and dry river beds with catchment areas of <200 km2 during the rainfall flood [Tsolmon, 2015].
Modelling for flood dynamics: This method is used to model flood runoff and hydraulic parameters with the help of HEC-RAS software [Landuyt, 2013].
Determination of flood-prone parcels: These parcels are determined by overlapping results of flood runoff modelling with land-use maps.
Hydraulic estimation of engineering protective construction against flood: Flow Pro software is performed for hydraulic estimation of civil engineering protective construction for drainage of floodwater [Bueno, 2011].
The method is based on the Manning equation: The method is applied for estimating the geometric volume of construction for discharge to surface water drainage facility, calculation of linkage between channel inlet and outlet, discharge capacity, and estimation of permissible and impermissible water velocity [Bueno, 2011].
Results
The maximum inundation flow volume of rainfall and estimation of discharge
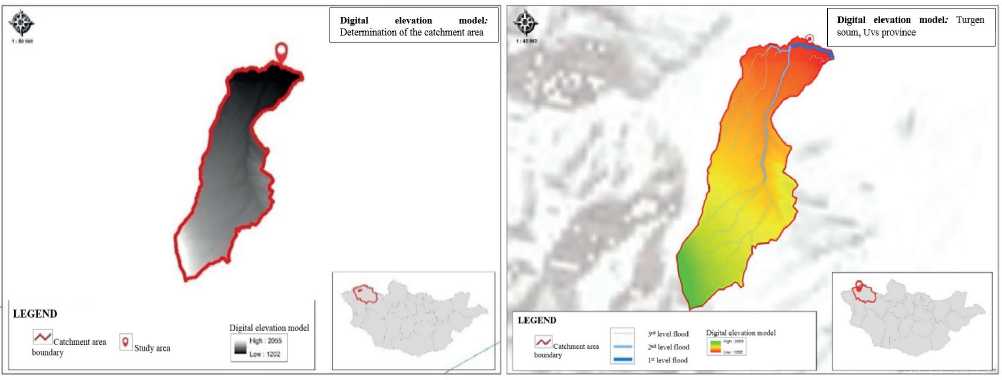
Fig. 3. Catchment area and flood risk level map
In the catchment area, there are 2 dry riverbeds with a total length of 1782.2 m are high likely to be flooded. And its tributaries consisted of 6 dry riverbeds with a total length of 5450.7 m are likely to be affected by 2nd level flood risk. The remained 23 dry riverbeds with a total length of 23387.9 m are less likely to be flooded (3rd level flood) (Table 1).
Table 1
Estimation of flood level
|
№ |
Flood risk level |
The total length of dry riverbeds, m |
The number of dry riverbeds, n |
|
1 |
1st level flood |
1782.2 |
2 |
|
2 |
2nd level flood |
5450.7 |
6 |
|
3 |
3rd level flood |
23387.9 |
23 |
|
In total |
- |
30620.9 |
31 |
The following parameters are needed for the determination of flood runoff based on the results of the analysis.
The catchment area, the total length of the gully, and the highest and lowest point of the catchment is 18.83 km2, 10.28 km, 2055 m and 1202 m, respectively (Table 2).
Table 2
|
№ |
Name |
Parameter |
Unit |
Interpretation |
|
1 |
F |
18.83 |
km2 |
The catchment area |
|
2 |
L |
10.28 |
km |
The total length of the gully |
|
3 |
H B |
2055 |
m |
The highest point of the catchment area |
|
4 |
H O |
1202 |
m |
The lowest point of the catchment area |
|
5 |
I Ж |
1938,16 |
m/km |
Mean slope of the main gully |
|
6 |
I |
0.25 |
km |
Mean slope length of the catchment area |
Parameters derived from DEM
Results determined by the methods for intensification of rainfall limit and runoff parameter:
The results of flood analysis and other parameters were used to determine following calculation of flood runoff.
Estimation of the maximum discharge of flood with 1% rainfall feed when the amount of daily precipitation at maximum. In other words, it is an estimation of the maximum discharge in the incidence of once in 100 years.
In further, there is an increasing need for planning the civil engineering protective constructions that can drain the estimated discharge of Q1%=11.06 m3/s (Table 3).
Table 3
Result of flood runoff
|
№ |
Name |
Unit |
Amount of daily precipitation |
Interpretation |
||
|
й Е Е •я ^ {/> о CD -—< .я К X cd cd s |
й оо о II 2 |
'һ a "S S |
||||
|
1 |
V |
- |
0.69 |
0.69 |
0.69 |
Coefficient for runoff |
|
2 |
Фхб |
- |
18.74 |
18.74 |
18.74 |
Determination of slope morphology |
|
3 |
Фг |
- |
21.51 |
21.51 |
21.51 |
Determination of channel morphology |
|
4 |
w H1% |
- |
71.76 |
58.65 |
48.3 |
Amount of daily precipitation |
|
5 |
q 1% |
l/s km2 |
0.015 |
0.012 |
0.0103 |
The discharge with 1% rainfall feeding |
|
6 |
Q1 % |
m3/s |
11.06 |
7.23 |
5.11 |
The maximum discharge of rainfall |
Estimated the amount of daily precipitation at moderate and minimum state for the purpose of comparison. The amount of daily precipitation increased by 19 mm at similar hydrographic parameter meanwhile, the maximum discharge decreased to 7.23 m3/s (Table 3).
The amount of daily precipitation at minimum (H1%=70mm) while the maximum discharge was estimated as Q1%=5.11 m3/s which is 2 times less than the those (11.06 m3/s) at maximum amount of daily rainfall.
Flood runoff modelling
The aerial images were created by unmanned aerial vehicle for area of centre of Turgen soum, Uvs province. After that, high-resolution images were processed using AgiSoft software.
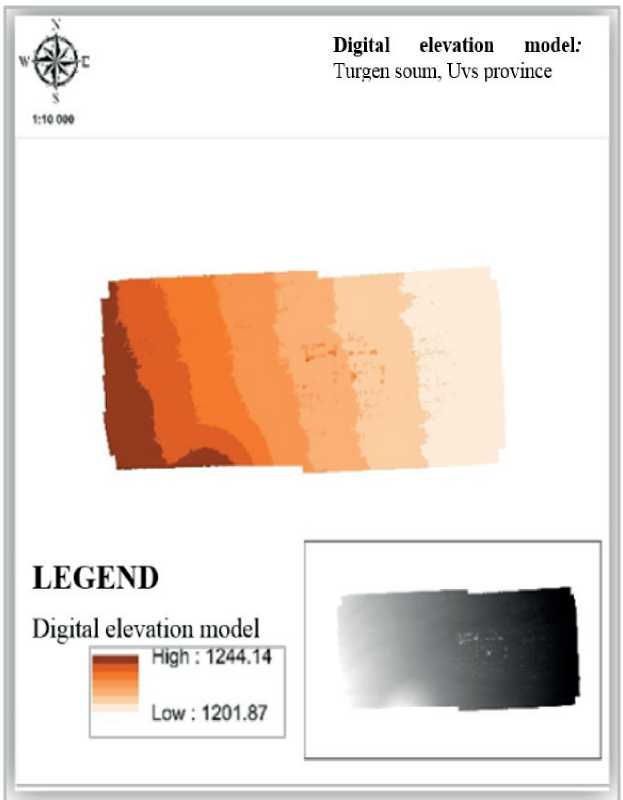
Fig. 4. Digital elevation model for Turgen soum centre
Results of flood runoff modelling using HEC-RAS software:
In the zone of 500 m along the dry riverbed, 6 cross-sections were produced to calculate the slope and elevation along with the engineering protective construction with dynamic modelling. Runoff modelling was used to define the dry riverbed channel, flood-prone the households, the starting and ending points, and bank elevation.
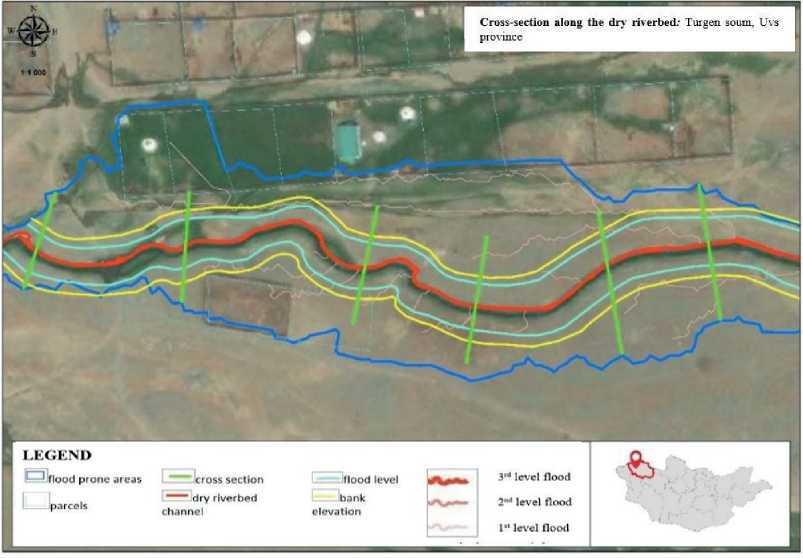
Fig. 5. Cross-section map
Hec-GeoRas tool was applied to import processed data into HEC-RAS software for dynamic flood modelling.
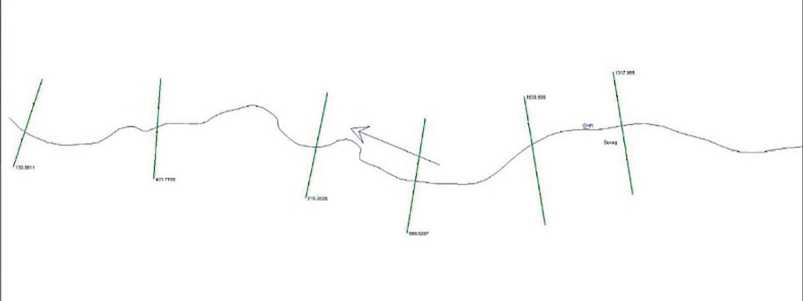
Fig. 6. Cross sections plan
The cross-section image was slightly changed due to the influence of other objects near the dry riverbed channel during the cross-section was created in a small area.
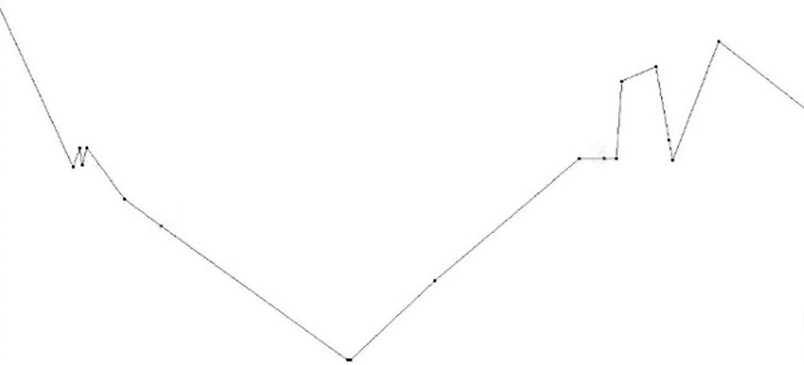
Fig. 7. Cross section-2
A cross-sectional image with alteration was compared to those on Google Earth Pro. After that, we selected the nearest similar values of the two software for the creation of a new cross-section image by AutoCAD software. In the zone of 500 m along the dry riverbed, dynamic flood modelling was accomplished by Sketchup 2018 software.
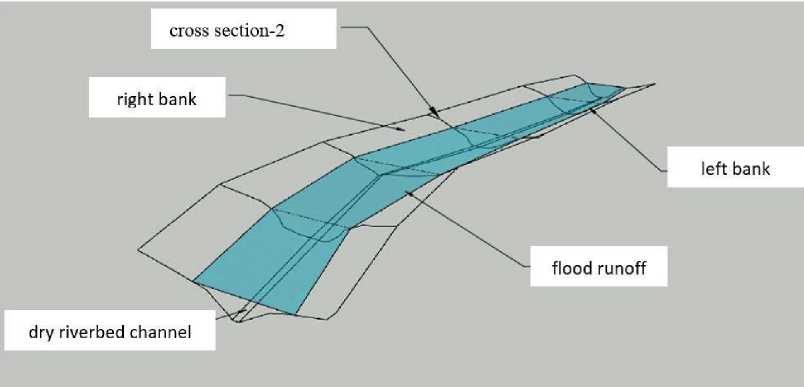
Fig. 8. Flood runoff modelling
Among the models, cross section-2 was selected to be applied for further estimation because it contains a mean value of 6 cross-sections. Therefore, it can represent other cross-sections too. The application of the model shows that the inundation width and channel bottom width of cross-section-2 are estimated to be 10.66 m and 2 m, respectively.
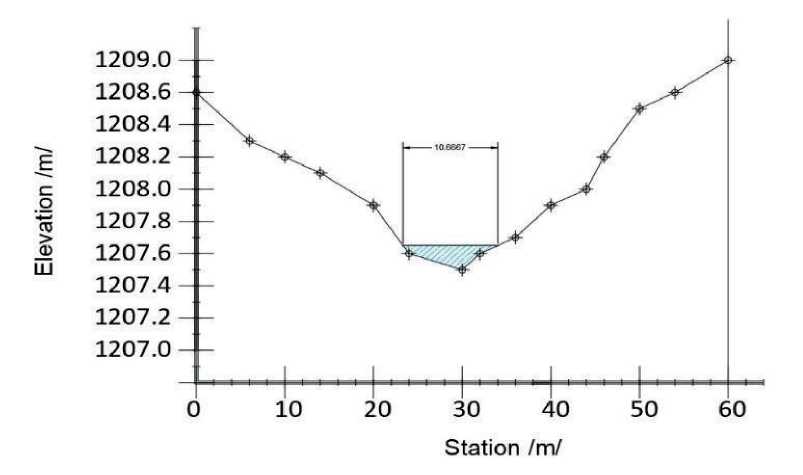
Fig. 9. Cross section-2
The cross-section demonstrates the critical depth of flood runoff and other data
(Table 4).
Table 4
The result of dynamic modelling
|
Parameters |
ХО-0 |
ХО-1 |
ХО-2 |
ХО-3 |
ХО-4 |
ХО-5 |
|
Critic depth |
0.63 |
0.7 |
1 |
1.1 |
0.9 |
1.2 |
|
Right bank elevation |
1210.52 |
1210.07 |
1208.57 |
1206.41 |
1205.37 |
1204.47 |
|
Left bank elevation |
1211.1 |
1210.92 |
1208.91 |
1206.83 |
1205.69 |
1204.81 |
|
Elevation of dry river bed channel |
1209.13 |
1208.65 |
1207.54 |
1205.03 |
1204.09 |
1203.12 |
|
Width, m |
2.1 |
2.2 |
2 |
1.8 |
1.9 |
2 |
In the area of 500 m along the dry riverbed, the channel bottom width and the difference between the highest point and the lowest point were 2 m and 6.01 m, respectively. And slope angle of the civil engineering protective construction is estimated to be 0.028.
Results for the determination of flood-prone parcels:
Orthophoto images were generated by an unmanned aerial vehicle for the centre of Turgen soum.
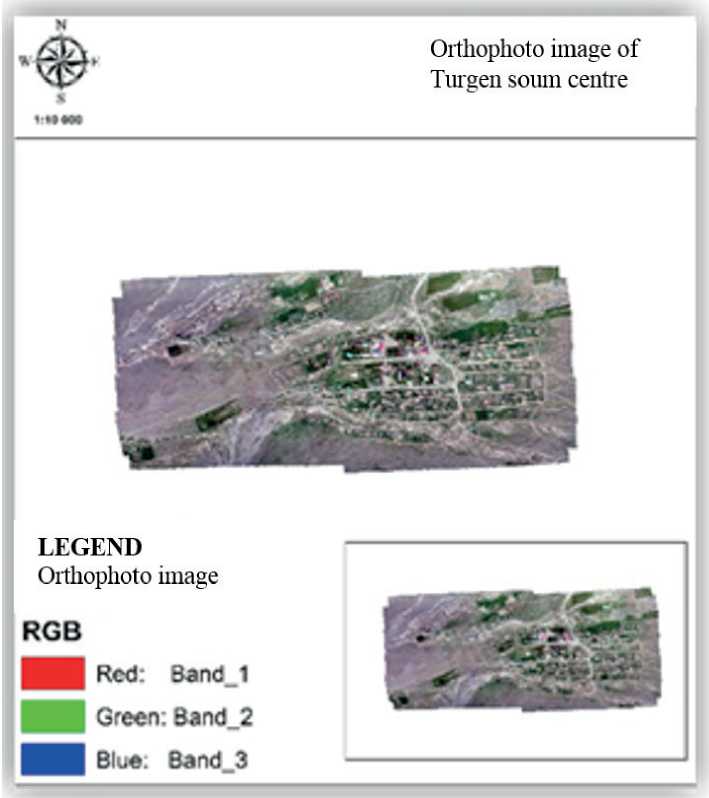
Fig. 10. Orthophoto image of Turgen soum centre
Flood risk scope and flood-prone parcels were identified using the results of flood analysis and runoff modelling. Then 3D flood risk map was created by ArcScene software. In the centre of soum, 4.8 he area would be affected by inundation.
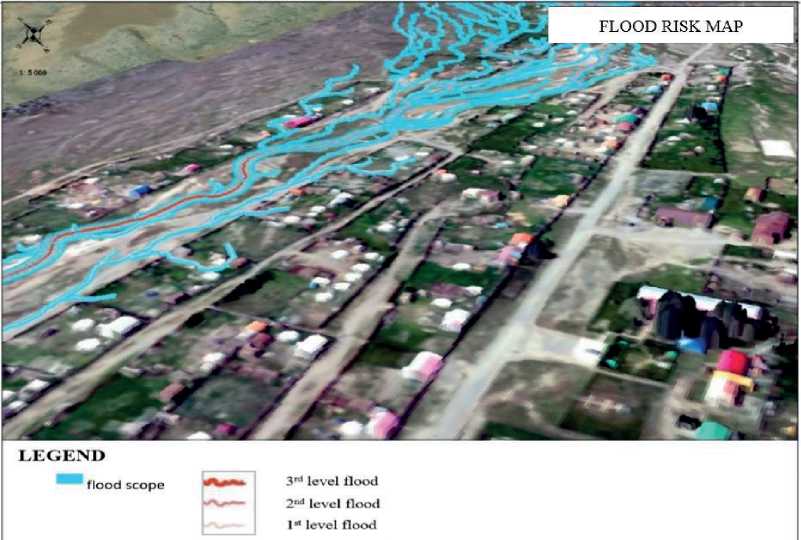
Fig. 11. Flood risk level map
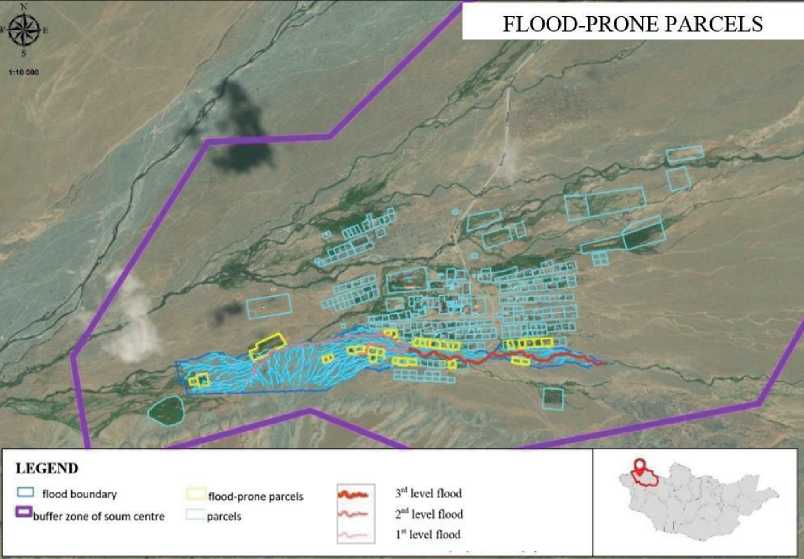
Fig. 12. Flood-prone parcels
The above map shows that most of the flood-prone parcels (24 of 32 parcels) are used for residence purposes. The map revealed that there are three families with houses and 24 families with residence lands. If we consider that on average each family has 4 members, in total 108 people have been living in flood-prone areas. In addition, pastureland, arable land, tree-planting fields and source of drinking water (well) are located in the flood-prone areas.
Estimation of parameters for the planning of engineering protection construction against flood:
Flood-prone parcels were identified regarding estimation of the maximum discharge. Therefore, there is specific demand to estimate the engineering constructions for protection of flood hazards. The hydraulic estimation for engineering protective constructions against flood hazard was carried out with Flow Pro software.The discharge was calculated using manning equation for assessing capacity of planned engineering protective construction based on the hydraulic estimation.
Results for the determination of hydraulic estimation using Flow Pro software:
Results of flood dynamic modelling by HEC-RAS, runoff index method,and intensification of rainfall limit method for estimating the maximum discharge were applied for the planning of civil engineering protective constructions with the help of Flow Pro.
Results for estimation of hydraulic parameters using Flow Pro software with input data of channel width and discharge at cross-section-2:
To calculate critical depth and slope (Open type of channel with square cross-sections, and drainage pipe) using water discharge, width, and roughness coefficient.
Q=11.06 m3/s, b=2 m
Table 5
Critical parameters
|
№ |
Type of channel for flood |
Critical depth, m |
Critical slope |
|
1 |
Open type of channel with square cross-sections |
1.461 |
0.00563 |
|
2 |
Drainage pipe |
1.000 |
0.24679 |
Estimating the depth using water discharge (h, m)
Water discharge, width, slope, and roughness coefficients are used to define depth, flow velocity, cross-sectional area, wet perimeter, and hydraulic radius. The slope angle of the drainage pipe is predicted to be 0.2580.
The hydraulic estimation results indicated 11.06 m3/s for discharge and 2 m for channel bottom width, while 0.8 m for water depth. Based on this estimation, the ferroconcrete channel against flood is planned to be the width of 2 m and height of 1 m. If estimations do not alter except for the channel elevation, other parameters such as filling depth, hydraulic radius, and flow velocity will not modify.
Estimating the depth by water discharge
Table 6
|
№ |
Type of channel for flood |
Water depth (h), m |
Flow velocity (v), m/s |
Area (s), m2 |
Wet perimeter (p), m |
Hydraulic radius |
|
1 |
Open type of channel with square cross-sections |
0.796 |
6.948 |
1.592 |
3.592 |
0.443 |
|
2 |
Drainage pipe |
0.8 |
16.414 |
0.674 |
2.215 |
0.304 |
Drainage pipe should be planned with a diameter of 1 m with ferroconcrete materials. During the period at maximum discharge (Q=11.06 m3/s) the filling depth is estimated to be 0.8 m.
Table 7
Results of hydraulic estimation
|
Hydraulic parameters |
5 S' ■5 һ О е е о .5 о '^ m |
5 5 О 45 bD Е |
О о О bD о p4 |
О о 8 m |
OJ о о OJ о OJ |
к cb OJ cb 15 % и |
У и |
§ OJ о Q |
о > о Е |
|
Open type of channel with square cross-sections |
2 |
0.8 |
0.01 |
0.02 |
0 |
1.6 |
0.44 |
11.06 |
6.9 |
|
Drainage pipe |
1 |
0.8 |
0.01 |
0.25 |
- |
0.7 |
0.30 |
11.06 |
16.41 |
Estimating the discharge capacity of civil engineering protective capacity based on manning equation (Pipe flow advisor software)
Based on the hydraulic parameters determined by the Flow pro software, the planning of the civil engineering protective constructions considers that dam height must be higher than the water depth. Therefore, the manning equation was employed to calculate the drainage capacity of the dam.
As estimated by Flow pro software:
Water depth (h) = 0.8 m
Assuming that the channel height (H) = 1 m and the pipe diameter (d) = 1 m while the discharge of the channel for flood is defined as follows.
Table 8
Channel discharge
|
№ |
Type of channel for flood |
Discharge (Q), м3/s |
Flow velocity (v), m/s |
|
1 |
Open type of channel with square cross-sections |
13.896 |
6.948 |
|
2 |
Drainage pipe |
12.884 |
16.414 |
The results indicate that the planned civil engineering protective construction has a drainage capacity of Q = 13.89 m3/s. Thus, the construction is supposed to sufficiently drain the water flowing through the soum centre with Q = 11.06 m3/s.
United estimation of civil engineering protective construction
Estimation of flood channel with open intersection:
The civil engineering protective construction was selected as an open type of flood channel with square cross-sections.
Parameters of channel-1
Parameters of flood channel
Table 9
|
№ |
Parameter |
Unit |
Number |
|
1 |
Channel depth (H) |
m |
1 |
|
2 |
Water depth (h) |
m |
0.8 |
|
3 |
Channel length (L) |
m |
1673 |
|
4 |
Channel bottom width (b) |
m |
2 |
|
5 |
Side slope (m) |
- |
- |
|
6 |
Discharge (Q) |
m3/s |
13.896 |
The civil engineering protective construction is planned to be 2 m for channel bottom width, 1 m for channel depth, and 0.8 m for water depth and it is also estimated to be 0.2 m from the surface water level to the edge of the channel. The total length and discharge of the channel must be 1673 m and 13.896 m3/s, respectively.
Conclusions
The main objective of the study was to plan civil engineering constructions based on the estimation of maximum runoff volume during the flood and determination of susceptible parcels for flood risk in the dry riverbed which directs to the centre of Turgen soum, Uvs province.
The channel width, flood level, bank height, the flood-prone households and parcelswere determinedby flood runoff modelling using HEC-RAS software. The hydraulic calculation of civil engineering protective construction to avoidpotential riskwas performed with Flow pro. The volume of water flowing through a channel was carried out by Pipe flow advisor software.
In the catchment area, there are 2 dry riverbeds with a total length of 1782.2 m that are highly likely to be flooded. And its tributaries consisted of 6 dry riverbeds with a total length of 5450.7 m and are moderately likely to be flooded. The remaining 23 dry riverbeds with a total length of 23387.9 m are less likely to be flooded (3rd level flood).
The catchment area, the total length of the gully, and the highest and lowest point in the catchment area are 18.83 km2, 10.28 km, 2055 m and 1202 m, respectively.
Based on an estimation of the maximum discharge of flood with 1% rainfall feeding when the amount of daily precipitation is at maximum, there is a need for planning the civil engineering protective constructions that can drain the estimated discharge of Q1%=11.06 m3/s.
The application of flood runoff modelling with the help of HEC-RAS software showed that the inundation width, channel bottom width, the difference between the highest point and the lowest point, and slope angle for the civil engineering protective construction were 10.66 m, 2 m, 6.01, and 0.0028, respectively.
The flood-prone areas in the soum centre were 32 parcels with an area of 4.8 hectares.
The analysis of hydraulic estimation showed 11.06 m3/s for discharge and 2 m for channel bottom width, while 0.8 m for water depth. Based on this estimation, the ferroconcrete channel for the flood will be planned to be a width of 2 m and a height of 1 m and it is also calculated to be 0.2 m from the surface water level to the edge of the channel. We suggested that the total length and discharge of the channel would be 1 673 m and 13.896 m3/s.
There is the possibility to protect a total of 108 people in 32 parcels in flood-prone zones with the advantage of civil engineering protective constructions in the soum centre.
Further, we are recommended that it is possible to apply flood runoff modelling for the planning of civil engineering facilities during the designation of the urban master plan and the partial master plan.
References Flood runoff modelling for the planning of civil engineering protective construction: the case of Turgen soum, Uvs aimag
- Bueno E. A quantitative flood risk analysis methodology for urban areas, 2011.
- Diaconu, D. C. An overview of flood risk analysis methods, 2021.
- Landuyt L. Application of a graph-based representation for flood dynamic modelling, 2013.
- Bumnyam B. Methodology for optimizing the location of surface drainage systems in Ulaanbaatar. Master thesis. Ulaanbaatar, 2014.
- Battogtokh G. Design of flood protective constructions in Erdenet city, Orkhon province. Ulaanbaatar, 2014.
- Sanjmyatav D. Monitor and improve protected areas of river sources and catchments, and the boundaries of forests, 2015.
- Melej I. Flood HYPERLINK "javascript:void(0)" precaution. Ulaanbaatar, 1978.
- Myagmar D. Flood. Ulaanbaatar, 2006.
- Nyamsuren N. Drainage pipe for surface water on asphalt road. Ulaanbaatar, 2019.
- Ulziikhutag D. Geographic regions of soil and vegetation. Ulaanbaatar, 1994.
- Tudev L. Mountain flood. Ulaanbaatar, 1971.
- Tsolmon B. Study on the possibility of application of dynamic river flow modelling in the planning of flood protective constructions in Tolgoit, 21st district. Master thesis. Ulaanbaatar, 2015.
