Forecast of trade and economic relations in the regions of Russia's northwestern federal district and the Republic of Belarus

Author: Uskova Tamara Vitalyevna, Selimenkov Roman Yuryevich
Journal: Economic and Social Changes: Facts, Trends, Forecast @volnc-esc-en
Section: Economic framework of Russia-Belarus integration cooperation
Article in issue: 3 (27) т.6, 2013.
Free access
The article is devoted to the topical issues of trade and economic integration of the Northwestern Federal District of the Russian Federation and the Republic of Belarus. It studies the trends in the development of trade and economic activity in their regions. The article describes the mathematical tool of gravity modelling of the trade and economic cooperation, approved by the materials of statistical reporting of NWFD regions and the Republic of Belarus. A forecast of development of trade and economic activity in these regions has been elaborated.
Trade and economic activities, integration, goods turnover, economic-mathematical modelling, forecasting
Short address: https://sciup.org/147223477
IDR: 147223477 | UDC: 339.32(470.2+47b)
Text of the scientific article Forecast of trade and economic relations in the regions of Russia's northwestern federal district and the Republic of Belarus
International integration processes, strengthening in the modern world and, one way or another, affecting all countries, had a direct impact on the post-Soviet space. The Creation of the Union State of Russia and Belarus on the basis of the formation of the Common Economic Space, ensuring the free movement of capital, labour, goods and services, made it possible to bring together the economies of the two countries and strengthen the processes of trade and economic integration.
It should be underlined that it would be impossible to achieve economic integration in the Union State without activating mutually beneficial cooperation at the regional level. Russian regions and Belarus have chosen the tactics of direct ties, having established business contacts and having signed cooperation programmes.
The results of the mutual trade of the Republic of Belarus with the federal districts of the Russian Federation in 2005–2011, are presented in table 1 .
Table 1. The results of the mutual trade of the Republic of Belarus with the federal districts of the Russian Federation
|
Federal District |
Export, million US dollars |
Import, million US dollars |
||||
|
2005 |
2011 |
Position |
2005 |
2011 |
Position |
|
|
Central FD |
3409.7 |
7638.7 |
1 |
2607.7 |
4610.6 |
3 |
|
Northwestern FD |
804.3 |
1644.2 |
2 |
766.7 |
2184.6 |
4 |
|
Southern FD |
227.6 |
510.4 |
5 |
178 |
263.8 |
6 |
|
North Caucasian FD |
115.2 |
208.8 |
7 |
25.7 |
86.3 |
7 |
|
Volga FD |
618.7 |
1522.3 |
3 |
1292.1 |
4872.1 |
2 |
|
Ural FD |
206.7 |
455.4 |
6 |
5091.7 |
12408 |
1 |
|
Siberian FD |
296.5 |
970.5 |
4 |
155.9 |
332.4 |
5 |
|
Far Eastern FD |
37.1 |
108.2 |
8 |
0.4 |
0.6 |
8 |
|
Russia in total |
5715.8 |
13058.5 |
10118.2 |
24758.4 |
||
Figure 1. Foreign trade relations of NWFD regions with the Republic of Belarus, million US dollars [11]
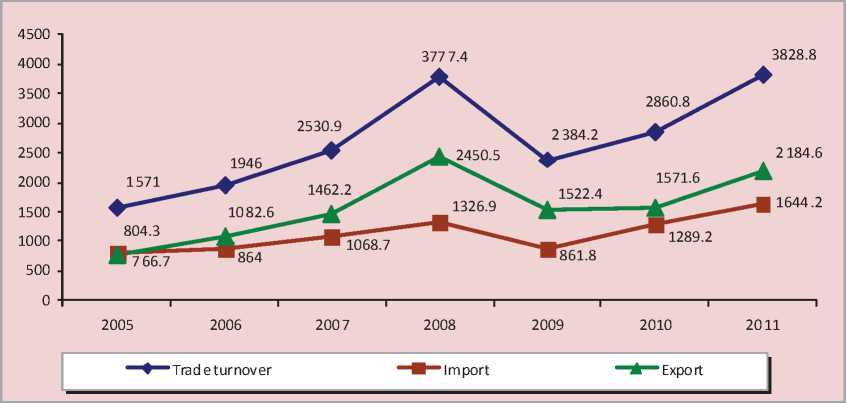
In Russia the leading position on turnover with Belarus is occupied by the Ural and Central federal districts (12 863.4 and 12 249.3 million US dollars in 2011, respectively). The northwestern regions are on the fourth place (3828.8 million US dollars).
Dynamic development of foreign economic activities of the regions of Russia’s North-West and the Republic of Belarus is noted in the period under review. However, the global financial crisis in 2008 had a significant impact on the processes of their trade and economic interaction. In this period the trade turnover between the regions of the Northwestern
Federal District and the Republic of Belarus fell by almost 40% in 2009 and amounted to 2.4 billion US dollars (fig. 1) . Moreover, the pre-crisis level of trade turnover was achieved only in 2011.
However, the level of trade and economic integration of NWFD regions and the Republic of Belarus in the post-crisis period (2008–2011) decreased. Foreign trade quota declined in five subjects of the Northwestern Federal District. Trade turnover growth with the partner country has been observed only in the Vologda, Novgorod and Arkhangelsk oblasts, and in the Komi Republic (tab. 2) .
Table 2. Regional foreign trade quota of NWFD regions and the Republic of Belarus, %
|
Region |
2005 |
2006 |
2007 |
2008 |
2009 |
2010 |
2011 |
2011 to 2008, p.p. |
|
Pskov Oblast |
4.49 |
6.04 |
6.78 |
8.91 |
4.15 |
4.30 |
8.53 |
-0.38 |
|
Vologda Oblast |
3.75 |
4.15 |
3.93 |
4.29 |
3.34 |
4.06 |
5.03 |
0.74 |
|
Novgorod Oblast |
3.93 |
3.29 |
2.95 |
2.54 |
2.41 |
2.42 |
2.78 |
0.24 |
|
Komj Republic |
0.88 |
0.53 |
1.01 |
1.05 |
3.78 |
2.18 |
2.37 |
1.32 |
|
Leningrad Oblast |
2.13 |
1.94 |
2.24 |
2.97 |
1.79 |
1.84 |
1.93 |
-1.04 |
|
Kaliningrad Oblast |
4.41 |
3.78 |
2.65 |
6.75 |
2.78 |
1.66 |
1.54 |
-5.21 |
|
Murmansk Oblast |
0.87 |
0.97 |
0.86 |
2.19 |
1.47 |
1.56 |
1.28 |
-0.91 |
|
Republic of Karelia |
1.01 |
1.49 |
1.08 |
1.13 |
0.74 |
0.77 |
0.73 |
-0.40 |
|
Arkhangelsk Oblast |
0.32 |
0.32 |
0.32 |
0.58 |
0.59 |
0.68 |
0.64 |
0.06 |
Table 3. The share of export to the Republic of Belarus in GRP of NWFD regions, %
|
Region |
2005 |
2006 |
2007 |
2008 |
2009 |
2010 |
2011 |
2011 to 2008, p.p. |
|
Pskov Oblast |
2.04 |
4.33 |
5.05 |
7.22 |
2.80 |
2.35 |
6.36 |
-0.86 |
|
Vologda Oblast |
2.69 |
3.19 |
3.04 |
3.50 |
2.84 |
3.46 |
4.13 |
0.63 |
|
Komi Republic |
0.69 |
0.37 |
0.90 |
0.94 |
3.70 |
2.09 |
2.27 |
1.33 |
|
Novgorod Oblast |
1.73 |
2.09 |
2.01 |
1.52 |
1.47 |
1.43 |
1.22 |
-0.30 |
|
Leningrad Oblast |
1.38 |
1.34 |
1.52 |
2.24 |
1.30 |
1.07 |
1.04 |
-1.20 |
|
Murmansk Oblast |
0.65 |
0.63 |
0.54 |
1.75 |
1.16 |
1.17 |
0.78 |
-0.97 |
|
Kaliningrad Oblast |
1.96 |
1.98 |
1.08 |
5.35 |
1.98 |
0.58 |
0.65 |
-4.70 |
|
Arkhangelsk Oblast |
0.11 |
0.09 |
0.10 |
0.23 |
0.40 |
0.49 |
0.26 |
0.03 |
|
Republic of Karelia |
0.40 |
0.92 |
0.52 |
0.58 |
0.39 |
0.31 |
0.18 |
-0.40 |
Table 4. Coefficient of regional export growth advancing GRP growth in NWFD regions
|
Region |
2006 |
2007 |
2008 |
2009 |
2010 |
2011 |
2011 to 2008, % |
|
Pskov Oblast |
2.12 |
1.17 |
1.43 |
0.39 |
0.91 |
2.70 |
188.9 |
|
Vologda Oblast |
1.18 |
0.95 |
1.15 |
0.81 |
1.32 |
1.20 |
104.0 |
|
Kaliningrad Oblast |
1.01 |
0.54 |
4.96 |
0.37 |
0.32 |
1.11 |
22.5 |
|
Komi Republic |
0.54 |
2.43 |
1.05 |
3.94 |
0.61 |
1.08 |
103.1 |
|
Leningrad Oblast |
0.97 |
1.13 |
1.48 |
0.58 |
0.90 |
0.97 |
65.4 |
|
Novgorod Oblast |
1.21 |
0.96 |
0.76 |
0.97 |
1.06 |
0.85 |
112.2 |
|
Murmansk Oblast |
0.97 |
0.86 |
3.22 |
0.66 |
1.09 |
0.67 |
20.7 |
|
Republic of Karelia |
2.3 |
0.56 |
1.13 |
0.67 |
0.87 |
0.57 |
50.3 |
|
Arkhangelsk Oblast |
0.81 |
1.07 |
2.43 |
1.71 |
1.33 |
0.53 |
21.6 |
At the same time the production in NWFD regions remains highly dependent on the sales of the regions’ products at the Belarusian markets (tab. 3) .
In 2011 the largest export potential with regard to the markets of the Republic of Belarus was observed in the Pskov (6.36%) and Vologda (4.13%) oblasts and the Komi Republic (2.27%).
Besides, the system of international division of labour in the post-crisis period involved fewer resources of regions, which is evidenced by a significant reduction of the coefficient of regional export growth advancing GRP growth in five NWFD regions (tab. 4).
Comparative analysis of NWFD regions by the coefficient of regional export growth advancing GRP growth shows that the resources of the Pskov, Vologda, Kaliningrad oblasts and the Komi Republic are used more actively in the system of international division of labour than in other regions.
Despite the slowdown in integration processes within the Union State, the development of mutually beneficial trade connections between NWFD regions of the Russian Federation and the Republic of Belarus is extremely significant for the national and regional economies. In this regard, the important methodological problem is the modelling and forecasting of trade and economic activities that can be done by using gravity models [1, 2, 6, 13, 14].
The gravity models developed by Jan Tinbergen and Hans Linnemann can be used to simulate the trade turnover between the subjects of NWFD of the Russian Federation and the Republic of Belarus [2, 13, 14].
Jan Tinbergen’s model appears as follows:
X y = a 0( Y .) a i( Y7 .) a 2 ( D y ) a + e , (1)
where Xij – the value of the trade flow from the country i to the country j ;
Yi , Yj – the indicators, characterizing nominal GDP of the corresponding countries;
Dij – distance between the economic centres of the countries i and j , km;
α 0 – absolute term of an equation;
ε – variable error.
H. Linnemann’s model is of more general form:
X y = a o ( Y ) a i ( Y y ) a 2 ( N ) a 3 ( Nj ) a 4 ( D y ) a 5 •
• ( A y Y4 P y ) a 7 + e , (2)
where Ni, and Nj – the population size in the given state;
Аij –any other favourable factor or constraint to the trade (for example, the presence of borders or anti-dumping regimes in one of the countries);
Pij – trade preferences among the states (in the absence of preferential agreements) Pij = 1; otherwise Pij = 2);
α1, α2, α3, α4, α5, α6, α7 – export elasticity coefficients according to GDP of the exporting country, GDP of the importing country, population size in the country i , population size in the country j , distance between the countries, any other factor, trade preferences;
α 0 – absolute term of an equation;
ε – variable error.
The initial data on the construction of a gravity model represents time series of member variables (tab. 5) .
Thus, in the result of calculations, the authors obtained the Jan Tinbergen’s version of the gravity model equation, describing the dynamics of eternal turnover between the regions of the Northwestern Federal District and the Republic of Belarus for 2005–2011:
Xy = 26.919 • (Y i ) - 0 ' 145 • (Yy )L096, (3) R 2 = 0.976
Note that the accuracy of the model is rather high, as the determination coefficient makes up 0.976. The economic interpretation of this model enables the authors to conclude
Table 5. Initial data on gravitation model parameters [11]
According to the authors, this dependence is caused by the peculiarity of the commodity structure of exports and imports of NWFD regions of the Russian Federation and the Republic of Belarus. Raw materials (ferrous metals, mineral products and chemicals) occupy significant part in the export structure of NWFD regions. Therefore, the increase in GRP of the regions depends directly on export deliveries to the world market.
Food products, vehicles, agricultural machines and units, refrigerators and freezers, chemical and mineral fertilizers, timber and building materials, petrochemical products, synthetic fibers are imported to NWFD regions from Belarus. In other words, in the conditions of the limited capacity of the market of the given products it is possible to increase GDP of the Republic of Belarus by expanding sales geography, thus resulting in the reduction in the trade turnover between NWFD regions and the Republic.
Somewhat different result is obtained when using Hans Linnemann’s gravity model:
Xij = 1.069E - 20 ⋅ (Yi)0.167 ⋅ (Y j)1.388 ⋅ ij i j (4)
⋅ ( N i ) 22.151 ⋅ ( N j ) - 1.262 , R 2 = 0.989
The determination coefficient is higher than 0.99, as the given model considers a number of factors, affecting the turnover. However, the following conclusions can be made on the basis of the obtained equation: with the 1% increase in GDP of the Republic of Belarus, the trade turnover between the Republic and NWFD regions will rise by 0.17%; due to 1% increase in GRP of NWFD regions, the turnover will grow by 1.39%. In case the population of Belarus will increase by 1%, the trade turnover will rise by 22.2%, an increase of 1% of the population of NWFD regions will lead decline in trade turnover by 1.3%.
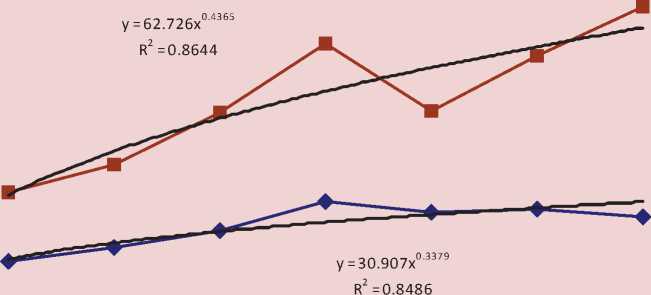
It is possible to forecast foreign trade turnover between NWFD regions and the Republic of Belarus based on gravity models, when constructing trends, describing the dynamics of member variables. The studied time series of the gross product and the population size of NWFD regions and Belarus are described rather accurately by power polynomial trends, as the coefficient of determination falls within 0.8–0.9 range (fig. 2, 3) .
The forecast values of variables, obtained on the basis of extrapolation of the trends, are likely to increase, except for the population of the Republic of Belarus (tab. 6) .
Thus, the forecast values of foreign trade turnover, obtained on the basis of gravity model equation of Jan Tinbergen and that of Hans Linnemann, shows strengthening of trade and economic integration of NWFD regions of the Russian Federation and the Republic of Belarus in the long view (fig. 4) .
A different number of factors, considered in the model, affects the indicators of foreign trade turnover, which explains the difference in the forecast values of the gravity models. In compliance with the theory of gravity models construction and their description, the gross product of the exporting country reflects production capabilities, while the gross product of the importing state determines its market capacity. In general, these two variables are directly proportional to the trade volume.
However, according to the authors, further development of trade and economic integration of NWFD regions and the Republic of Belarus both in the medium and long term can be polyvariant. Analyzing possible variants, it is possible to distinguish three possible scenarios of further development of the process at the current moment:
– ‘no change’ scenario, stipulating the continuation of trends and trade turnover
Figure 2. Dynamics of GDP of the Republic of Belarus and GRP of NWFD regions of th Russian Federation, billion US dollars
2005 2006 2007 2008 2009 2010 2011
ф GDP ofthe Republic ofBelarus, billion US dollars
-
■ GRP of NWFD regions, billion US dollars
^^^^^^^* Polynomial (GRP of NWFD regions, billion US dollars)
^^^^^^^^™ Polynomial (GDP of the Republic of Belarus, billion US dollars)
Figure 3. Dynamics of population of the Republic of Belarus and NWFD regions, million people
y = 0.0087x2 - 0.079x + 13.788 R2 = 0.9957
„ -0.0118
y = 9.7022x . 11
R2 = 0.9967
2005 2006 2007 2008 2009 2010 2011
Population size of the Republic of Belarus, million people
-
— ■ — Population size of NWFD regions, million people
^^^^^^™ Polynomial (Population size of the Republic of Belarus, million people)
^^^^^^™ Multinomial (Population size of NWFD regions, million people)
Table 6. Forecast of GDP and population growth of NWFD regions of the Russian Federation
|
Indicator |
Forecast |
Average annual growth rate, % |
|||
|
2012 |
2013 |
2014 |
2015 |
||
|
GDP of the Republic of Belarus, billion US dollars (Yi) |
62.404 |
64.937 |
67.291 |
69.493 |
107.3 |
|
GRP of NWFD regions of the Russian Federation, billion US dollars (Yj) |
155.470 |
163.672 |
171.375 |
178.655 |
103.3 |
|
Population size of the Republic of Belarus, million people (Ni) |
9.467 |
9.454 |
9.442 |
9.432 |
99.9 |
|
Population size in NWFD regions, million people (Nj) |
13.713 |
13.782 |
13.868 |
13.972 |
100.6 |
Figure 4. Forecast of the trade turnover between the Russian Federation and the Republic of Belarus, million US dollars
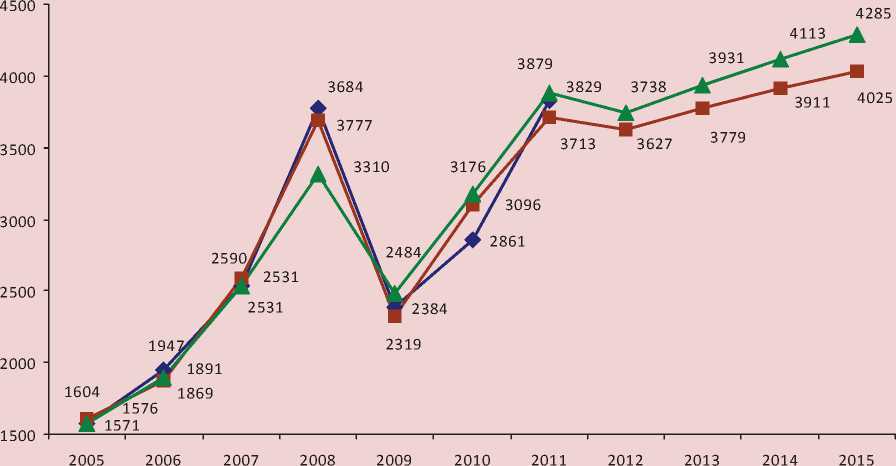
Trade turnover between NWFD regions and the Republic of Belarus, million US dollars
Forecast trade turnover between NWFD regions and the Republic of Belarus, million US dollars (Hans Linnemann gravity model)
Forecast trade turnover between NWFD regions and the Republic of Belarus, million US dollars (Jan Tinbergen gravity model)
structure, existing in foreign trade relations between NWFD regions and the Republic of Belarus;
– scenario of trade and economic relations reorientation, the basic condition for implementation of which is the change of the sales markets for both NWFD regions and the Republic of Belarus;
– scenario of the further deepening of the economic integration of NWFD regions and
the Republic of Belarus, stipulating the turnover increase due to the modernization of export-oriented industries and increase in volumes of competitive products with high added value.
However, at present, trade and economic integration of NWFD regions and the Republic of Belarus is aimed primarily at the efficient use of production potentials available in the regions, the development of specialization
and cooperation of enterprises, improvement of the previously existing economic ties.
Thus, in order to boost trade and economic integration in the system “country – regions of the other country”, it is necessary to consider economic, political, and administrative-legal features of each party, factors affecting their development. It is possible to solve the given
problem by using adequate methodological and, first of all, mathematical tools, which allow assessing the effectiveness of trade and economic relations on many factors. This will permit making timely changes to foreign trade policy and will contribute to the sustainable development of mutually beneficial cooperation.
References Forecast of trade and economic relations in the regions of Russia's northwestern federal district and the Republic of Belarus
- Anderson J.E. Gravity with gravitas: a solution to the border puzzle. American economic review. 2003. Vol. 93. No. 1. Р. 170-192.
- Tamirisa N. Exchange and capital controls as barriers to trade. IMF staff papers. 1999. Vol. 46. No. 1. Р. 57-68.
- Ricci L.A. Exchange rate regimes and location. Konstanz University mimeo, 1996.
- Asanovich V.Ya. Economic and mathematical methods and models in international economic relations. Minsk: BSEU, 2003.
- Balatsky Ye.V. Modelling of the policy enhancing the efficiency of foreign trade operations. Mirovaya ekonomika i mezhdunarodnye otnosheniya (World Economy and International Relations). 2002. No. 2.
- Belenky V.Z., Arushanyan I.I. Capabilities assessment of active export-import policy based on open stationary model of Russia’s economy. Economics and mathematical methods. 1995. Issue 1. P. 83-97.
- Uskova T.V., Asanovich V.Ya., Dedkov S.M., Selimenkov R.Yu. Foreign economic activity of the NWFD regions and the Republic of Belarus: condition and methodological aspects of modelling. Economic and social changes: facts, changes, forecast. 2010. No. 4. P. 118.
- Uskova T.V., Dedkov S.M., Smirnova T.G., Selimenkov R.Yu., Asanovich V.Ya. Interregional cooperation as the factor of integration processes of Russia and Belarus. Vologda: ISEDT RAS, 2011.
- Interregional interindustry model of the world economy. Ed. by A.G. Grunberg, S.M. Menshikov. Novosibirsk: Nauka, 1983.
- Modelling of global economic processes. Textbook. Ed. by V.S. Dadayan. Мoscow: Ekonomika, 1984.
- Smirnova T.G., Selimenkov R.Yu. Assessment of trade and economic integration of the North-Western Federal District regions with the Republic of Belarus. Problems of development of territories. 2010. No. 5. P. 20-30.
- Statistical data. Available at: http://www.belstat.gov.by; http://www.president.gov.by; http://www.nbrb.by; http://www.gks.ru; http://www.cbrf.ru
- Uskova T.V., Selimenkov R.Yu., Asanovich V.Ya. Methodological aspects of foreign economic activity in the regions of the North-West Federal District and the Repunlic of Belarus. Economic and social changes: facts, changes, forecast. 2012. No.2. P. 60.
- Shaytanova N.A., Asanovich V.Ya. Gravity models and the possibility of its use when forecasting the foreign trade of the Russian Federation and the Republic of Belarus. IT management in Economics -2006: Republican research-to-practice conference proceedings (Brest, April 25-26, 2006. Brest State University named after A.S. Pushkin). Ed. by S.A. Tuzik. Brest: BrSTU, 2006.
