Forecasting the Economic Growth Limitations in the Northern Regions Based on the “Sustainability Windows” Assessment

Author: Druzhinin P.V., Shkiperova G.T.
Journal: Arctic and North @arctic-and-north
Section: Social and economic development
Article in issue: 44, 2021.
Free access
In modern conditions, the issues of assessing the sustainability of regional development are of particular relevance. The complex problems of interrelation of economic growth, environmental pollution and population well-being require the development and use of new, simpler and more understandable approaches for decision makers to assess, analyze, and predict sustainability at the regional level. The purpose of the article is to investigate the opportunities for sustainable development of the regions of the European North included in the Arctic zone, and to develop methods for forecasting their socio-environmental and economic development based on sustainability window assessment. The dynamics of changes in the relationship between environmental, social and economic indicators with the use of pollution functions is analyzed. The main factors contributing to the reduction of environmental pollution and increase of the population's well-being are identified. It is shown that structural changes in the regional economy and environmental investments have the greatest effect. A methodology for calculating sustainability windows for the regional economy is presented. The possibility of using the method has been demonstrated using data from the Republic of Karelia. A scenario of sustainable development based on the restriction of economic growth for some regions and the requirements for the structure of the economy has been developed. The results obtained can be used as an informational and methodological basis for assessing and elaborating sustainable development policies in the Arctic regions.
Sustainable development, region, European part of the Arctic zone of the Russian Federation, environmental restriction, economic growth, sustainability window
Short address: https://sciup.org/148322043
IDR: 148322043 | UDC: 332.1(470.1/.2)(045) | DOI: 10.37482/issn2221-2698.2021.44.45
Text of the scientific article Forecasting the Economic Growth Limitations in the Northern Regions Based on the “Sustainability Windows” Assessment
The most important requirement when working out the development strategies of countries and regions is sustainable development; besides, it is necessary to take into account the economic, environmental and social aspects [1, Karginova V.V., Tolstoguzov O.V., p. 77; 2, Heininen L., p. 197]. In order to assess the possibility of sustainable development of the northern regions, it is necessary to analyze the change in environmental and social indicators during the reforms.
The northern and arctic regions are characterized primarily by the vulnerability of the natural environment, and active resources development can cause serious ecological consequences [3, Stepanko N.G., Stepanko A.A., Tkachenko G.G.]. Harsh climate and unfavorable living conditions lead to significant additional costs for production activities, which creates the danger of neglecting environmental problems. Therefore, it is necessary to take into account the relationship between economic and environmental indicators in forecasting [4, Shelomentsev A.G., Belyaev V.N., Ilinbaeva E.A., p. 161]. Changes in the economy’s structure and accelerated auto-mobilization of
the population have resulted in the fact that the impact of automobile transport on the pollution level is not much less than industrial one [5, Pyzheva Yu.I., Pyzhev A.I., Zander E.V., p. 510]. An increase in environmental expenditures can significantly reduce the level of pollution [6, Zabelina I.A., Klevakina E.A., p. 79].
The northern and arctic regions of Russia are developing slowly after long decline in the 1990s, and population level is decreasing, in contrast to the Arctic regions of other countries [7, Fauser V.V., Smirnov A.V., p. 15; 8, Zharov V.S., Ivanova M.V.]. The growth of migration is associated with changes in the income level, decrease in the quality of life in the north, low availability of quality services [9, Ivanova M.V., Kasparyan Zh.E., p. 101]. At the same time, the trend in real incomes did not change in some northern regions, which made it possible to use time series for forecasting without taking into account other factors [10, Krivoshapkina K.V., Matveeva N.N., p. 12]. The dynamics of social indicators are closely related to the production development, and different equations that include the level of regional economy development are proposed to assess the standard of living [11, Ignasheva T.A., p. 362]. A number of works have shown that a slowdown in the population outflow from the Arctic zone requires acceleration in the growth of monetary incomes [9, Ivanova M.V., Kasparyan Zh.E.; 10, Krivoshapkina K.V., Matveeva N.N.; 12, Toropushi-na E.E.].
The development of the Arctic zone requires solving many problems that are associated with international conflicts and climate change [13, Labetskaya E.O., p. 83]. At the same time, the analysis of the implementation of the Development Strategy of the Arctic Zone of the Russian Federation 1 shows a slow solution of the accumulated problems, primarily social and environmental ones [14, Krutikov A.V., Smirnova O.O., Bocharova L.K., p. 258]. Slipenchuk M.V. [15, Slipenchuk M.V., p. 36] notes that it is necessary to take into account environmental constraints more strictly and to pay more attention to legal regulation. When constructing scenario conditions for the Arctic zone development, it is necessary to consider many factors affecting the sustainability of development [16, Zaikov K.S. et al, p. 10].
Since the 1990s, there are many significant and often promising efforts to assess sustainability and its indicators. Previously, the index of sustainable economic well-being was proposed, which estimates several aspects: gross domestic product (GDP) adjusted for the amount of damage caused to the environment, index of true savings, index of social sustainability developed by the Foundation for Sustainable Society, ecological footprint, index of inclusive development introduced by the World Economic Forum and others 2 [17, Kaivo-oja J., Panula-Ontto J., Vehmas J.,
Luukkanen J., p. 41; 18, Syrovatka M.; 19, Lyaskovskaya E.A., Grigoryeva K.A., p. 47]. Such indices make it possible to reduce complex and ambiguous information to a small number of understandable indicators.
A fairly simple new approach on the basis of sustainability windows was proposed, which makes it possible to analyze strategic decisions and forecasts [20, Luukkanen J., Kaivo-oja J., Vehmas J., Panula-Ontto J., Hayha L.; 21, Luukkanen J. et al, p. 820]. The construction and analysis of sustainability windows examine all three components of sustainable development and determine the extent to which the changes occurring or planned lead to greater sustainability.
The purpose of this article is to study the possibilities of sustainable development of the regions of the European North and to develop methods for predicting their socio-ecological and economic development based on the assessment of the sustainability window. To achieve this goal, data were collected and analysed for four regions of the European North, equations for the analysis of the retrospective period were proposed, and a method for constructing stability windows for the forecast period was developed.
Research methods
The research was conducted in four regions of the European North, fully or partially included in the Arctic zone of Russia — the republics of Karelia and Komi, Murmansk and Arkhangelsk oblasts (including the Nenets Autonomous Okrug). The retrospective period was analyzed and possible prospects for development of the European part of the Arctic zone of Russia were studied.
The following indicators were used for the calculations: gross regional product (GRP) Y(t) , GRP per capita X(t) , cumulative investment in the economy K(t) , population size, number of employed L(t) , level of employment Z(t) , share of pensioners in population P(t) , level of unemployment U(t) , real money income R(t) and air pollutant emissions E(t) . All the indicators were considered in dynamics for the period 1990–2019. Calculations were made with other indicators (indices of industrial and agricultural production, number of pensioners, fresh water intake and wastewater discharge). Labor productivity was defined as the ratio of GRP to the number of employees. Standard statistical packages were used in the calculations and the indicators were adjusted to a comparable level.
In the course of analyzing the dynamics of the main indicators of the regions, graphs of the basic and derived economic indicators and their interrelations were built. On the basis of this analysis, the type of equations, the dynamics of main parameters reflecting the peculiarities of so-cio-ecological-economic processes in the regions were determined, and periods, when parameters differed, were distinguished. It was clarified what factors resulted in changes of trends, and peculiarities of each period were identified. The development of the economy was assessed by the function:
Y (t) = B x Ka (t) x Le (t) x exp(/x t) (1)
where: t — year; B, a , в, у — constants.
To assess the impact of economic processes on the environment, pollution functions were created [22, Druzhinin P.V., Shkiperova G.T., Potasheva O.V., p. 147]. For the calculations, the multiplicative pollution function was used:
E (t) = A(t) x Y" (t) x I -n (t)
where: A(t) — factor reflecting the impact of structural changes; д n — constants.
The dynamics of real money incomes of the population in the retrospective period was determined depending on the dynamics of GRP per capita, the level of employment, the share of pensioners in the population and the level of unemployment:
R (t) = C + D x Z (t) + M x X (t) + N x P (t) + O x U (t) (3)
where: C, D, M, N, O — constants.
The main problem is to identify the periods correctly, since the parameters of equations (1) — (3) may differ significantly at different periods due to changes in economic policy or economic crises. It is therefore necessary to use a scenario approach in forecasting, where the parameters of the equations are linked to future policy options. When using data for several periods for retrospective calculations, the use of spline functions is desirable. For forecast calculations, it will be necessary to specify the employment dynamics and the share of pensioners, which will be determined through the forecast of the population size. The employment rate will be calculated through the ratio of the number of employed and the total population.
Three indicators — environmental, social and economic — have been selected to assess the windows of sustainability. Finnish researchers have used the indicators from the SSI (Society Sustainability Index) database and the World Bank database, which describe changes at the national level [17, Kaivo-oja J., Panula-Ontto J., Vehmas J., Luukkanen J., p. 41; 20, Luukkanen J., Kai-vo-oja J., Vehmas J., Panula-Ontto J., Hayha L.; 21, Luukkanen J. et al., P. 820]. However, not all of these indicators are available at the regional level, in particular, GDP and greenhouse gas emissions.
When choosing indicators, the author relied on the previously proposed various sets of regional indicators that allow assessing sustainable development [23, Bobylev S.N., p. 17, 33, 35; 24, Uskova T.V., p. 98; 25, Gutman S.S., Basova A.A., p. 40; 26, Fauzer V.V., Smirnov A.V., Lytkina T.S., Fauzer G.N., p. 127; 27, Leksin V.N., Porfiryev B.N., p. 988]. As a result, the following indicators were selected: GRP in comparable prices, the volume of emissions of pollutants into the atmosphere from stationary and mobile sources, real money incomes of the population in comparable prices. Composite indicators can also be constructed to assess environmental and social development.
The boundaries of economic growth are set for the future. The maximum is determined in relation to the ecological indicator, GRP growth should not lead to growth of emissions into the atmosphere, and the minimum — in relation to the social indicator, GRP growth should not lead to decrease of incomes. It means that the maximum GRP growth will be at zero growth in emissions, and the minimum — at zero income growth, and the difference between them sets the width of the stability window. When economic growth is within the sustainability window, the environmental indicator goes down and the social indicator goes up. The sustainability window disappears if the social indicator grows slower than the ecological one or falls faster than it. Accordingly, the boundaries of the stability window were determined based on the equations [20, Luukkanen J., Kaivo-oja J., Vehmas J., Panula-Ontto J., Hayha L., p. 14494]:
G . = — min e
^ R
G
max
S Y ^ E
where: G min — the lower boundary of the stability window; G max — the upper border of the stability window; S Y — the GRP growth rate for the period under study (ratio of GRP of the last year to GRP of the base year); SE — the growth rate of emissions for the period under study; S R — the growth rate of income for the period under study.
It should be noted that the methodology allows using any values as a target benchmark of environmental and social indicators. In this study, the choice of a target for the upper boundary of sustainability is explained primarily by the tasks set in the Development Strategy of the Arctic Zone of the Russian Federation and Ensuring National Security for the Period up to 2035 3: 12 a) “the introduction of a special economic regime in the Arctic zone, contributing to the transition to a closed-cycle economy ... “, as well as 15 e) “minimization of atmospheric emissions, discharges of pollutants into water bodies during economic and other activities in the Arctic zone, as well as the establishment of state support measures aimed at introducing the best available technologies in the implementation of economic and other activities in the Arctic zone”. Unfortunately, the numerical values of the target environmental and social indicators are absent in the strategic documents for the development of the Arctic zone of the Russian Federation.
For the retrospective period, the dynamics of regional development was checked and periods of sustainable development were identified [28, Shkiperova G.T., Druzhinin P.V., Kurilo A.E., p. 650, 651]. Since the real economic growth of almost all the regions under study in the retrospective period is significantly lower than the ecological limit of sustainability, then the use of zero growth in atmospheric emissions as a target provides an opportunity for a gradual transition to a circular economy. Equations (2) and (3) were transformed with respect to environmental and social indicators for the forecast period.
If the ecological indicator is stable, we obtain the ratio of GRP to investments in air protection from equation (2). Having estimated reasonable upper bounds for the dynamics of environmental investments, we obtain an upper bound for GRP growth. Population dynamics and, consequently, employment may not change very much, while the scope for changing the dynamics and structure of investments is quite large. As a result, equation (1) gives the maximum investment dynamics in the economy with different changes in the number of employed people. The same is true for equation (3). If the social indicator is stable, we obtain relationship between GRP per capita and unemployment rate with two slightly changing indicators (employment rate and share of pensioners). In this case, a lower bound on GRP growth and a lower bound on investment dynamics through equation (1).
As a result, the forecast sustainability window for GRP is calculated basing on the forecast of the region's population and related rather slowly changing indicators — the number of employed, the employment rate, the unemployment rate and the share of pensioners, as well as environmental investments. Equation (1) also allows us to calculate the sustainability window for investment in the economy.
Data and analysis
The data for the research were obtained from the Federal Service for State Statistics (FSSS) website and the websites of regional offices 4, as well as from statistical reference books 5.
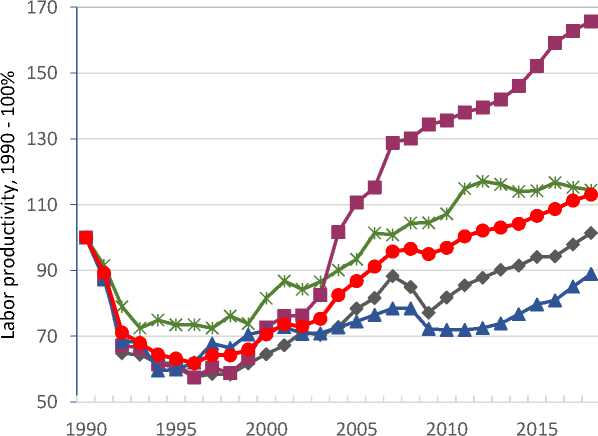
The development of the Arctic regions, like the Russian Federation as a whole, is characterized by three significantly different periods — up to 1998, 1999–2008 and since 2009. In order to construct the functions, the data of the second and third periods were used (Fig. 1).
Karelia
Komi
- ■ -Arkhangelsk
Murmansk
-•- European North
Fig. 1. Dynamics of labor productivity in the regions of the European part of the Arctic zone (1990 — 100%).
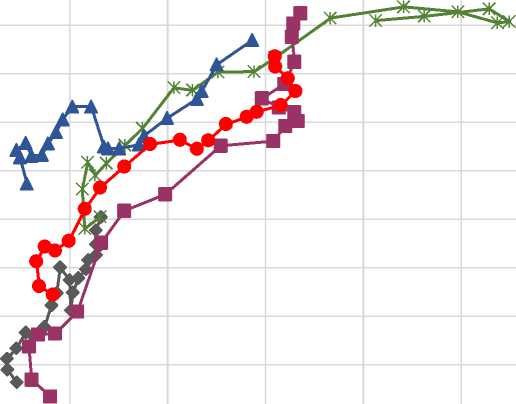
It is worth noting that labor productivity grew in all regions in the second period, and after 2009 its growth stopped in the Komi Republic. Labour productivity was also growing in all regions in the second period, but after the crisis of 2008–2009 labour productivity increased only in Murmansk Oblast. The dependence of labor productivity on the capital-to-labor ratio is similar in all regions under consideration, and it can be expected that the parameters of their functions (1) will not differ significantly (Fig. 2).
о го 1000
_§ 900
го
5 800
о.
га О
100 200 300 400 500
Labor productivity
Karelia
Komi
- ■ -Arkhangelsk
Murmansk
European North
Fig. 2. Dependence of labor productivity on capital-labour ratio (thousand rubles) in the regions of the European part of the Arctic zone since 1998 (prices of 2015).
The growth of labor productivity in industry has slowed down. In the European part of the
Arctic zone, it grew by an average of about 3.7% per year from 1996 to 2008, and in 2009–2019 — by about 2.3% per year. Elasticity of funds, which reflects efficiency of investment policy, was low throughout the macro-region as a whole and in the majority of regions in the 2000s, but started to grow after the 2008–2009 crisis. Only in the Komi Republic elasticity was stable and approximately equal to the macro-region average in the 2000s, but decreased to zero in the 2010s.
Since there was little change in economic efficiency in the 2000s and a growth after the 2008–2009 crisis, the spline-function was used and technical progress in the third period was introduced into the Cobb-Douglas function.
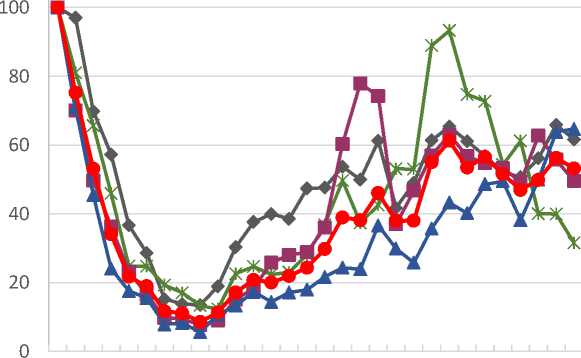
The economic development of the regions in the European part of the Arctic zone was slower than in the whole of the Russian Federation, the volume of investments ranged from 50% to 60% against the level of 1990, which is noticeably lower than in the Russian Federation (Fig. 3).
Karelia
Komi
- ■ -Arkhangelsk
Murmansk
-•- European North
1990 1995 2000 2005 2010 2015
Fig. 3. Investment dynamics by regions of the European part of the Arctic zone (% to 1990) 6.
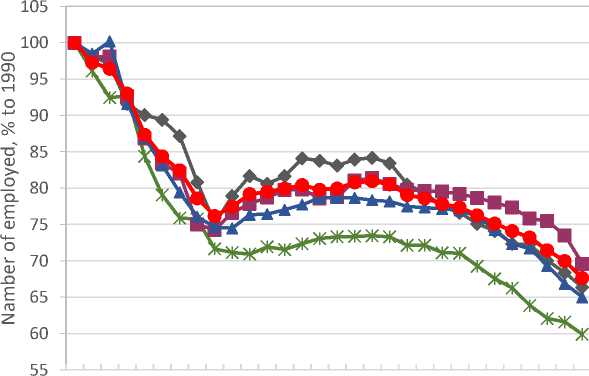
The dynamics of employment also differ radically in the three identified periods (Fig. 4). In the third period, employment started to decline rapidly, as the population continued to decline, largely due to the migration of young people to more southern regions [29, Galimullin E.Z., p. 99]. The population of the Murmansk Oblast and the Komi Republic has decreased by more than a third over 30 years, the population of the Arkhangelsk Oblast and the Republic of Karelia — by about a quarter. Additional comprehensive state support is required to reduce the migration outflow [30, Emelyanova E.E., p. 90].
-
6 Calculated by: Regiony Rossii. Sotsial'no-ekonomicheskie pokazateli 2019 [Regions of Russia. Socio-economic indicators 2019]. Federal State Statistics Service. URL: https://gks.ru/bgd/regl/b19_14p/Main.htm (accessed 11 January 2021).
Karelia
Komi
- ■ -Arkhangelsk
—*— Murmansk
—•- European North
1990 1995 2000 2005 2010 2015
Fig. 4. Number of employed dynamics by regions of the European part of the Arctic zone (% to 1990) 7.
Decline in industrial production in the 1990s led to an improvement of the ecological situation. Economic growth in the second period led to a deterioration of the environmental situation in some regions, and in the third period, pollutant emissions into the atmosphere increased only in Karelia, accompanied by a sharp decline in environmental investment. The improvement in the environmental situation in the growing regions was largely due to structural changes in the economy, as well as economic modernization and environmental investments (Fig. 5).
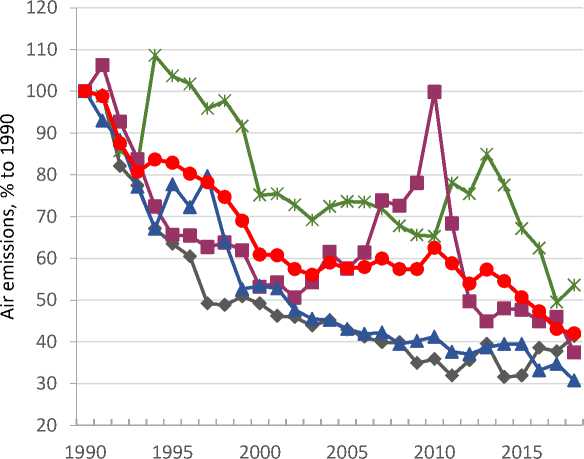
Karelia
Komi
- ■ -Arkhangelsk
Murmansk
—•- European North
Fig. 5. Dynamics of emissions from stationary sources by regions of the European part of the Arctic zone (% to 1990) 8.
-
7 Calculated by: Regiony Rossii. Sotsial'no-ekonomicheskie pokazateli 2019 [Regions of Russia. Socio-economic indicators 2019]. Federal State Statistics Service. URL: https://gks.ru/bgd/regl/b19_14p/Main.htm (accessed 11 January 2021).
-
8 Calculated by: Okhrana okruzhayushchey sredy Rossii [Environmental protection of Russia]. URL: https://rosstat.gov.ru/folder/210/document/13209 (accessed 16 December 2020).
The dynamics of real incomes in the four regions are approximately the same. Relatively fast growth until 2008, decline during the crisis, then a short growth and then decline again to the level of about 2007–2008. (Fig. 6).
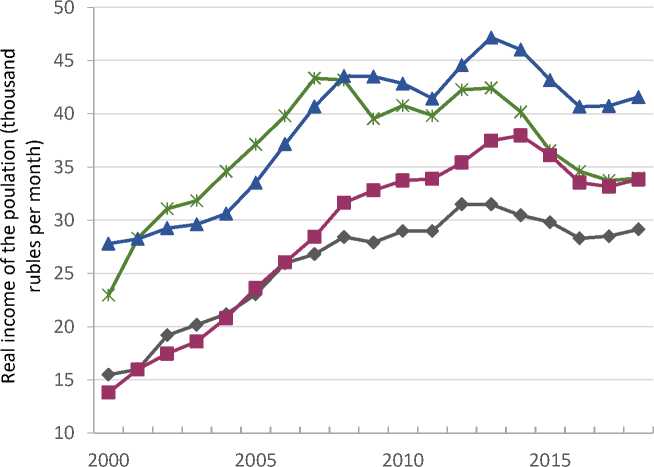
Karelia
Komi
- ■ -Arkhangelsk
Murmansk
Fig. 6. Dynamics of real income of the population by regions of the European part of the Arctic zone (thousand rubles per month) 9.
The analysis of the development of the regions in the European part of the Arctic zone showed the existence of available sustainability windows for them [28, Shkiperova G.T., Druzhinin P.V., Kurilo A.E., p. 653]. Only in some years the socio-ecological-economic development of the regions went beyond their limits. For example, the real growth of GRP went beyond the stability window in the republics of Karelia and Komi in 2017 (in Karelia, it exceeded the permissible limit, and in the Komi Republic it was below the permissible limit). When comparing the results of calculations for different environmental indicators, it was noted that the problems of water use are being solved more successfully than the problems of air pollution.
Calculation results and discussion
As a result of the calculations, the parameters of the functions allowing to forecast the dynamics of GRP were determined. The parameter reflecting technical progress was introduced only for recent years (Karelia and Komi — 2014–2018, Arkhangelsk Oblast — 2008–2018, Murmansk Oblast and macroregion — 2009–2018). Development of the Northern Regions after the 2008– 2009 crisis has slowed down, one could talk about the stagnation of economy, but, as calculations show, the efficiency of the northern regions’ economy is growing. Investments in their economies are not increasing, the number of employees is decreasing, and labor productivity is growing steadily in three regions, only in Komi its growth is absent. A slight economic contraction is ac-
-
9 Regiony Rossii. Sotsial'no-ekonomicheskie pokazateli 2019 [Regions of Russia. Socio-economic indicators 2019]. Federal State Statistics Service. URL: https://gks.ru/bgd/regl/b19_14p/Main.htm (accessed 11 January 2021).
companied by an increase in its efficiency. The growth of five-year investments in the economy of four regions by 1% increases the GRP by 0.26%, the growth of employment by 1% increases the GRP by 0.74%, the influence of technological progress over the past 10 years — 1.4% per year. Table 1 shows the results of calculations for the Republic of Karelia.
Table 1 The results of calculating the parameters of function (1) for 2000–2018
|
lnB |
α |
β |
γ 0 |
R2 |
F |
p |
|
|
GRP of Karelia |
0,14*** |
0.27*** |
0.666*** |
0.0221* |
0.92 |
20.1 |
0.0000 |
*** p<0.01, * p<0.1
The calculations carried out for the regions showed that it is necessary to construct spline functions or pollution functions for separate periods, since in the third period the interconnection of indicators differs markedly from earlier dependencies. In Karelia, economic growth was insignificant in the third period, and no improvement in the environmental situation was observed. The impact of environmental investments was small, due to investments in the protection of atmospheric air, emissions decreased by 0.04% with an increase in cumulative investments over four years by 1% with a lag of three years (Table 2). Therefore, a significant increase in environmental investments will be required in order to extend the sustainability window.
Table 2
The results of calculating the parameters of the pollution function (2) for 2007–2018
|
lnA |
μ |
η |
R2 |
F |
p |
|
|
Air emissions |
0.37 |
0.78* |
-0.04* |
0.41 |
3.1 |
0.094 |
* p<0.1
Separate calculations were carried out for the period from 2000, and additional data were used for other indicators, in particular, various areas of investment. The results of these calculations were used to construct various scenario conditions. Calculations were also made for environmental pollution by individual substances by region.
The parameters of function (3) were determined according to data for 2000–2018, the spline function was used, some of the parameters relate to the period before the crisis of 2008– 2009, and some of them — after the crisis (Table 3). Real income growth after the 2008–2009 crisis did not recover, but forecasts suggest its resumption.
Table 3
The results of calculating the parameters of function (3) for 2000–2018
|
A |
B |
C |
D |
K |
R2 |
F |
p |
|
|
Real money incomes of the population of Karelia |
12.5*** |
0.114* |
0.095*** |
-0.985*** |
-1.192*** |
0.99 |
122 |
0.000 |
***p<0.01, * p<0.1
Scenario conditions were based on indicators that change, but not too much: population size, number of people employed in the economy, employment rate, share of pensioners, unemployment rate, and environmental investments. The article considered scenario conditions corresponding to a stable situation in the economy, without taking into account possible economic crises. For each variant of the scenario conditions, it is possible to determine the boundaries of the
GRP change and investment in the economy within the stability windows. Table 4 shows the forecast of changes in the population size for one of the variants of scenario conditions (in this case, extrapolation was used; for other scenarios, it is necessary to use the method of age shifting with a separate estimate of the level of migration).
-
Table 4 Population dynamics by regions, inertial scenario, thousand people, at the end of the year
2020
2025
2030
Karelia
610.9
585.3
561.7
Komi
813.3
765.3
719.5
Arkhangelsk
1129.4
1090.9
1058.2
Murmansk
733.4
713.5
693.6
Four Arctic regions
3287
3155
3043
The population of the Arctic zone regions in this scenario will decrease by about 7% over 10 years. Possible changes in demographic and migration policies can improve the demographic situation in the North, so far the measures taken are ineffective. At the same time, in all northern countries, the population in Arctic cities is growing [7, Fauser V.V., Smirnov A.V., p. 15]. On the basis of this forecast the scenario conditions for the number of employed in the economy, the employment rate, the share of pensioners and the unemployment rate were built. The forecast of the dynamics of environmental investments was based on their reaching a level close to the maximum values in the 2000s, since in recent years there were practically no investments in air protection in Karelia and emissions of pollutants began to grow, exceeding the level of 2008.
Table 5 shows the results of calculations for Karelia for 2020–2030. It was assumed that there will be no radical changes in economic, environmental and social policies, which means that the obtained values of equations (1) – (3) can be used for forecasting until 2030. The Karelian economy is developing very slowly and it may return to the pre-crisis level of 2007 only by 2030. In this scenario, the level of employment decreases in accordance with the trends that have developed in recent years. The number of pensioners is stable until the transition to the new retirement age is completed, and then there is a return to the trend of growth in the number of pensioners. The unemployment rate declines slightly after the end of the pandemic and is then stable.
-
Table 5 Sustainability window for GRP of the Republic of Karelia, inertial scenario with an increase in environmental investments, 2020 — 100%
2020
2025
2030
Upper limit
100
108.2
110.4
Lower limit
100
98.3
101.8
Low growth rates lead to the lag of the country not only from developed, but also from developing countries and will require changes in economic policy; therefore, forecasting for a longer period requires other parameters of the model equations. The resulting stability window is shown in Fig. 7, it presents one of the possible options for the GRP growth rate — 100.9%, higher growth rates require a more responsible environmental policy.
о
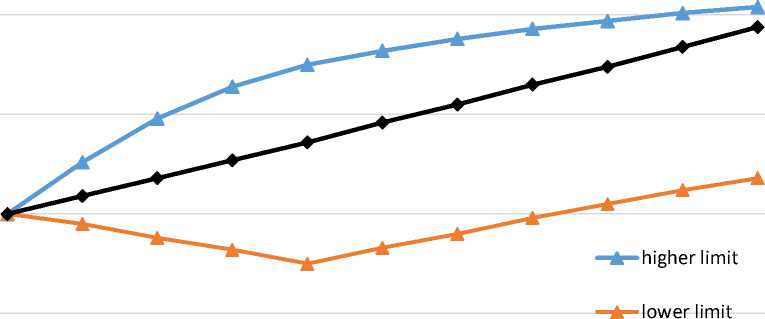
GRP forecast
2020 2021 2022 2023 2024 2025 2026 2027 2028 2029 2030
Fig. 7. Sustainability window of the Karelian economy for 2020–2030.
It is
possible to change the scenario conditions by formulating the requirements for in creasing the real incomes of the population and improving the environmental situation, then the sustainability window will be narrowed. By setting options for the growth of real incomes, changes in the level of employment (based on the deviation from the inertial option), the level of unemployment and the number of pensioners (based on changes in current trends), we obtain more stringent restrictions on the dynamics of GRP per capita in comparable prices. It resulted in limiting the minimum growth of the economy, providing a given level of well-being of the region's population. Besides, ensuring the growth of real incomes of the population with an increase in the number of pensioners receiving low incomes requires a noticeable acceleration in the growth of GRP, and the stability window is narrowing.
The calculations have shown that when equations become more complex, if technical progress related to structural shifts and economic modernization is taken into account in the pollution function, then formation of scenario conditions becomes more complex and the variability of the sustainability window increases. In order to study the impact of economic modernisation on the ecological situation, it is also possible to introduce the dynamics of investment in machinery and equipment into the equations, as information on investment in modernisation across regions is not available. As a result, it would be possible to construct a more accurate upper bound.
Conclusion
The methodology of sustainability windows calculation for regional economy presented in the article enables to investigate the consequences of decisions made, estimate possible variants of economic growth which do not violate the sustainability principle and allow increasing the pop- ulation well-being and not worsening ecological situation. The article discusses the possibility of using the methodology on the data of the Republic of Karelia, and only on the example of emissions of pollutants into the atmosphere and the actual disposable income of the population. But it is also possible to use other indicators, and then the windows will superimpose on each other, and the total window will be reduced, it will be determined by the minimum of the maximum values and the maximum of the minimum. It is also possible to build two composite indicators and form the window on their basis, which will require increasing the number of factors on the basis of which the scenario conditions are formed.
Scenario conditions were set on the basis of calculations for the production function, pollution function and the equation for assessing the dynamics of the population's real disposable income. The model equations can be made more complex by taking into account more factors, in particular investment in economic modernisation and structural shifts.
Overall, the approach allows for an assessment of socio-environmental economic policy in recent decades and makes it possible, by setting different scenario conditions, to analyse the conformity of different economic policy options with the conditions of sustainable development.
Acknowledgments and funding
The research was carried out under the RFBR project No. 18-05-60296 “Fundamental problems of the natural and social environment of the White Sea and the watershed area: state and possible changes under different scenarios of climate and economic changes”.
References Forecasting the Economic Growth Limitations in the Northern Regions Based on the “Sustainability Windows” Assessment
- Karginova V.V., Tolstoguzov O.V. Podkhod k otsenke sistemnykh riskov na osnove issledovaniya fazovykh izmeneniy ekonomicheskogo prostranstva [Approach to Estimation of System Risks on the Basis of the Study of Phase Changes of the Economic Space]. Fundamental'nye issledovani-ya [Fundamental Research], 2018, no. 1, pp. 76–80.
- Heininen L. Overview of Arctic Policies and Strategies. Arktika i Sever [Arctic and North], 2020, no. 39, pp. 195–202. DOI: 10.37482/issn2221-2698.2020.39.195
- Stepanko N.G., Stepanko A.A., Tkachenko G.G. Vozmozhnye ekologicheskie posledstviya ekonomicheskogo razvitiya severnykh territoriy Dal'nego Vostoka Rossii [Possible Environmen-tal Consequences of the Economic Development of the Northern Territories of the Far East of Russia]. Arktika: ekologiya i ekonomika [The Arctic: Ecology and Economy], 2018, no. 1 (29), pp. 26–36.
- Shelomentsev A.G., Belyaev V.N., Ilinbaewa E.A. Otsenka vzaimosvyazi ekonomicheskogo rosta i ekologicheskoy nagruzki v regionakh Urala [Interrelation Assessment of Economic Growth and Environmental Pressure in the Ural Regions]. Vestnik Orenburgskogo gosudarstvennogo univer-siteta [Vestnik of the Orenburg State University], 2014, no. 6 (167), pp. 158–163.
- Pyzheva Yu.I., Pyzhev A.I., Zander E.V. Perspektivy resheniya problemy zagryazneniya at-mosfernogo vozdukha regionov Rossii [Solving the Problem of Atmospheric Air Pollution in Rus-sian Regions]. Ekonomicheskiy analiz: teoriya i praktika [Economic Analysis: Theory and Prac-tice], 2019, vol. 18, no. 3 (486), pp. 496–513.
- Zabelina I.A., Klevakina E.A. Ekonomicheskoe razvitie i negativnoe vozdeystvie na okruzhayush-chuyu sredu v regionakh transgranichnogo vzaimodeystviya [Economic Development and Envi-ronmental Impact in the Border Regions]. EKO [ECO], 2016, no. 8 (506), pp. 67–82.
- Fauzer V.V., Smirnov A.V. Mirovaya Arktika: prirodnye resursy, rasselenie naseleniya, ekonomi-ka [The World''s Arctic: Natural Resources, Population Distribution, Economics]. Arktika: ekologiya i ekonomika [The Arctic: Ecology and Economy], 2018, no. 3 (31), pp. 6–22.
- Zharov V.S., Ivanova M.V. Problemy upravleniya sotsial'no-ekonomicheskim razvitiem regionov Arktiki [Management Problems of Socio-Economic Development of the Arctic Regions]. Vestnik Murmanskogo gosudarstvennogo tekhnicheskogo universiteta [Vestnik of MSTU], 2015, no. 3, pp. 393–400.
- Ivanova M.V., Kasparyan Zh.E. Nekotorye aspekty sotsial'noy politiki v Arkticheskoy zone Ros-siyskoy Federatsii [Some Aspects of Social Policy in the Russian Arctic Zone]. Sever i rynok: formirovanie èkonomičeskogo porâdka [The North and the Market: Forming the Economic Or-der], 2017, no. 3, pp. 97–108.
- Krivoshapkina K.V., Matveeva N.N. Analiz i prognoz srednedushevykh denezhnykh dokhodov naseleniya Respubliki Sakha (Yakutiya) [Analysis and Forecast of Per Capita Monetary Income of Population of the Sakha Republic (Yakutia)]. Vestnik Severo-Vostochnogo federal'nogo universi-teta im. M.K. Ammosova. Seriya: Ekonomika. Sotsiologiya. Kul'turologiya [Vestnik of North-Eastern Federal University. Economics. Sociology. Culturology], 2018, no. 4 (12), pp. 7–16.
- Ignasheva T.A. Statisticheskiy analiz sotsial'no-ekonomicheskikh indikatorov Respubliki Mariy El [Statistical Analysis of the Mari El Republic Socio-Economic Indicators]. Vestnik Mariyskogo gosudarstvennogo universiteta. Seriya: Sel'skokhozyaystvennye nauki. Ekonomicheskie nauki [Vestnik of Mari State University. Chapter: Agriculture. Economics], 2020, vol. 6, no. 3 (23), pp. 359–365.
- Toropushina E.E. Metodicheskie podkhody k otsenke urovnya razvitiya sotsial'noy infrastruktury regionov Severa i Arktiki Rossii [Methodical Approaches to Evaluation of Social Infrastructure Development in the Russian Northern and Arctic Regions]. Sever i rynok: formirovanie èkonomičeskogo porâdka [The North and the Market: Forming the Economic Order], 2018, no. 4, pp. 101–110.
- Labetskaya E.O. Transarkticheskiy kontekst strategicheskikh prioritetov RF [Trans-Arctic Context of Russia’s Strategic Priorities]. Puti k miru i bezopasnosti [Pathways to Peace and Security], 2014, no. 2, pp. 81–84.
- Krutikov A.V., Smirnova O.O., Bocharova L.K. Strategy for the Development of the Russian Arc-tic. Results and Prospects. Arktika i Sever [Arctic and North], 2020, no. 40, pp. 254–269. DOI: 10.37482/issn2221-2698.2020.40.254
- Slipenchuk M.V. Strategiya ustoychivogo razvitiya Arktiki [Strategy for Sustainable Development of the Arctic]. Sovremennye proizvoditel'nye sily [Modern Productive Forces], 2015, no. 3, pp. 31–39.
- Zaikov K.S., Kondratov N.A., Kudryashova E.V., Lipina S.A., Chistobaev A.I. Scenarios for the De-velopment of the Arctic Region (2020–2035). Arktika i Sever [Arctic and North], 2019, no. 35, pp. 4–19. DOI: 10.17238/issn2221- 2698.2019.35.5
- Kaivo-oja J., Panula-Ontto J., Vehmas J., Luukkanen J. Relationships of the Dimensions of Sus-tainability as Measured by the Sustainable Society Index Framework. International Journal of Sustainable Development & World Ecology, 2014, vol. 21, no. 1, pp. 39–44. DOI: 10.1080/13504509.2013.860056.
- Syrovatka M. On Sustainability Interpretations of the Ecological Footprint. Ecological Econom-ics, 2020, vol. 169, pp. 106543. DOI: 10.1016/j.ecolecon.2019.106543
- Lyaskovskaya E.A., Grigor'eva K.A. Reyting inklyuzivnogo razvitiya makroregionov Rossiyskoy Federatsii [Ranking of Inclusive Development of Macroregions of the Russian Federation]. Vest-nik YUUrGU. Seriya «Ekonomika i menedzhment» [Bulletin of SUSU. Series “Economics and Management”], 2018, vol. 12, no. 2, pp. 45–54. DOI: 10.14529/em180205
- Luukkanen J., Kaivo-oja J., Vehmas J., Panula-Ontto J., Hayha L. Dynamic Sustainability. Sustain-ability Window Analysis of Chinese Poverty-Environment Nexus Development. Sustainability, 2015, vol. 7, iss. 11. pp. 14488–14500. DOI: 10.3390/su71114488
- Luukkanen J. et al. Green Economic Development in Lao PDR: A Sustainability Window Analysis of Green Growth Productivity and the Efficiency Gap. Journal of Cleaner Production, 2019, vol. 211, pp. 818–829. DOI: 10.1016/j.jclepro.2018.11.149
- Druzhinin P.V., Shkiperova G.T., Potasheva O.V. Vliyanie razvitiya ekonomiki regionov Evrop-eyskogo Severa na okruzhayushchuyu sredu [The Impact of Economy Development of European North Regions on the Environment]. Trudy Kol'skogo NC RAN. Prikladnaya ekologiya Severa [Transactions Kola Science Center. Applied Ecology of the North], 2020, vol. 8, pp. 144–153.
- Bobylev S.N. Indikatory ustoychivogo razvitiya: regional'noe izmerenie [Sustainable Develop-ment Indicators: Regional Dimension]. Moscow, Akropol Publ., 2007, 60 p. (In Russ.)
- Uskova T.V. Upravlenie ustoychivym razvitiem regiona [Management of Sustainable Develop-ment of the Region]. Vologda, ISERT RAN Publ., 2009. 355 p. (In Russ.)
- Gutman S.S., Basova A.A. Indikatory ustoychivogo razvitiya Arkticheskoy zony Rossiyskoy Feder-atsii. Problemy vybora i izmereniya [Indicators of Sustainable Development of Russian Federa-tion Arctic Zone: Problems of Selection and Measurement]. Arktika. Ekologiya i ekonomika [The Arctic: Ecology and Economy], 2017, no. 4, pp. 32–48. DOI: 10.25283/2223-4594-2017-4-32-48
- Fauzer V.V., Smirnov A.V., Lytkina T.S., Fauzer G.N. Sustainable Development in Russia’s North-ern Regions: Labor Dimension. Economic and Social Changes: Facts, Trends, Forecast, 2018, vol. 11, no. 5, pp. 120–136. DOI: 10.15838/esc.2018.5.59.8
- Leksin V.N., Porfiryev B.N. Social'no-ekonomicheskie prioritety ustoychivogo razvitiya Arktich-eskogo makroregiona Rossii [Socio-Economic Priorities for the Sustainable Development of Rus-sian Arctic Macro-Region]. Ekonomika regiona [Economy of Region], 2017, vol. 13, no. 4, pp. 985–1004. DOI: 10.17059/2017-4-2
- Shkiperova G.T., Druzhinin P.V., Kurilo A.E. Ekologo-ekonomicheskie protsessy v regionakh Evropeyskogo Severa Rossii: analiz okna ustoychivosti [Environmental and Economic Processes in the European North of Russia: Sustainability Window Analysis]. Natsional'nye interesy: prior-itety i bezopasnost' [National Interests: Priorities and Security], 2020, vol. 16, no. 4, pp. 644–661.
- Galimullin E.Z. Migration Attitudes and Mechanisms for Attracting Young People to the Russian Arctic. Arktika i Sever [Arctic and North], 2019, no. 36, pp. 96–109. DOI: 10.17238/issn2221-2698.2019.36.96
- Emelyanova E.E. System Problems and Directions of Municipal Development of the Russian Arc-tic. Arktika i Sever [Arctic and North], 2019, no. 35, pp. 64–75. DOI: 10.17238/issn2221-2698.2019.35.79
