Forecasting the impact of investments on spatial heterogeneity in the development of the livestock industry

Author: Naumov Ilya V., Sedelnikov Vladislav M.
Journal: Economic and Social Changes: Facts, Trends, Forecast @volnc-esc-en
Section: Public finance
Article in issue: 2 т.16, 2023.
Free access
The article investigates uneven spatial development of livestock industry in Russia’s regions. It is caused by many factors, including the volume of attracted investments, human resources; and it endangers the food security of territories. The purpose of the study is to assess spatial heterogeneity in the development of the livestock industry in the Sverdlovsk Oblast. To achieve the goal, we set the following tasks: to conduct a spatial autocorrelation analysis of the development of the livestock industry in Sverdlovsk Oblast municipal entities, investigate the impact of human resources investments and costs on the development of spatial heterogeneity in the region’s livestock industry, assess the spatial effects of livestock industry development in territorial systems, design forecast scenarios for its development in the region’s municipal entities up to 2025. Having reviewed theoretical and methodological approaches to assessing spatial heterogeneity at the regional and municipal levels we find out that Russian and foreign researchers use a variety of methods. Their application does not contribute to the comprehensive assessment of spatial heterogeneity in the development of the livestock industry. To solve the problem, we propose a methodological approach, whose novelty consists in the comprehensive application of spatial autocorrelation analysis methods using various matrices of spatial weights, regression analysis using panel data and ARIMA modeling which, when combined, make it possible to determine the impact of investments and other factors on heterogeneity in the development of the livestock industry in the region’s municipalities and design a system of various forecast scenarios. The regression models we constructed have confirmed the differentiated impact of investments and human resources on spatial heterogeneity in the livestock sector in the Sverdlovsk Oblast and outlined the prospects for its development.
Investments, livestock industry, spatial heterogeneity, cobb-douglas production function, spatial autocorrelation, scenario forecasting, arima modeling
Short address: https://sciup.org/147240792
IDR: 147240792 | UDC: 332.1 | DOI: 10.15838/esc.2023.2.86.5
Text of the scientific article Forecasting the impact of investments on spatial heterogeneity in the development of the livestock industry
Problems associated with the spatial heterogeneity of the livestock industry development at the regional and municipal levels are relevant at the present time and typical for all countries, regardless of the level of economic development. Spatial heterogeneity of the livestock industry development, in our opinion, is manifested in the excessive concentration of production in certain territorial systems and lack of their development in others, which forms a threat to food security of the economic space at the municipal, regional and macroeconomic levels. Heterogeneity in the activities of the entities of agro-industrial production is expressed by the existing differences in the volume and structure of resources used, the geographical location specifics of the region, the quality of the obtained products and their competitiveness in domestic and foreign markets, proximity to distribution channels, etc. (Gorbatovskaya, 2017). According to V.F. Pechenevsky and O.I. Snegirev, among the many factors influencing the location and development of individual branches of animal industry, the most important are the natural potential of regional agriculture, zones and degrees of its use, land availability, zonal combinations of branches, level and structure of local food consumption, distance and means of transportation of certain types of products and raw materials for their production from the place of production to the place of consumption, which determines the transportation costs (Pechenevsky, Snegirev, 2018). As S.S. Patrakova notes, in order to reduce spatial heterogeneity and asymmetry, to increase the balance of development of the region’s municipal entities, it is necessary to form new local centers and growth poles, to increase the intensity of spatial interactions between territories (Patrakova, 2022).
In foreign studies, the approach of finding optimal options to reduce the negative effects of spatial heterogeneity also prevails, for example, in the study devoted to the factors affecting food security in China, large-scale differences and spatial heterogeneity of food security, and the factors determining it are considered (Lv et al., 2022).
At present, the dynamics of change in the spatial heterogeneity in the livestock industry development in the territorial systems of different levels and the development of mechanisms for its smoothing are relevant. An important aspect is the assessment of the formation and development of the spatial heterogeneity factors. On this basis, the main purpose of the presented work was to assess the spatial heterogeneity in the livestock industry development in the Sverdlovsk Oblast. The object of the study are the municipal entities of the Sverdlovsk Oblast, the subject is socio-economic relations arising in the process of livestock production.
To achieve the goal, the following tasks were set: to conduct a theoretical review of the methods used to assess the spatial heterogeneity of economic activities of economic entities, scenario modeling, forecasting their development in the future and forming a systematic approach, taking into account advantages and disadvantages of these methods; to evaluate the spatial heterogeneity of livestock industry development in the municipal entities of the Sverdlovsk Oblast and to search for the main centers (growth poles) of the industry development, similar by the level of industry development of municipal entities that can be combined into spatial clusters, and their influence zones; to model the spatial effects in livestock industry development in these territorial systems; to form a Cobb – Douglas regression model using panel data on municipal entities of the Sverdlovsk Oblast for assessing the impact of attracted investment in fixed capital and wages on livestock production volume in the region’s municipal entities; to build regression models on the time series to assess the degree of influence of these factors on livestock industry development; to carry out ARIMA modeling of the dynamics of the evaluated factors to form the most likely forecast scenarios of the industry development until 2025: inertial, taking into account the currently observed trends, optimistic and pessimistic.
The solution of these problems will allow us to consider not only the spatial heterogeneity of the livestock industry in the Sverdlovsk Oblast, but also the differentiation of its formation factors; and the regression models will help to develop mechanisms for its smoothing.
Review of theoretical and methodological approaches to the assessment of spatial heterogeneity
Evaluation of the spatial heterogeneity phenomenon has been extensively developed in the works of Russian and foreign scientists. Thus, K.T. Sibhatu, L. Steinhubel, H. Siregar, M. Kaim and M. Volney studied the spatial heterogeneity of palm oil production activities in a sample of Jambi households in Indonesia, using structured additive regression models with nonlinear spatial effects in order to visualize spatial clusters (Sibhatu et al., 2021). В. Yang, H. Gia and others examined spatial heterogeneity in food consumption of rural households based on food and consumer habits on the example of typical transitional pastures of Inner Mongolia and China, using one-way analysis of variance (Yang et al., 2022). A team of authors (T.J. Chikuvire, S. Mpepereki et al.) used descriptive and non-parametric statistics to investigate the impact of spatial heterogeneity on food security in the Mutoko Municipal District (MD), a typical arid zone in Zimbabwe (Chikuvire et al., 2006). M.Yu. Arkhipova and A.I. Smirnov used linear and nonlinear regression models to statistically evaluate the indicators used for crop yield forecasting (Arkhipova, Smirnov, 2020).
To study the spatial heterogeneity of socioeconomic development at the regional and municipal levels, statistical methods are often used: integral coefficients, the Herfindahl – Hirschman and Theil indices, statistical characteristics (mean value, median, standard deviation, skewness coefficient, kurtosis coefficient, coefficient of variation, etc.). The differentiation indicator, the Theil index, was used by A.V. Brovkova to analyze socio-economic inequality and convergence of Russian regions, and to identify problem areas of spatial development and growth poles (Brovkova, 2014). Y. Zhang and B. Li applied the Theil index and geographically weighted regression to explain the spatial and temporal characteristics of wheat production distribution in the Huang-Huai-Hai region (Zhang, Li, 2022). G.Yu. Gagarina and R.O. Bolotov carried out decomposition of interregional inequality using the Theil index and proved that differences within federal districts are only a small part of spatial heterogeneity, while interregional differences within districts account for over 80% of all regional variation (Gagarina, Bolotov, 2021). The study of A.F. Zimin and V.M. Timiryanova assesses the spatial heterogeneity of the consumer goods market based on indicators of territorial specialization and localization of individual processes in the regions of Russia (Zimin, Timiryanova, 2016).
The concentration coefficient and the Herfindahl – Hirschman index were used by M.N. Tolmachev to study the level of concentration of agricultural production and production factors in RF regions for the period from 2000 to 2008 (Tolmachev, 2010), and by L. Piet to assess the degree of economic and production potential concentration of farms in EU countries (Piet, 2017). Statistical methods (including the Gini coefficient, variation coefficients, the Atkinson and Theil indices) are used by Russian scientists to assess regional differentiation by various indicators, such as gross regional product and population income (Glazyrina et al., 2010), wages (Zubarevich, 2013), the level of distribution of investment, poverty and unemployment (Zubarevich, Safronov, 2013), tax revenues (Malkina, Balakin, 2014), budget revenues before and after their distribution (Postnikova, Shiltsin, 2009).
The Cobb – Douglas production function and geographically weighted regression (GWR) method are actively used by Russian and foreign researchers to model spatial heterogeneity. In particular, A.A. Kog and co-authors identified spatial differences in agricultural production based on GWR and the Cobb – Douglas function to estimate the impact of agriculture on gross income in Turkey (Kog et al., 2017). In this study we used not the standard Cobb – Douglas production function, but a geographically weighted modification of it, in the construction of which the fixed effects of regions with dummy variables, a vector of variables for regional dummy variables and a vector of parameters to describe the relationship between the factors and the regional dummy variable in the model were taken into account.
T.P.S. Wagle applied the Cobb – Douglas production function to investigate the logical relationship between production and labor costs using the example of Nepal’s agricultural industry (Wagle, 2016). N.V. Suvorov and his colleagues used the Cobb – Douglas production function with static and dynamic parameters on the example of the industrial complex of the Republic of Bashkortostan for 2006–2016 (Suvorov et al., 2020).
М. Wenbo, T. Weiteng, J. Kian and M. Kiankian used geographically weighted regression based on temporal and geospatial characteristics to offset the shortcomings of traditional spatial data analysis, which considers only spatial heterogeneity and ignores the temporal variable. The authors identified the key factors affecting urbanization (socioeconomic factors, education, secondary industry, habitat) in the spatial and temporal dimension by constructing a GWR model using 110 cities in the Yangtze River economic belt as an example (Wenbo et al., 2021).
A.G. Bille, S. Salvioni and R. Benedetti used an iterative geographically weighted regression (IGWR) method to overcome spatial heterogeneity in order to identify clusters of spatial technologies, that is groups of firms using a common technology, using the Italian olive production market as an example (Bille et al., 2015). В. Fang, H. Huang, B. Yang and Q. Hu studied the factors causing geographical heterogeneity of grain production levels in Guangdong Province of China in terms of land, labor and capital. The GWR method was used to eliminate the effect of spatial attenuation of influencing factors (Fang et al., 2021). At the same time, geographically weighted regression methods do not allow us to estimate the dynamics of spatial heterogeneity of the studied processes, because they rely exclusively on spatial data and estimate the influence of factors using the geographic coordinates of the research objects (latitude and longitude).
In addition, Russian and foreign scientists used methods of spatial autocorrelation to study spatial heterogeneity at the regional and municipal levels. A.A. Khan constructed spatial models of the livestock industry development in regions of Turkey in order to identify growth poles and potential clusters based on the method of spatial autocorrelation, taking into account the global and local Moran’s indices (Khan, 2020). A team of authors (S. Han, J. Wang et al.) applied spatial autocorrelation analysis to study spatial structural changes in the livestock industry in China for the period 1980–2017. The results of the study showed that the production capacity of the land, along with the increase in income and living standards of the population played an important role in the livestock industry development (Han et al., 2020). T.A. Dubrova used multivariate statistical and cluster analysis to form groups of countries by meat production for the period 2000–2011 (Dubrova, 2014). A similar toolkit was applied by Y. Shouying and F. Qiaoxi in investigating spatial dependencies and identifying spatial heterogeneity of crop production in Sichuan Province from 2000 to 2016 (Shouying, Qiaoxi, 2018), and D.J. Augustine, D.T. Booth, S.E. Cox and J.J. Derner applied it to analyze spatial heterogeneity of vegetation in grasslands (Augustine et al., 2012).
To consider the spatial effects of the development of certain processes in foreign studies, we used various tools of spatial regression modeling, such as models with spatial lag (SAR), spatial error (SEM), their combination (SAC), and spatial Durbin models, which estimated the spatial lag of factor features (SDM-model). Thus, a team of authors (N. Atikah, B. Vidodo et al.) used the Spatial Durbin Model (SDM) for mapping the area to assess and optimize the level of tax revenues from advertising in Malang city (Atikah et al., 2021). Other researchers have performed a spatial distribution of China’s elite hospitals and evaluated the factors influencing it based on geographically weighted regression (GWR), multiscale geographically weighted regression (MGWR), GWR and MGWR with spatial autocorrelation (GWR-SAR and MGWR-SAR), spatial lag model (SLM) and spatial error model (SEM) (Shi et al., 2021). City level, number of medical colleges, level of urbanization, resident population and GDP per capita were identified as the most significant factors. J. Bulteau, T. Follet, and R. Le Bonec using spatial econometric models (SAR and GWR) revealed spatial heterogeneity and spatial interactions between the transport infrastructure of Nantes (northwestern France) and the pricing policies for home sales in urban and suburban (rural) areas (Bulteau et al., 2018).
A review of theoretical and methodological approaches to the assessment of spatial heterogeneity in the development of animal industry at the regional and municipal levels showed a variety of methods used by researchers. All methods mentioned above have their advantages, disadvantages, peculiarities and limitations. Statistical methods allow us to make a quick assessment of spatial heterogeneity, but do not provide an opportunity to identify the factors causing it. Regression analysis helps to solve this problem, but it does not fully take into account the influence of spatial effects in the study of heterogeneity, and the formed panel models can complicate the forecasting process. Geographically weighted regression models are used to analyze the spatial heterogeneity factors, they allow us to take into account the distance between territories, but do not take into account the time factor, which makes the process of assessing changes in spatial heterogeneity in dynamics much more difficult. Spatial models (SAR, SEM, SAC, SDM and others) make it possible to establish the influence of neighboring areas, take into account the time factor, but are difficult to apply for multivariate forecasting of the studied processes, because regression coefficients relevant to spatial lag and error in them cannot be interpreted directly, as in traditional regression models.
Spatial autocorrelation analysis allows us to carry out a cluster analysis of territories, to identify the existing direct and inverse relationships between them, to determine the main centers of resource concentration and thus confirm the spatial heterogeneity of their distribution. At the same time, only the distance between territorial systems is considered as a heterogeneity factor. It is necessary to have a methodological approach for spatial heterogeneity of cattle breeding branch development research, which integrates methods of spatial autocorrelation analysis, regression modeling and ARIMA modeling and helps to reveal factors, which cause spatial heterogeneity, and also to take into account the influence of spatial effects.
Methodological foundations of scenario modeling and forecasting of the livestock industry spatial heterogeneity
For studying and scenario forecasting of spatial heterogeneity of the livestock industry development in the region, an approach was proposed, which is based on methods of spatial autocorrelation analysis, regression modeling using panel data and autoregressive integrated moving average (ARIMA). At the initial stage, spatial autocorrelation analysis by a modified method of P. Moran was used to assess the location of the main centers of the livestock industry production. Its modification consisted in using not one, but a whole system of spatial weights matrices to calculate the global and local spatial autocorrelation indices and form the Moran scatter plot (standardized and traditional inverse distance matrices for roads, linear distances and contiguous boundaries). The need for their use is due to the importance of obtaining reasonable results of spatial analysis, their generalization by various matrices.
Global (1) and local Moran’s spatial autocorrelation indices (2) calculated on their basis in the dynamics for the 2017–2020 period, the assessment of their statistical significance of Z, P-value (3) will allow us to confirm the spatial heterogeneity of the livestock industry in the Sverdlovsk Oblast in case of negative values and identify trends in its development, and the formed Moran scatter plot will allow us to establish spatial centers (growth poles) of development of this industry, municipal entities with similar characteristics and a high level of spatial mutual influence, which can form spatial interterritorial clusters in the livestock industry, and their zones of strong and weak influence.
I _ T.i'L j Wij^i-xXx j -x) G - ^(х-х)2£ ; £7-^ ,
where IG – Moran’s global spatial autocorrelation index; wij – element of the weight matrix W; xi – studied indicator of the municipal entity (ME) ( i ); xj – analyzed indicator of another municipal entity (j ); x — average value of the indicator; n — total number of municipal entities.
ki
= n *
(X j -"x) T,iWi j (x j -x)
Xi(.Xi-^2
where ILi – Moran’s local spatial autocorrelation index.
7 _ ^ б -£({ б )
- SD (IG) ,
where Z – z-score value, which allows us to determine by how many standard deviations the actual value of the spatial autocorrelation index is removed from the expected mean value; E ( IG ) – the expected average value of Moran’s global index; SD ( IG ) – the standard deviation of Moran’s global index.
The modification of this methodology consisted in highlighting municipal entities with different levels of spatial mutual influence (with local indices of spatial autocorrelation above and below the average) in each quadrant of the Moran plot. Their allocation in the HL quadrant will allow us to establish the territories that are really the centers of livestock development in the region (growth poles), and identify only the emerging growth poles, and in the HH quadrant – formed and emerging spatial clusters of interconnected territories in the industry. The division of territories in the LH quadrant by the strength of spatial mutual influence will help to establish the municipal entities, experiencing a strong and weak influence of growth poles and spatial clusters in the livestock industry of the Sverdlovsk Oblast. Their impact on the surrounding areas can be confirmed by forming a matrix of local indices of spatial autocorrelation LISA between municipal entities and highlight the territories in it with an index greater than the average, calculated from the positive and negative values of the index. The analysis carried out by different matrices of spatial weights will make it possible to identify sustainable direct and inverse spatial interactions between the main centers of cattle breeding and the surrounding areas in the Sverdlovsk Oblast. In addition to the spatial autocorrelation analysis by Moran’s method for assessing the spatial heterogeneity of the livestock industry development, the traditional statistical approach to grouping municipal entities will be used. The first group includes municipal entities with the highest livestock industry production volume, exceeding the standard deviation from the average for the Sverdlovsk Oblast; the second group includes territories with average production volume; the third group includes municipal entities with production volume below the average.
The second stage of the study is to assess the spatial heterogeneity factors in the development of the livestock industry in the Sverdlovsk Oblast using the classical Cobb – Douglas regression model on panel data from municipal entities of the region for the period from 2010 to 2020. This model is traditional in the study of production organization efficiency in various industries, and it allows us to estimate the impact of the volume of attracted investments in fixed capital and funds, forming the wage fund of employees, on the volume of production; arising additional effects from the scale of production activities (decreasing, constant and increasing returns). Elasticity coefficients for these factors in the model will help to establish the degree of their impact on the livestock production volume in the municipal entities of the region, to form the basis for the most likely forecast scenarios of industry development until 2025. When constructing the model, traditional factors were used, control variables were not included due to the limited statistical data on municipal entities characterizing the development of the livestock industry.
For assessing the impact of key production factors on the dynamics of livestock production produced in the municipal entities of the Sverdlovsk Oblast, it is proposed to use a regression model on the panel data with fixed and random effects (4):
Ln(Vu ) = a + ^ + Y t + №(Сц ) + + №( L it ) + S it ,
where Vit – livestock production volume, thousand rubles; Cit – volume of attracted investments in fixed capital by livestock enterprises located in the territory of the municipal entity, thousand rubles; Lit – resources allocated by livestock enterprises for the development of human resources (wage fund of all employees of organizations), thousand rubles; α – constant, the total of other factors influencing livestock production volume; β 1 – elasticity coefficient for the attracted investments volume; β 2 – elasticity coefficient on the cost of human resource development; µt – the individual effect of municipal entity i , time-independent t ; γt – temporal effects for municipal entity i at time t ; εit – normally distributed random variables for time t and territory i (model errors).
To construct the model, it is proposed to use the data for 69 municipal entities of the Sverdlovsk Oblast for the period from 2010 to 2020 in comparable prices (2010). Due to limited statistical data,
the sample did not include municipal districts with a very low population size. To assess the impact of not only production factors on the livestock production dynamics in the municipal entities of the Sverdlovsk Oblast, but also the spatial effects of the surrounding areas, we propose to form a Cobb – Douglas model with spatial lag – SAR (5), model with spatial dependence in errors – SEM (6) and an integrated model with spatial lag and error – SAC at the next stage of research (7):
Ln(V it ) = a + №(Ctt ) + №at t) + + p Ln^WV it ) + E it ,
Ln(V it ) = a + P t Ln(C it ) + P 2 Ln(L it ) + + AWll it + Y t + H i + £ it ,
LtiXVit) = a + l31Ln(Cit') + p2Ln(Lit) + + p Ln^WVtt) + /W^t + Yt + Hi + eit, where Vit – livestock production volume, thousand rubles; Сit – volume of attracted investments in fixed capital by livestock enterprises located in the territory of the municipal entity, thousand rubles; Lit – resources allocated by livestock enterprises for the development of human resources (wage fund of all employees of organizations), thousand rubles; WVit – spatially weighted values of livestock production volume; ρ – spatial autoregressive coefficient; Wuit – spatial autocorrelation matrix of the error; λ – vector of time-independent individual spatially dependent specific effects; α – constant, the totality of other factors influencing livestock production volume; β1 – elasticity coefficient for the volume of attracted investments; β2 – coefficient of elasticity of costs for human resource development; µt – the individual effect of municipal entity i, time-independent t; γt – temporal effects for municipal entity i at time t; εit – normally distributed random variables in time t and in territories i (model errors).
This model can be build using the Panel Generalized Method of Moments and the weighted White matrix tool to control for heteroscedasticity in the model, and data transformation with the help of orthogonal deviations, introducing dummy variables for each spatial unit and each time period. To obtain the coefficient of spatial autoregression, reflecting the impact of livestock production in neighboring municipal entities, spatial weighting of its volume on the matrix of spatial weights by linear distances between municipal entities is proposed. The use of panel data on municipal entities for 11 years will establish not short-term, but long-term spatial effects. The formation of an integrated model with spatial lag and error will help to correct the coefficient of spatial autoregression and assess the influence of spatial features on its errors, thereby confirming the importance of spatial location of municipal entities for the development of the livestock industry in the region.
In order to substantiate the significant influence of the factors under consideration on the dynamics of spatial heterogeneity of the livestock industry development in the region and the construction of forecast scenarios for its development in the next stage of the study it is proposed to build regression models using time series for municipal entities of the Sverdlovsk Oblast for the period from 2010 to 2020. These models will assess the degree of investment and cost impact on the development of human resources capacity of livestock enterprises in the municipal entities belonging to the already formed and emerging growth poles, spatial clusters and zones of their strong and weak influence, on the production volume of enterprises in the industry.
Basic, most likely forecast scenarios of changes in the livestock production dynamics in the municipal entities of the Sverdlovsk Oblast can be constructed with the help of the ARIMA modeling of the dynamics of the factors included in the Cobb – Douglas regression model. Autoregressive modeling using a moving average will build an inertial forecast of these factors’ dynamics up to 2025, taking into account the trend observed in the past, and establish a corridor of possible fluctuations in their forecast values. The reliability of the ARIMA models will be assessed using the coefficient of determination, the Schwartz, Akaike and Hennan – Quinn information criteria, standard errors and P-values of the main model parameters.
Forecast values of the investment dynamics in fixed capital and costs of enterprises to develop human resources, obtained in the course of ARIMA modeling, at the next stage will be used to form the three most likely scenarios of change in livestock production dynamics in the municipal entities of the Sverdlovsk Oblast until 2025: inertial, assuming the preservation of the marked trends in the dynamics of indicators for the period from 2010 to 2020, pessimistic and optimistic. The Cobb – Douglas Regression models formed in the second stage of the presented methodological approach will be used for the construction of scenarios. Thus, for modeling and forecasting the spatial heterogeneity of the livestock industry development in the Sverdlovsk Oblast it is expected to implement a systems approach based on the application of statistical research methods, spatial autocorrelation analysis, regression modeling on panel data and time series, and also ARIMA modeling to form the most probable forecast scenarios.
Results of the study
The Sverdlovsk Oblast is the largest industrial center of Russia, and livestock industry is not the main branch of its specialization. However, in the context of achieving and maintaining food security in the region and reducing its dependence on imports of livestock products from other countries, this sector of agriculture, in our opinion, should be
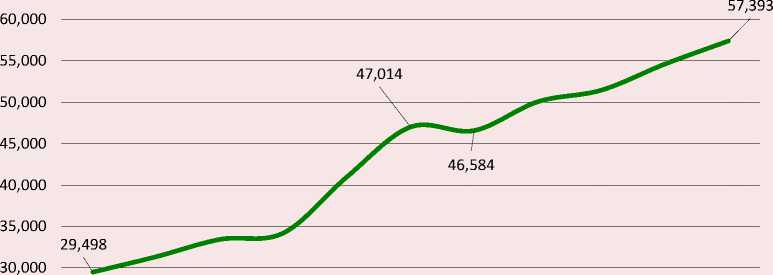
Figure 1. Dynamics of livestock production in the Sverdlovsk Oblast from 2010 to 2020 in actual prices, million rubles
25,000
2010 2011 2012 2013 2014 2015 2016 2017 2018 2019 2020
Source: Federal State Statistics Service.
actively developed. If we look at the dynamics of the production volume of the industry enterprises (Fig. 1) , we can note that over the past 10 years (from 2010 to 2020) the indicator has almost doubled.
Despite the significant development of the livestock industry in the region, the problem of spatial heterogeneity of its location still remains acute. Currently, almost 50% of livestock production in the Sverdlovsk Oblast is produced in six municipal entities: Reftinsky Urban Okrug (UO) (10.5%), Irbitskoye Municipal Entity (ME) (9.8%), Bogdanovich UO (7.8%), Kamyshlovsky Municipal District (MD) (7.6%), the city of Yekaterinburg (7.5%) and Verkhny Tagil UO (4.2%). In 2010, they produced 37.6% of all livestock products in the region and their production volume exceeded one standard deviation from the average, calculated for all municipal entities of the oblast. Statistical analysis of the data showed that from 2010 to 2020, the level of production concentration of this agricultural industry in some of them significantly increased. For example, the share of livestock products in Bogdanovich UO in relation to the total volume of output production in the region increased from 3.3 to 7.8% and in Kamyshlovsky MD – from 2.6 to 7.6% (Tab. 1).
A slight increase in the production concentration was also observed in Reftinsky UO and Irbitskoye ME. The group of municipal entities with a level of the livestock industry production concentration above the average for the Sverdlovsk Oblast according to 2020 included Talitsky UO (3.3%), Sukhoy Log UO (3.1%), Pervouralsk UO (3%), Gornouralsky UO (2.9%), Kamensky UO (2.8%), Beloyarsky UO (2.4%), Sredneuralsk UO (2.4%), Sysertsky UO (2.3%) and others. Sixteen municipal entities of this group account for 38.7% of all livestock production in the region, while in 2010 it was 40.7%. In some municipal entities, the level of production concentration decreased significantly, for example, in Pervouralsk UO (from 3.8% to 3.0%), Gornouralsky UO (from 4.6% to 2.9%) and Sredneuralsk UO (from 3.9% to 2.4%).
Table 1. Dynamics of livestock production and the level of its concentration in municipal entities in 2010 and 2020
|
2010 |
2020 |
||||
|
million rubles |
% |
million rubles |
% |
||
|
Main production centers |
Reftinsky UO |
2,892 |
9.8 |
6,033 |
10.5 |
|
Irbitskoye ME |
2,401 |
8.1 |
5,610 |
9.8 |
|
|
Bogdanovich UO |
983 |
3.3 |
4,477 |
7.8 |
|
|
Kamyshlovsky MD |
776 |
2.6 |
4,351 |
7.6 |
|
|
ME city of Yekaterinburg |
2,363 |
8.0 |
4,329 |
7.5 |
|
|
Verkhny Tagil UO |
1,676 |
5.7 |
2,403 |
4.2 |
|
|
Municipal entities with a concentration level higher than the regional average |
Talitsky UO |
909 |
3.1 |
1,889 |
3.3 |
|
Sukhoy Log UO |
591 |
2.0 |
1,797 |
3.1 |
|
|
Pervouralsk UO |
1,108 |
3.8 |
1,727 |
3.0 |
|
|
Gornouralsky UO |
1,362 |
4.6 |
1,638 |
2.9 |
|
|
Kamensky UO |
785 |
2.7 |
1,595 |
2.8 |
|
|
Sredneuralsk UO |
1,146 |
3.9 |
1,358 |
2.4 |
|
|
Beloyarsky UO |
607 |
2.1 |
1,388 |
2.4 |
|
|
Baikalovsky MD |
574 |
1.9 |
1,325 |
2.3 |
|
|
Nizhny Tagil |
60 |
0.2 |
1,306 |
2.3 |
|
|
Sysertsky UO |
696 |
2.4 |
1,343 |
2.3 |
|
|
Pyshminsky UO |
801 |
2.7 |
1,250 |
2.2 |
|
|
Artinsky UO |
860 |
2.9 |
1,218 |
2.1 |
|
|
Alapaevskoe ME |
625 |
2.1 |
1,208 |
2.1 |
|
|
Turinsky UO |
545 |
1.8 |
1,086 |
1.9 |
|
|
Krasnoufimsky ME |
733 |
2.5 |
1,044 |
1.8 |
|
|
Artemovsky UO |
613 |
2.1 |
1,050 |
1.8 |
|
|
Average level in the Sverdlovsk Oblast |
427.5 |
1.4 |
831.8 |
1.4 |
|
|
Standard deviation by oblast |
624.7 |
2.1 |
1,319.1 |
2.3 |
|
|
Source: Federal State Statistics Service. |
|||||
Table 2. Global Moran’s index of livestock production in the Sverdlovsk Oblast’s municipal entities in 2020 and indicators, characterizing its statistical significance
|
Distance matrix by roads (normalized) |
Distance matrix by roads |
Linear distance matrix (normalized) |
Linear distance matrix |
|
|
Global Moran’s index |
-0.0491 |
-0.0624 |
-0.1505 |
-0.1558 |
|
sd(Ii) |
0.0008 |
0.0009 |
0.0012 |
0.0012 |
|
E(Ii) |
-0.0000103 |
-0.0000131 |
-0.0000316 |
-0.0000327 |
|
Z-score |
-58.4 |
-71.4 |
-128.0 |
-131.4 |
|
P-value |
0.00000 |
0.00000 |
0.00000 |
0.00000 |
|
Source: own compilation. |
||||
Thus, currently there is a high degree of spatial heterogeneity in the development of the livestock industry in the Sverdlovsk Oblast, its level is increasing every year, and this negatively affects the food security of the territories. To assess the degree of spatial heterogeneity of the industry development we used spatial autocorrelation analysis by a modified method of Moran. During the analysis we used four matrices of spatial weights between municipal entities of the region: standard matrices for roads and linear distances and their standardized versions. The global Moran’s spatial autocorrelation index and Z-score calculated on their basis had negative values, which indicates a significant heterogeneity of territories by the livestock production volume in the region in 2020 (Tab. 2) .
Calculated values of Moran’s indices according to these spatial weight matrices are statistically significant, P-values of Moran’s coefficients do not exceed the acceptable level of 5% (0.05). The results of the spatial autocorrelation analysis, reflected in the Moran scatter plots for the four spatial weight matrices, were summarized and systematized. As a result, in the HL quadrant of territories, that are growth poles (the main centers of cattle breeding in the region), were included Irbitskoye ME, Kamensky UO and Kamyshlovsky MD, that is, the municipal entities whose local spatial autocorrelation index in 2020 exceeded the average level of negative values. This category also included other municipal entities: the city of Yekaterinburg, the city of Nizhny Tagil, Artinsky UO, Verkhny Tagil UO and Reftinsky UO. However, their local autocorrelation index was significantly lower than the regional average, indicating a low level of their spatial interinfluence with other municipal entities. Since these municipal entities are surrounded by territories with a lower volume of livestock production, we referred them to potential growth poles, which in the future may become the centers of development of this agricultural sector.
The HH quadrant of the Moran local spatial autocorrelation scatter plot includes Bogdanovich UO, Sukhoy Log UO and Turinsky UO, which, with the development of close cooperative relationships, can form a spatial cluster, since they have similar characteristics and a high volume of livestock production. Their local autocorrelation indices exceed the average level for municipal entities of the Sverdlovsk Oblast, calculated on the basis of positive values. Areas with similar characteristics, but with a low level of spatial interinfluence (below average) were identified: Artemovsky, Beloyarsky, Gornouralsky, Sredneuralsky, Talitsky and other urban okrugs. Their close location to the main centers of production in the livestock industry (to the HL quadrant) forms an advantage for the progressive development of the industry. Most likely, these municipal entities will form a spatial cluster of interconnected territories or become new growth poles in the future. Spatial autocorrelation analysis using Moran’s methodology, allowed us to establish zones of strong and weak influence of growth poles and spatial clusters in the livestock industry (Fig. 2) .
Their strong influence in 2020 was experienced by Verkhnee Dubrovo UO and Kamyshlovsky MD and municipal entity the town of Alapaevsk.
Growth poles and spatial clusters of similar regions with a high volume of livestock production influenced Aramilsky, Asbestovsky, Berezovsky, Verkhnesaldinsky, Verkhne-Neyvinsky, Verkhne-Pyshminsky, Verkhotursky, Degtyarsky, Zarechny, Revdinsky, Staroutkinsky, Kirovgradsky, Malyshev-sky, Nevyansky, Polevskoy, Rezhevskoy, Tavdinsky, Tugulymsky and Shalinsky urban okrugs. They
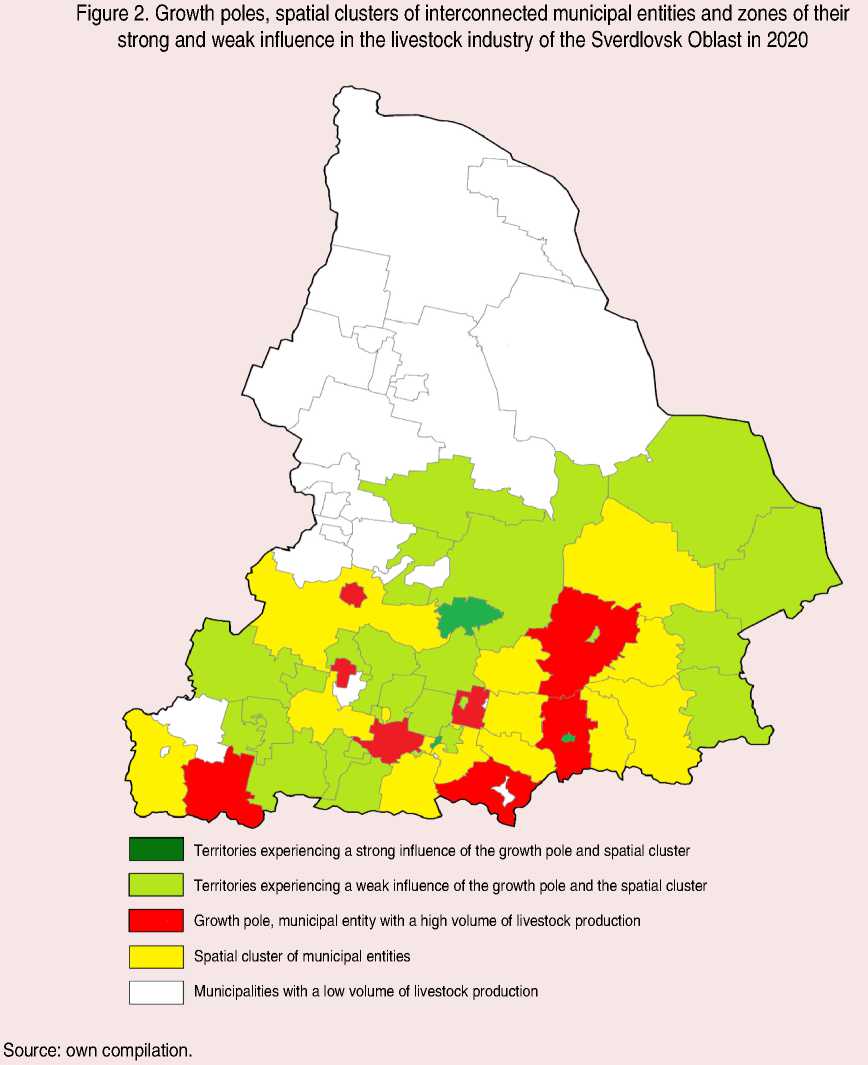
are surrounded by growth poles and spatial clusters. The white spots in Figure 2 correspond to municipal entities with low volumes of livestock production. Their predominance also confirms the high spatial heterogeneity of industry development in the region.
The zones of influence of growth poles and spatial clusters established by the Moran scatter plot were confirmed by the distribution matrix of local Moran’s spatial autocorrelation indices. The matrix reveals the strength and direction of spatial interactions between territorial systems on the indicator under consideration. Positive local autocorrelation indices, exceeding the average value, in this matrix characterize direct, close spatial interactions. Such interactions on the four considered matrices of spatial weights were observed between Reftinsky UO and such municipal entities as the city of Yekaterinburg, Bogdanovich UO, Sukhoy Log UO, Irbitskoye UO, Kamyshlovsky MD; between Bogdanovich UO and the city of Yekaterinburg, Sukhoy Log UO, Kamyshlovsky MD, Irbitskoye ME. Close direct autocorrelation relationships were recorded between Krasnoufimsky Okrug and Turinsky UO, between Verkhnee Dubrovo UO and Kamensk-Uralsky UO, between Verkhotursky UO and Krasnoufimsk UO. The high tightness of established spatial interactions is explained by their close proximity and similarity in the volume of livestock production. The formation and expansion of close cooperative relationships between livestock enterprises of these municipal entities will contribute to the expansion of the influence zone of growth poles and spatial clusters and, in general, the active development of the industry in the region.
Inverse close spatial interactions were noted between Verkhnee Dubrovo UO and Kamensky UO, between Kamyshlovsky MD and Kamyshlovsky UO, between Irbitskoye ME and the town of Irbit, that is, between the municipal entities located next to each other. They differ significantly from each other, and, as a rule, the development of the livestock industry in one of them occurs at the expense of the resources of the other municipal entity. Migration of labor resources, proximity of financial and banking infrastructure, and transport and engineering infrastructure contribute to the development of such interactions. Strengthening of inverse spatial interactions between municipal entities will have a negative impact on the livestock industry development in the region, contribute to an already high level of its spatial heterogeneity.
To predict the spatial heterogeneity of the livestock industry development and evaluate its formation and development factors, we used the classical regression Cobb – Douglas model, which allows us to establish the emerging effects of the scale of production activities (increasing, constant and decreasing returns) and assess the influence degree of the main production factors on the livestock industry development in the municipal entities of the Sverdlovsk Oblast: investments attracted by enterprises in fixed capital and resources, allocated for the development of their human resources. When forming the model, we used panel data on 69 municipal entities of the region from 2010 to 2020 (759 observations). Before constructing the model, the time series data were tested for stationarity using the Dickey – Fuller test and for some municipal entities were transformed to a stationary form using the method of analytical smoothing of time series. The calculation of descriptive statistics was carried out and in order to increase the homogeneity of the data, the Cobb – Douglas model with the elasticity coefficients by production factors was constructed, the original data were transformed by extracting the natural logarithm.
Panel diagnostics of the regression analysis results, carried out with the help of the Breusch – Pagan and Hausman tests, and evaluation of the Schwartz, Akaike and Hennan – Quinn information criteria showed that the optimal model is a panel regression model with fixed effects (8):
Ln(V) = 8.724 + 0.021 * Ln(C) + 0.231 * Ln(L) , (8)
where V – livestock production volume (in comparable prices of 2010), thousand rubles; C – volume of attracted investments in fixed capital, carried out by organizations located in the territory of the municipal entity, thousand rubles; L – resources, allocated by the livestock industry enterprises for human resource development (wage fund of all employees of organizations), thousand rubles.
Table 3. Results of the regression analysis of livestock production volume dependence in the municipal entities of the Sverdlovsk Oblast on the attracted investments in fixed capital and the payroll of business entities (with fixed effects)
|
Coefficient |
Standard error |
t-statistics |
P-value |
||
|
Const |
8.724 |
0.736 |
11.849 |
< 0.0001 |
*** |
|
C |
0.021 |
0.014 |
1.025 |
0.096 |
* |
|
L |
0.231 |
0.047 |
4.874 |
< 0.0001 |
*** |
|
Average dependent variables |
11.652 |
Standard deviation of dependent variables |
1.751 |
||
|
Residual sum of squares |
94.785 |
Standard model error |
0.371 |
||
|
LSDV R-square |
0.959 |
Within R-square |
0.036 |
||
|
LSDV F (70, 688) |
231.082 |
Р-value (F) |
0.00000 |
||
|
Logarithmic plausibility |
-287.467 |
Akaike criterion |
716.934 |
||
|
Schwarz criterion |
1045.806 |
Hannan – Quinn criterion |
843.585 |
||
|
Rho parameter |
0.541 |
Durbin – Watson statistic |
1.561 |
||
|
Breusch – Pagan test statistics: LM = 3361.75; p-value = prob(chi-square(1) > 3361.75) = 0 |
|||||
|
Hausman test statistics: H = 4.73; p-value = prob(chi-square(2) > 4.73) = 0.093 |
|||||
|
Pesaran test for cross-sectional dependence (null hypothesis: no cross-sectional dependence): asymptotic test statistic: z = 23.086; p-value = 6.39Е-118 |
|||||
|
Note: hereinafter * – statistical significance at 10% level, ** – statistical significance at 5% level, *** – statistical significance at 1% level. Source: own compilation. |
|||||
The results of testing the main parameters of this model are shown in Table 3 . Regression coefficients, corresponding to the factors presented in the model, were statistically significant, as evidenced by low values of standard errors and P-values of the parameters. The model is characterized by a high level of approximation to the original data, since the coefficient of determination is very close to one (R2 = 0.96). In general, the model is statistically significant and reliable (F-significance has a value below 0.05), its accuracy is also confirmed by the Pesaran test for cross-sectional dependence in panel data. The constructed regression model showed that investments in fixed capital, attracted by enterprises, did not have a significant impact on livestock production volume in the municipal entities of the Sverdlovsk Oblast. However, a significant impact on this industry development in the municipal entities of the oblast had a significant impact on the cost of enterprises to develop their human resources.
According to this model, a 1% increase in investment in fixed capital attracted by enterprises contributes to the growth of livestock production in the region’s municipal entities by only 0.02%, while the same increase in resources allocated to the development of human resources, leads to an increase in production by 0.23%. This may be due to the fact that the wage fund formed by enterprises, has a significant impact on the attraction of employees to the industry, as the main centers of its development are small urban okrugs. Enterprises of this industry may already have significantly worn-out fixed capital assets, their renewal and modernization are required, but in the current conditions the resources, allocated by the enterprises to the development of human resources, are more important.
To assess the observed spatial effects in the dynamics of livestock production, not only from production factors on the territory of certain
Table 4. Spatial models of livestock production volume dependence on the volume of attracted investments by enterprises in the fixed capital and the cost of human resources development by the linear distance matrix by multistage GMM method
To confirm the reliability of the models, we conducted the Sargan – Hansen test (J-statistic), which checks the null hypothesis about the fact that the model is correct and all regression parameters are valid. The high P-value of the test allows us to accept the null hypothesis and conclude that the constructed models are valid. The Wald test confirmed the statistical significance of the regression coefficients, the Jarque – Bera test established the normality of the distribution of random errors in the model, and the Arellano – Bond test confirmed the absence of autocorrelation between them. The low level of the model’s standard error and the near-zero value of the constant, which characterizes the influence of other factors on the dependent variable, prove the importance of including the spatial lag in the regression model. The constructed models established the presence of positive spatial effects in the livestock industry development in the region, confirmed that the municipal entities that are surrounded by territories with active livestock industry development, will develop faster. Since this model contains a spatial lag of the dependent variable, the regression coefficients cannot be interpreted directly, they are not marginal effects, which in the usual model allow us to estimate the change in the dependent variable when the explanatory variable changes by one. We can only note, that the spatial effect established as a result of modeling, shows that the change in the volume of costs allocated by enterprises for the development of human resources, investment in fixed capital, directly affects the change in the volume of shipped livestock products in the municipal entity and indirectly on its change in neighboring municipal entities. The growth in the volume of shipped livestock products in a single municipal entity will contribute to the growth of this indicator in the surrounding territorial systems.
In this regard, for the formation of forecast scenarios for the livestock industry development, time series models were built from 2010 to 2020 for each municipal entity of the Sverdlovsk Oblast. They showed an even greater importance of the costs allocated by enterprises to the development of human resources in the industry development (Tab. 5).
Table 5. Results of the regression analysis of livestock production volume dependence in some municipal entities of the Sverdlovsk Oblast on attracted investments in fixed capital and wage fund of economic entities
|
Municipal entity |
Constant |
Volume of investments in fixed capital |
Wage fund for employees |
||
|
2 |
Reftinsky UO |
-7.772** |
-0.006 |
1.559*** |
|
|
Irbitskoye ME |
-4.313 |
0.302 |
1.055** |
||
|
Bogdanovich UO |
-6.727 |
0.314 |
1.133** |
||
|
Kamyshlovsky MD |
-13.97*** |
0.076 |
2.007*** |
||
|
ME city of Yekaterinburg |
2.563 |
-0.212 |
0.854*** |
||
|
Verkhny Tagil UO |
18.456 |
-0.066 |
1.107*** |
||
|
2 |
Talitsky UO |
-1.167 |
-0.121 |
1.155*** |
|
|
Sukhoy Log UO |
-11.085*** |
0.117 |
1.535*** |
||
|
Pervouralsk UO |
1.223 |
-0.007 |
0.798*** |
||
|
Gornouralsky UO |
5.314 |
0.027 |
1.014*** |
||
|
Kamensky UO |
-0.019 |
-0.126* |
1.124*** |
||
|
Sredneuralsk UO |
7.761 |
0.011 |
0.976*** |
||
|
Beloyarsky UO |
-2.979 |
0.041 |
1.118*** |
||
|
Baikalovsky MD |
-0.357 |
0.003 |
1.024*** |
||
|
Nizhny Tagil |
-31.444** |
2.628*** |
-1.465 |
||
|
Sysertsky UO |
1.995 |
-0.061 |
0.831*** |
||
|
Pyshminsky UO |
2.119 |
-0.089 |
0.932*** |
||
|
Artinsky UO |
6.251*** |
-0.002 |
0.544*** |
||
|
Alapaevskoe ME |
-0.954 |
-0.035 |
1.056*** |
||
|
Turinsky UO |
5.378* |
-0.077** |
0.461** |
||
|
Krasnoufimsky ME |
-15.722* |
-0.322 |
2.361*** |
||
|
Artemovsky UO |
0.493 |
-0.033 |
0.903*** |
||
|
CD 2 CD g |
Asbestovsky UO |
-44.895** |
1.078** |
2.624** |
|
|
Volchansky UO |
13.486 |
0.429*** |
0.439*** |
||
|
Nizhnyaya Salda UO |
-1.535 |
0.225** |
0.568*** |
||
|
Aramilsky UO |
9.417*** |
0.088** |
0.055 |
||
|
Pelym UO |
-6.643** |
0.106* |
1.074*** |
||
|
Staroutkinsk UO |
0.286 |
0.325* |
0.511*** |
||
|
Revda UO |
9.132 |
0.242* |
0.471* |
||
Source: own compilation.
In the main centers of this industry development, in Reftinsky UO, Irbitskoye UO, Bogdanovich UO, Verkhny Tagil UO, Kamyshlovsky MD and in the city of Yekaterinburg, as regression models show, the factor such as attracted investments in fixed capital by enterprises was statistically insignificant and had no effect on livestock production volume.
In addition, the regression coefficients characterizing the effectiveness of funds attracted by enterprises for the development of human resources are much higher than the value established by the panel model built for all municipal entities of the Sverdlovsk Oblast. In accordance with the models constructed, a 1% increase in the wage fund of employees in this industry in Reftinsky UO will contribute to livestock production growth by 1.56%, in Bogdanovich UO – by 1.13%, in Kamyshlovsky MD – by 2%.
A greater influence of this factor was also found in municipal entities with a level of livestock production concentration above the average for the Sverdlovsk Oblast, in particular in Sukhoy Log UO, Talitsky UO, Gornouralsky UO, Kamensky UO, Sredneuralsk UO, Beloyarsky UO, Krasnoufimsky ME. The exception in this group of municipal entities is Nizhny Tagil, where the factor, characterizing the volume of resources, attracted by enterprises for human resource development, had no impact on the livestock industry development, a significant impact had investments in fixed capital, attracted by enterprises.
In municipal entities with a low livestock production volume (below the regional average), investments in fixed capital attracted by enterprises had a more serious impact. If in the panel regression model, constructed for all municipal entities of the Sverdlovsk Oblast, the increase in investment in fixed capital by 1% contributed to livestock production growth by only 0.021%, then in the models constructed for the time series, in particular, for the Asbestovsky UO contributed to production volume growth by 1.1%, in the Volchansky UO by 0.43%, in Staroutkinsk UO by 0.33%, in Revda UO by 0.24% and in Nizhnaya Salda UO by 0.23%.
Thus, the regression analysis helped to establish a significant impact of resources, directed by enterprises to develop their human resources, on livestock production volume in the main centers (growth poles) of its development, and in municipal entities, which are able to form spatial clusters due to the build-up of close cooperative ties. Investments in fixed capital, as regression analysis on time series showed, is a key factor in the development of the industry in municipal entities with low production volume, which are located in the environment of growth poles and spatial clusters, are their zone of influence. The constructed Cobb – Douglas regression models and autoregressive modeling of the changes in the dynamics of the main factors in these models using the moving average (ARIMA) allowed us to form the most likely forecast scenarios of livestock production dynamics in the municipal entities of the region: inertial, assuming the preservation of the noted trends in the development of the industry in the future, optimistic and pessimistic (Tab. 6).
The inertial scenario forecasts a further moderate increase in livestock production volume in all municipal entities of the region, which has been observed over the past 10 years. In the first group of municipal entities, in the main centers of the livestock industry development in the region, by 2025, it is possible to increase production from 27,203 to 33,238 billion rubles, in the second group of municipal entities that differ in the production level above the average in the region, a more significant increase in production is possible: from
Table 6. Forecast scenarios of changes in the livestock industry production volume in the municipal entities of the Sverdlovsk Oblast by 2025 and the share of this product in the total volume of production in the region
|
Municipal entity |
Production volume in 2020 |
Inertial forecast scenario |
Pessimistic forecast scenario |
Optimistic forecast scenario |
||||
|
million rubles |
% of total volume in the region |
million rubles |
% of total volume in the region |
million rubles |
% of total volume in the region |
million rubles |
% of total volume in the region |
|
|
Reftinsky UO |
6,033 |
10.5 |
6,680 |
9.0 |
5,191 |
8.1 |
8,301 |
9.9 |
|
Irbitskoye ME |
5,610 |
9.8 |
6,202 |
8.4 |
4,910 |
7.7 |
7,501 |
8.9 |
|
Bogdanovich UO |
4,477 |
7.8 |
4,739 |
6.4 |
3,621 |
5.7 |
5,748 |
6.8 |
|
Kamyshlovsky MD |
4,351 |
7.6 |
8,399 |
11.3 |
7,829 |
12.2 |
8,989 |
10.7 |
|
ME city of Yekaterinburg |
4,329 |
7.5 |
5,265 |
7.1 |
5,237 |
8.2 |
5,292 |
6.3 |
|
Verkhny Tagil UO |
2,403 |
4.2 |
1,953 |
2.6 |
1,855 |
2.9 |
2,051 |
2.4 |
|
Total for the first group of MEs |
27,203 |
47.4 |
33,238 |
44.9 |
28,644 |
44.8 |
37,882 |
45.0 |
|
Talitsky UO |
1,889 |
3.3 |
2,145 |
2.9 |
2,068 |
3.2 |
2,221 |
2.6 |
|
Sukhoy Log UO |
1,797 |
3.1 |
2,507 |
3.4 |
2,350 |
3.7 |
2,669 |
3.2 |
|
Pervouralsk UO |
1,727 |
3.0 |
2,123 |
2.9 |
1,987 |
3.1 |
2,212 |
2.6 |
|
Gornouralsky UO |
1,638 |
2.9 |
2,713 |
3.7 |
2,438 |
3.8 |
2,955 |
3.5 |
|
Kamensky UO |
1,595 |
2.8 |
3,140 |
4.2 |
2,416 |
3.8 |
3,775 |
4.5 |
|
Beloyarsky UO |
1,388 |
2.4 |
1,516 |
2.0 |
1,327 |
2.1 |
1,657 |
2.0 |
|
Sredneuralsk UO |
1,358 |
2.4 |
1,970 |
2.7 |
1,790 |
2.8 |
2,115 |
2.5 |
|
Sysertsky UO |
1,343 |
2.3 |
2,286 |
3.1 |
1,847 |
2.9 |
2,716 |
3.2 |
|
Baikalovsky MD |
1,325 |
2.3 |
1,763 |
2.4 |
1,617 |
2.5 |
1,909 |
2.3 |
|
Nizhny Tagil |
1,306 |
2.3 |
2,098 |
2.8 |
652 |
1.0 |
3,839 |
4.6 |
|
Pyshminsky UO |
1,250 |
2.2 |
1,464 |
2.0 |
1,378 |
2.2 |
1,550 |
1.8 |
|
Artinsky UO |
1,218 |
2.1 |
1,540 |
2.1 |
1,441 |
2.3 |
1,605 |
1.9 |
|
Alapaevskoe ME |
1,208 |
2.1 |
1,580 |
2.1 |
1,406 |
2.2 |
1,753 |
2.1 |
|
Turinsky UO |
1,086 |
1.9 |
966 |
1.3 |
910 |
1.4 |
1,022 |
1.2 |
|
Artemovsky UO |
1,050 |
1.8 |
1,266 |
1.7 |
1,211 |
1.9 |
1,321 |
1.6 |
|
Krasnoufimsky ME |
1,044 |
1.8 |
1,737 |
2.3 |
1,682 |
2.6 |
1,792 |
2.1 |
|
Total for the second group of MEs |
22,222 |
38.7 |
30,815 |
41.6 |
26,523 |
41.4 |
35,111 |
41.7 |
|
Total for the rest of MEs |
7,968 |
13.9 |
10,038 |
13.5 |
8,827 |
13.8 |
11,146 |
13.2 |
|
Total for the Sverdlovsk Oblast |
57,393 |
100 |
74,090 |
100 |
63,993 |
100 |
84,139 |
100 |
|
Source: own compilation. |
||||||||
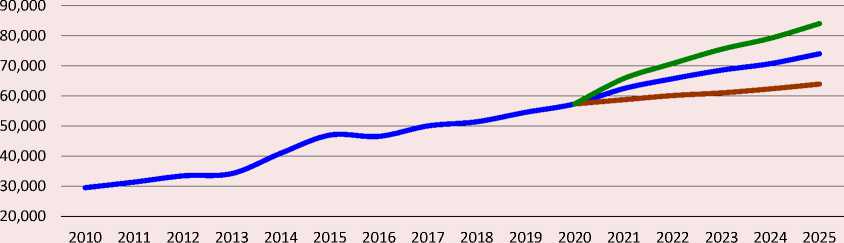
22,222 to 30,815 billion rubles. Less significant growth is expected in the third group of municipal entities, which are characterized by low rates of industry development: from 7,968 to 10,038 billion rubles. In general, in the Sverdlovsk Oblast, this scenario assumes the preservation of the established trend of growth in production (Fig. 3).
Even with the implementation of the pessimistic forecast scenario, due to a decrease in the volume of investments attracted by enterprises in fixed capital and the wage fund of employees in this industry in the municipal entities of the region, a slight increase in livestock production volume is expected (from 57,393 to 63,993 billion rubles by 2025). When
Figure 3. Forecast scenarios for changes in livestock production volume in the Sverdlovsk Oblast until 2025, million rubles
^^^^^*Inertial scenario < >Pessimistic scenario < Optimistic scenario
Source: own compilation.
constructing forecast scenarios, we did not take into account the dynamics of changes in inflation in the municipal entities of the region due to the unavailability of such data in official statistics. When taking it into account, it is more likely that more negative forecast scenarios for the livestock industry development in the municipal entities of the Sverdlovsk Oblast will be formed.
According to the pessimistic scenario, a decrease in livestock production volume by 2025 is expected in Reftinsky UO, Irbitskoye UO, Bogdanovich UO, Verkhny Tagil UO, that is, in the main centers of development of this industry. Only in two municipal entities of the first group, despite a possible reduction in investments attracted to the industry and funds for the development of human resources in enterprises, an increase in livestock production is expected: in the city of Yekaterinburg and in Kamyshlovsky MD. In these large municipal entities, a decrease in the amount of funds attracted by livestock enterprises for the development of human resources is least likely, and this factor, as shown by regression modeling, is the main factor in the development of the industry in these territorial systems.
A more significant increase in livestock production volume in the municipal entities of the second group compared to the first, which was established during the formation of the inertial forecast scenario, will have a positive impact on the dynamics of spatial heterogeneity of this industry development in the region. According to this scenario, the concentration level of livestock products produced in municipal entities of the first group may decrease from 47.4 to 44.9% of the total volume of output products in the region by 2025, and in the second group of municipal entities it may increase from 38.7 to 41.6%. The most likely decrease in the concentration of livestock products is in Reftinsky UO (from 10.5 to 9.0%), Bogdanovich UO (from 7.8 to 6.4%), Verkhny Tagil UO (from 4.2 to 2.6%) and Irbitskoye ME (from 9.8 to 8.4%). Among the municipal entities of the second group, an increase in the concentration of livestock products is possible in Nizhny Tagil (from 2.3 to 2.8% of the total volume of output products in the region), Gornouralsky UO (from 2.9 to 3.7%), Kamensky UO (from 2.8 to 4.2%), Sysertsky UO (from 2.3 to 3.1%) and Krasnoufimsky ME. The forecasted spatial redistribution of livestock production by 2025 within the framework of the inertial scenario is a positive direction for the further development of the industry, since it increases the food security of municipal entities, reduces their dependence on imports of meat and meat products. At the same time, the inertial and other forecast scenarios showed the deepening of the problems of this industry development in the municipal entities of the third group, which differ in livestock production volume below the average in the Sverdlovsk Oblast. According to the inertial forecast scenario, it is possible to reduce the concentration level of output products in these municipal entities from 13.9% in 2020 to 13.5% by 2025. This group includes 47 municipal entities of the region, and such a low level of concentration of goods produced in them testifies to their strong food dependence on other territorial systems and significant risks to their food security.
Conclusion
The methodological approach presented in the research, including spatial autocorrelation analysis, regression modeling based on panel data, spatial effects modeling and ARIMA modeling, makes it possible to comprehensively assess the spatial heterogeneity of the livestock industry development in municipal entities of the Sverdlovsk Oblast, to identify the factors that determine it, to take into account the influence of spatial effects and to build forecast scenarios for its development. The use of spatial autocorrelation analysis on various matrices of spatial weights, makes it possible to establish the main poles of growth, spatial clusters and zones of their influence.
As a result of testing the methodological approach, a trend was established that was associated with an increase in spatial heterogeneity of the livestock production, an increase in the level of its concentration in six municipal entities of the Sverdlovsk Oblast (Reftinsky UO, Irbitskoye ME,
Bogdanovich UO, Kamyshlovsky MD, the city of Yekaterinburg and Verkhny Tagil UO), where almost 50% of all livestock production in the region is concentrated. Moreover, the share of livestock products in these constituent entities increased 2–3fold over the period 2010–2020 (in Bogdanovich UO from 3.3 to 7.8%, in Kamyshlovsky MD from 2.6 to 7.6%), which indicates an increase in the degree of spatial heterogeneity of the industry development and an increase in the negative impact on the food security of the Sverdlovsk Oblast.
During the construction of the Cobb – Douglas model using panel data, it was revealed that the main factor contributing to the increase in the spatial heterogeneity of the development of the livestock industry in the municipal entities of the Sverdlovsk Oblast, which act as growth poles or form spatial clusters, is enterprises’ expenditures allocated to the development of human resources and employee remuneration. At the same time, the factor such as investments in fixed capital attracted by enterprises had a more serious impact on spatial heterogeneity in municipal entities whose volume of livestock production is low (below the average in the Sverdlovsk Oblast) and which are surrounded by growth poles and spatial clusters and are zones of their influence.
As a result of the study, trends in the spatial heterogeneity of the livestock industry in the municipal entities of the Sverdlovsk Oblast were established, factors that have a significant impact on it were identified, and regression models were constructed, which will help to develop mechanisms for levelling it in the future.
The results obtained can be used by public authorities to work out a policy, aimed at developing human resources and attracting investment resources for the development of the livestock industry in municipal entities of the Sverdlovsk Oblast.
References Forecasting the impact of investments on spatial heterogeneity in the development of the livestock industry
- Arkhipova M.Yu., Smirnov A.I. (2020). Current trends in crop yield forecasting based on the use of econometric models. Voprosy statistiki=Bulletin of Statistics, 27(5), 65–75. DOI: https://doi.org/10.34023/2313-6383-2020-27-5-65-75 (in Russian).
- Atikah N., Widodo B., Rahardjo S. et al. (2021). The efficiency of Spatial Durbin Model (SDM) parameters estimation on advertisement tax revenue in Malang City. Journal of Physics: Conference Series, 1821(1), 012012. Available at: https://doi.org/10.1088/1742-6596/1821/1/012012
- Augustine D.J., Booth D.T., Cox S.E., Derner J.D. (2012). Grazing intensity and spatial heterogeneity in bare soil in a grazing-resistant grassland. Rangeland Ecology & Management, 65(1), 39–46. Available at: https://doi.org/10.2111/rem-d-11-00005.1
- Bille A.G., Salvioni C., Benedetti R. (2015). Spatial heterogeneity in production functions models. International Conference of Agricultural Economists (ICAE) Agriculture in an Interconnected World, 16. DOI: 10.22004/ag.econ.211343
- Brovkova A.V. (2014). Improving methods of statistical analysis of socio-economic inequality and regional convergence in Russia. Vestnik Saratovskogo gosudarstvennogo sotsial’no-ekonomicheskogo universiteta, 2, 113–117 (in Russian).
- Bulteau J., Feuillet T., Le Boennec R. (2018). Spatial heterogeneity of sustainable transportation offer values: A comparative analysis of Nantes urban and periurban/rural areas (France). Urban Science, 2(1), 14. Available at: https://doi.org/10.3390/urbansci2010014
- Chikuvire T.J., Mpepereki S., Tigere T.A., Foti R. (2006). Exploitation of spatial heterogeneity for food security by smallholder farmers in a semi-arid area of Zimbabwe. Journal of Sustainable Development in Africa, 8(2), 15–28. Available at: http://jsd-africa.com/Jsda/Summer_2006/PDF/ARC_ExploitationSpatialHeterogeneityFoodSecurity.pdf
- Dubrova T.A. (2014). Applying multivariate statistical methods for analysis of the status and trends of the Russian meat market. Voprosy statistiki=Bulletin of Statistics, 8, 67–75. DOI: https://doi.org/10.34023/2313-6383-2014-0-8-67-75 (in Russian).
- Fang W., Huang H., Yang B., Hu Q. (2021). Factors on spatial heterogeneity of the grain production capacity in the major grain sales area in Southeast China: Evidence from 530 counties in Guangdong Province. Land, 10(2), 206. Available at: https://doi.org/10.3390/land10020206
- Gagarina G.Yu., Bolotov R.O. (2021). Valuation of inequality in the Russian federation and its decomposition using the Theil index. Federalizm=Federalism, 26(4)(104), 20–34. DOI: http:// dx.doi.org/10.21686/2073-1051-2021-4-20-34 (in Russian).
- Glazyrina I.P., Zabelina I.A., Klevakina E.A. (2010). Economic development and environmental impact disparities among Russia’s regions. Zhurnal Novoi ekonomicheskoi assotsiatsii=The Journal of the New Economic Association, 7, 70–88 (in Russian).
- Gorbatovskaya O. (2017). Factors and evaluation methods of territorial differentiation agricultural production. Agrarnaya ekonomika=Agrarian Economics, 6, 18–29 (in Russian).
- Han C., Wang G., Zhang Y. et al. (2020). Analysis of the temporal and spatial evolution characteristics and influencing factors of China’s herbivorous animal husbandry industry. PLOS ONE, 15(8), e0237827. Available at: https://doi.org/10.1371/journal.pone.0237827
- Khan A.A. (2020). Linking spatial patterns of livestock to the geographical variances in Turkey. Journal of Geography, 40, 109–117. Available at: https://doi.org/10.26650/JGEOG2019-0050
- Koç A.A., Lambert D.M., Bölük G. et al. (2017). A spatial analysis of the relationship between agricultural output and input factors in Turkey. New Medit, A Mediterranean Journal of Economics, Agriculture and Environment, 16(1), 11–17. Available at: https://newmedit.iamb.it/2017/03/15/a-spatial-analysis-of-the-relationship-between-agricultural-output-and-input-factors-in-turkey/
- Lv F., Deng L., Zhang Z. et al. (2022). Multiscale analysis of factors affecting food security in China, 1980–2017. Environmental Science and Pollution Research, 29(5), 6511–6525. DOI:10.1007/s11356-021-16125-1
- Malkina M.Yu., Balakin R.V. (2014). Valuation of the concentration and uniformity of the tax revenues distribution in the regions of the Russian Federation on the basis of the Herfindahl – Hirschman, Gini and Theil indices. Nalogi i nalogooblozhenie=Taxes and Taxation, 11(11), 1010–1023. DOI: https://doi.org/10.7256/1812-8688.2014.11.12546 (in Russian).
- Patrakova S.S. (2022). Assessing intraregional asymmetry of agricultural production in the Vologda Oblast. Problemy razvitiya territorii=Problems of Territory’s Development, 26(1), 27–42. DOI: 10.15838/ptd.2022.1.117.3 (in Russian).
- Pechenevskii V.F., Snegirev O.I. (2018). Forecasting accommodation and development of production of animal production in the region. Sovremennaya ekonomika: problemy i resheniya=Modern Economics: Problems and Solutions, 1(98), 75–84. DOI: https://doi.org/10.17308/meps.2018.1/1782 (in Russian).
- Piet L. (2017). Concentration of the agricultural production in the EU: The two sides of a coin. In: 15 European Association of Agricultural Economists (EAAE) Congress “Towards Sustainable Agri-Food System: Balancing between Markets and Society”, European Association of Agricultural Economists (EAAE). DOI: 10.22004/ag.econ.261439
- Postnikova E.A., Shiltsin E.A. (2009). Some fragments of the latest trends in regional development. Region: Ekonomika i Sotsiologiya=Region: Economics and Sociology, 3, 67–86 (in Russian).
- Shi B., Fu Y., Bai X. et al. (2021). Spatial pattern and spatial heterogeneity of Chinese elite hospitals: A country-level analysis. Frontiers in Public Health, 9, 710810. DOI: 10.3389/fpubh.2021.710810
- Shouying Y., Qiaoxi F. (2018). Spatial statistical analysis on geographical agglomeration of planting industry in Sichuan Province. In: Proceedings of the 2018 4th International Conference on Economics, Social Science, Arts, Education and Management Engineering (ESSAEME 2018). Advances in Social Science, Education and Humanities Research. Available at: https://doi.org/10.2991/essaeme-18.2018.16
- Sibhatu K.T., Steinhübel L., Siregar H. et al. (2021). Spatial heterogeneity in smallholder oil palm production in Indonesia: Implications for intervention strategies. International Conference of Agricultural Economists (ICAE 2021). Available at: https://ageconsearch.umn.edu/record/315222/files/0-0_Paper_19141_handout_301_0.pdf
- Suvorov N.V., Akhunov R.R., Gubarev R.V., Dzyuba E.I., Faizullin F.S. (2020). Applying the Cobb – Douglas production function for analysing the region’s industry. Ekonomika regiona=Economy of Region, 16(1), 187–200. DOI: 10.17059/2020-1-14 (in Russian).
- Tolmachev M.N. (2010). Methodology of calculating the concentration of agricultural production. Vestnik NGU. Seriya: Sotsial’no-ekonomicheskie nauki=Vestnik NSU. Series: Social and Economics Sciences, 10(2), 103–111 (in Russian).
- Wagle T.P.S. (2016). Spatial analysis of Cobb-Douglas production function in agriculture sector of Nepal: An empirical analysis. Journal of Advanced Academic Research, 3(2), 101–114. Available at: https://doi.org/10.3126/jaar.v3i2.16759
- Wenbo M., Weiteng T., Qian Zh., Qianqian M. (2021). Analysis on the temporal and spatial heterogeneity of factors affecting urbanization development based on the GTWR model: Evidence from the Yangtze River Economic Belt. Complexity, 2021, 1–11. Available at: https://doi.org/10.1155/2021/7557346
- Yang W., Jia H., Wang C. et al. (2022). Spatial heterogeneity of household food consumption and nutritional characteristics of grassland transects in Inner Mongolia, China. Frontiers in Nutrition, 9. DOI: 10.3389/fnut.2022.810485
- Zhang Y., Li B. (2022). Detection of the spatio‐temporal differentiation patterns and influencing factors of wheat production in Huang‐Huai‐Hai region. Foods, 11(11), 1617. Available at: https://doi.org/10.3390/foods11111617
- Zimin A.F., Timiryanova V.M. (2016). The spatial change of the indicators of consumer market. Vestnik UGUES. Nauka, obrazovanie, ekonomika. Seriya ekonomika=Вulletin USAES. Science. Education. Economy. Series: Economy, 1(15), 44–49 (in Russian).
- Zubarevich N.V. (2013). Population income inequality: Spatial correction. Pro et Contra, 17(6), 48–60 (in Russian).
- Zubarevich N.V., Safronov S.G. (2013). The inequality of social and economic development of regions and cities of Russia of the 2000s: Growth or decline? Obshchestvennye nauki i sovremennost’=Social Sciences and Contemporary World, 6, 15–26 (in Russian).
