Formation of inequality of Russia's population

Author: Kostyleva Lyudmila Vasilyevna
Journal: Economic and Social Changes: Facts, Trends, Forecast @volnc-esc-en
Section: Social development
Article in issue: 5 (23) т.5, 2012.
Free access
The article consistently reveals the process of formation of population’s socio-economic inequa- lity since the Soviet period up to the present. The author identifies and analyzes the factors that played the most important role in this connection, such as price liberalization, hyperinflation, privatization, the depreciation of savings, increase in wages differentiation, unemployment, the change of population’s income structure, development of shadow economy.
Inequality of population, stratification, gini coefficient, r/p 10% ratio (the ratio of the average income of the richest 10% to the poorest 10%)
Short address: https://sciup.org/147223383
IDR: 147223383 | UDC: 316.344.233(470.12)
Text of the scientific article Formation of inequality of Russia's population
Initially, Soviet society was created by ideologists as a socialist, i.e. classless society, but in 1934, at the 17th Congress of the Communist party in I.V. Stalin’s report “On the Draft Constitution of the USSR”, it was stated that two new social classes had been formed in the country: the working class and the kolkhoz peasantry and there was also a special social stratum of intelligentsia. Meanwhile, the higher status of the working class as compared with the peasantry and intelligentsia was emphasized. Differentiation in the incomes of classes and strata was explained by the differences in the contribution of individual workers in production, and also in the social experience and responsibility. Such a concept of the country’s social structure existed until the end of the 1980s. In fact, the model of “working class – peasantry – intelligentsia” concealed the system of implicit classes.
The views on Soviet society as a stratified one were developed by Soviet sociologists in the 1960s: the concept of society as a hie- rarchical structure was presented in the works of Yu. V. Arutyunyan, O.I. Shkaratan, L.A. Gordon, T.I. Zaslavskaya. The authors defined 8 – 10 socio-professional groups (“social strata”) differentiated by economic status, cultural level, value orientations and lifestyle, these are the factors which for the first time were declared the primary elements of the social structure of Soviet population. Stratification research of that time was carried out on the basis of the criteria traditionally used in Western sociology: the level of education, qualification, the essence of work, differences in income [13].
The next step in the study of the social structure of Soviet society is presented in the works of Bulgarian sociologist N. Tilkid-zhiyev, who highlighted the necessity of differentiation between social inequality and actual professional distinctions due to their different nature. N. Tilkidzhiyev noted that the socio-pro-fessional affiliation is a fundamental factor in the formation of the strata, but it is necessary to take into account the influence of such factors as social background, social relations, housing and dwelling conditions, institutional factor.
While describing social relations in the USSR, German sociologist W. Tekkenberg determined that social inequality in the Soviet society manifested itself mainly in the social position and prestige, and not in the different level of income, which is more typical of Western societies [13]. Indeed, the social differentiation of population in Soviet society was determined by such factors as unequal access to material and spiritual values, the existence of departmental health care institutions and children’s preschool facilities, etc. [11]. A set of social privileges to employees depended not only on the industry in which they worked, but also on the enterprise at which they worked.
A special stratum of population – the nomenklatura, formed by people holding various key administrative positions in all the spheres of activities: industry, agriculture, education, etc. enjoyed special privileges and benefits. Representatives of all social groups could join the nomenclature subject to two conditions: political loyalty and personal dedication to the leadership.The peculiarity of the USSR nomenclature consisted in a noncash remuneration of its service. The privileges included legally established right of use and disposal of state property. As O.I. Shkaratan points out, “the nomenclature of the USSR possessed, disposed of, enjoyed and appropriated the national wealth, although it was in many respects not formalized by legal norms” [13].
In the Soviet Union in the 1980s, the differentiation of population’s incomes as well as wages differentiation was insignificant: the decile coefficient of differentiation in 1989 was 2.99 [11]. Formation of wages and other types of income in the USSR was based on the centralized distribution and redistribution of money, goods, and free services and it was strictly controlled.
A significant role in implementing the incomes policy of the Soviet period was played by the social consumption funds (SCF): their share amounted to almost 30% of the total income of the population. SCF served as an important tool regulating the differentiation of citizens’ incomes: various cash payments and benefits provided at the expense of SCF were directed mainly to low-income families, students, people with disabilities, etc., increasing the level of welfare of certain population groups and thus reducing the differentiation of incomes. The system of distributional relations in the Soviet Union was aimed at reducing the income inequality of employees, which corresponded to the ideology advocating homogeneity of the society [6].
The breakdown of the nomenclature occurred in 1991, together with the collapse of the USSR. It was the beginning of transition to market economy from centralized economy with social ownership of the means of production, planned pricing and command and control administration system. Since 1992, the country launched a radical economic reform, the main components of which included prices liberalization, foreign trade liberalization, and privatization.
Strategic errors in the reforms of the old social relations and establishment of market relations were aggravated by the peculiarities of the economy: its monopoly, technological backwardness and asymmetry. As a result, the economy of that period was characterized by a very deep recession: according to official statistics, the volume of GDP in comparable estimation for the period from 1991 to 1997 reduced by about 40%.
The 1991 – 1992 liberalization of prices was accompanied by high inflation rates and multiple growth of population’s nominal incomes. However, the real incomes, due to the application of “shock therapy”, were reduced almost twice (fig. 1) . After a certain recovery in 1993 – 1994, the level of income had been decreasing until 1999.
Figure 1. Incomes of Russia’s population and their differentiation in 1991 – 1999
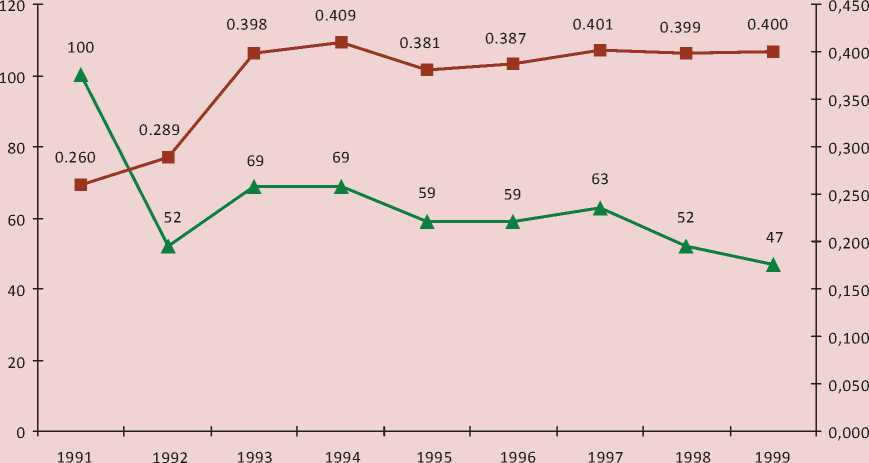
* Real disposable incomes of population, in % to 1991 — ■ — Gini coefficient
Table 1. Distribution of the total income of Russia’s population in 1991 – 1998, %
|
Population group |
1991 |
1992 |
1994 |
1996 |
1998 |
|
Monetary incomes, total |
100.0 |
100.0 |
100.0 |
100.0 |
100.0 |
|
Including 20% groups of population: |
|||||
|
first (with the lowest incomes) |
11.9 |
6.0 |
5.3 |
6.5 |
6.2 |
|
second |
15.8 |
11.6 |
10.2 |
10.9 |
10.5 |
|
third |
18.8 |
17.6 |
15.2 |
15.5 |
14.9 |
|
fourth |
22.8 |
26.5 |
23.0 |
22.4 |
21.0 |
|
fifth (with the highest incomes) |
30.7 |
38.3 |
46.3 |
44.7 |
47.4 |
|
Source: Statistical yearbook of Russia: Russian State Statistics Committee. Moscow, 2001. |
|||||
Along with the decrease in the average level of population’s income, the distribution of the overall volume of income in Russian society changed radically: in 1994, the value of the Gini coefficient increased more than 1.5-fold and in subsequent years, its level wasn’t changed significantly. The inequality of population’s incomes, which appeared as a temporary phenomenon, usually accompanying the reform processes, acquired a stagnant character in Russia.
If in 1991 the poorest 20% group of population accounted for 12% of the total monetary income, then to 1998 – for only 6%, while the share of income of the most prosperous group increased from 31 to 47%. It should be noted that the increase in the share of income was typical only for the fifth 20% group of population and the other four groups experienced its decline (tab. 1) .
The distribution of savings in the society was more uneven still. By the beginning of 2000, half of the poorest Russians (52%) owned only 1% of the total volume of savings, while 53% of savings was concentrated in the hands of 2% of the most well-off [11]. In many respects such situation has developed as a result of loosening price control in the beginning of 1992. Which happened without compensation on deposits in commercial banks and savings banks. The majority of Russians at that time lost all their savings.
According to many modern scientists, the chief reasons for the extremely uneven distribution of cash income among the population include privatization, as a result of which a considerable part of state property of the Russian Federation became private property. Privatization in Russia in the early 1990s was notable by its swiftness, wide scale, lack of institutional preparation and relevant legislation. The dispensation of property began in 1988 along with the introduction of the Law of the USSR “On a state-owned enterprise”, according to which the teams of employees became virtually independent from the state. Directors of the enterprises gained the rights of owners, and the responsibility for the efficiency of the activities remained with the state. Teams of employees obtained the right of redemption of enterprises which they leased. The process of “spontaneous privatization” (a euphemism) was launched in the country: property began to pass into the hands of those who used it. O.I. Shkaratan notes that “1988 – 1991faced the distribution of property to the nomenclature, which also retained its authority” [7, 13].
In 1992, open privatization began: in 1992 – its voucher stage, and since 1995 – the activities of loans-for-shares auctions. The established order of conducting privatization provided significant benefits to the heads of enterprises that had obtained their posts in the Soviet period: by using administrative pressure, they could achieve desired results of voting at shareholders’ meetings, and afterward buy out the share of the employees of the enterprises, thus becoming full-fledged owners. The depreciation of population’s savings only contributed to the distribution of large and medium state property to the heads of enterprises.
As Academician V.M. Polterovich points out, when voucher privatization started “... the country lacked entrepreneurs able to purchase enterprises, and managers, able to run them under free market conditions, market infrastructure was absent as well... Many enterprises were dozens and hundreds of times undervalued, so their future owners could anticipate huge profits” [13].
Advocates of the rapid implementation of privatization in Russia supported their position by pointing out the hopelessness of the situation. In fact, however, those were convenient circumstances promoting the easy and unpunished appropriation of the national wealth of the huge country by a small group of people. For the 1992 – 1999 period more than 133.2 thousand different enterprises and facilities were privatized, their overall value equaled just over 9 billion dollars, i.e. an average of 70 thousand dollars per each. They included metallurgical enterprises, mechanical engineering enterprises, processing enterprises of the oil and oil-refining industry. In comparison with other countries, both developed and developing, the amount of revenues received from privatization in Russia, proved extremely small. And this is not surprising: after all, the sales of companies at the auctions were effected at the prices dozens of times less than their real value. Thus, in the 1990 – 1998 period, as the result of privatization, Brazil has gained 67 billion dollars, the United Kingdom – 66 billion dollars, Italy – 64 billion dollars. As the result of privatization, Russia gained only 55 dollars per capita of population, while in Australia this figure equals 2,560 dollars, in Portugal – 2,109 dollars, in Italy and the United Kingdom – 1,100 dollars.
Privatization caused the transformation of state property into private property owned by a small group of people, all the main resources of the country were concentrated in the hands of the few. After a while, the majority of population lost their savings once again due to the 1998 financial crises, and the rich strengthened their welfare.
In addition to liberalization of prices, hyperinflation and privatization, the formation of inequality in the distribution of income among the population was affected by such processes as the increase in wages differentiation, emergence of secondary employment of population, development of entrepreneurship.
Transition to a market economy caused a rise in wage inequality in the majority of Eastern European countries. In some of them the growth was moderate, in others it was more significant. Russia, along with some other former Soviet republics (Armenia, Azerbaijan, Kyrgyzstan) was among the countries that experienced a considerable rise in wage inequality, and, as it was already noted, the increase of inequality occurred simultaneously with the landslide fall of the wages level.
In only three years, from 1990 to 1993, the Gini coefficient for wages in Russia increased from 27% to 46%, and in the following three years – to 48% (fig. 2) , which is comparable only to the level of differentiation in Latin American countries. Analyzing the information on the inequality of wages in transition economies, V.Ye. Gimpelson and R.I. Kapelyushnikov note that “...so far there is no country, in which the inequality of wages would decrease after the main phase of economic transformation was completed” [4].
Economists P. Aghion and S. Commander developed a theoretical model that reveals in the period of transition of an economy the interrelation between the variation of the wage level and the development of the private sector. First of all it happens because the employees are moving from the public sector with a fairly even distribution of wages to the private sector with a greater variation in wages distribution. The average wage in the private sector is higher than in the state sector due to higher labour productivity, which also increases the general inequality. The private sector is developing more intensively in the sphere of services, that is why the economy restructuring can be
Figure 2. Dynamics of the Gini coefficient for wages in Russia, 1990 – 2001
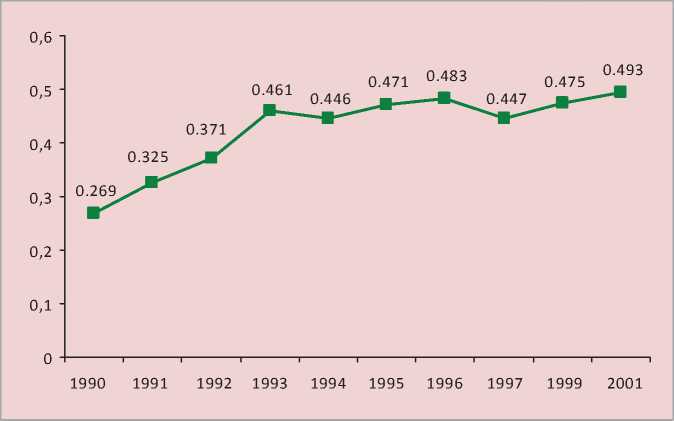
considered one of the factors increasing the differentiation of wages.
In the transition to market relations, the enterprises became distinguished by a different efficiency of activities, which also contributed to the increase in not only inter-sectoral differentiation of wages , but also in the differences within the same industry. Sectoral, inter-sectoral and inter-regional differences in wages were enhanced by the surge of inflation after prices liberalization. At that time inflation rates varied considerably in the regions, and in economic sectors [4].
The high degree of wages differentiation can also be explained by the delay in payment of wages, which acquired a large-scale character in the 1990s. At first, the duration of delays was measured in weeks, then – in months. In the second half of the 1990s, the delays of more than one year became common. Different branches of the economy were affected by this phenomenon in different ways. The coal enterprises of Vorkuta ranked first in the duration of delays: by the end of 1998 the wages there had not been payed for 10 – 12 months [5].
Wages were the main source of population’s incomes since the Soviet times, when remuneration for work was strictly regulated by the state: in the 1970 – 1980 USSR remuneration accounted for 75 – 80% of the total cash income. With the implementation of market transformations, the structure of population’s cash income has undergone significant changes due to the increase in the share of income from entrepreneurial activity and the share of property income (tab. 2) .
By 2000, incomes from entrepreneurial activity and property incomes accounted for almost a quarter of the total volume of incomes. At the same time they were typical only for one third of the population, this was also a factor of income inequality among Russians. Secondary employment, which emerged at that time and which was typical of about one fifth of the employees, enhanced the differences in incomes as well [11].
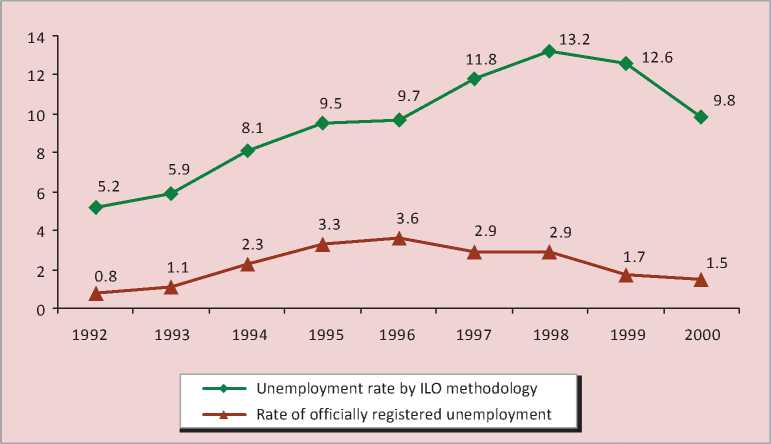
The process of transition to market relations facilitated the emergence of labour market, and the rapid increase of unemployment. By 1998, about 13% of the economically active population in the country, according to methodology of the International labour organization (ILO), had been unemployed (fig. 3) , and this indicator does not take into account hidden unemployment. Unemployment, along with the delays and non-payments of wages aggravated the financial position of numerous population groups, thus further increasing the gap between them.
It should be noted that shadow incomes also influence the formation of population inequality. In the shadow economy of the Soviet Union about 20 – 30 million people were constantly or occasionally engaged in speculation and theft [13]. With the beginning of establishing market relations, shadow economy began its development at the rate significantly exceeding that of the formal economy. According to expert estimates, its share in 1995 accounted for approximately 45% of the GDP of the Russian Federation.
Table 2. Structure of population’s monetary incomes in Russia in 1975 – 2000, %
|
Source |
1975 |
1980 |
1985 |
1990 |
1995 |
2000 |
|
|
1. |
Remuneration of labour |
80.7 |
79.8 |
77.2 |
76.4 |
62.8 |
61.4 |
|
2. |
Social transfers |
14.0 |
15.1 |
16.4 |
14.7 |
13.1 |
14.4 |
|
3. |
Entrepreneurial incomes |
2.7 |
2.2 |
2.7 |
3.7 |
16.4 |
15.9 |
|
4. |
Property incomes |
1.2 |
1.3 |
1.6 |
2.5 |
6.5 |
7.1 |
|
5. |
Other incomes |
1.4 |
1.6 |
2.2 |
2.7 |
1.1 |
1.2 |
|
Source: Statistical yearbook of Russia: Russian State Statistics Committee. Moscow, 2001. |
|||||||
Figure 3. Level of unemployment in Russia in 1990 – 2000, %
The bulk of shadow incomes concentrated in the hands of a small group of people, whose consumption level is comparable with that of the highest income groups of population in the richest countries, and that, no doubt, contributed to the increase in the indicators of income inequality of the country’s population [3].
The period since 2000 was characterized by political stability and sustainable economic growth, this had a positive impact on the level of population’s incomes as well. Per capita average cash income of the population in the Russian Federation increased as the result of the increase in the GDP volume (during this period there was a 2.8-fold increase). However, despite the positive dynamics, the population’s incomes, as compared on the international scale, remained at an extremely low level: in 2010, monthly wages of employees in Russia accounted for only 730 U.S. dollars, meanwhile this indicator in the United States was 3,705 U.S. dollars (2007) and in France – about 3,485 U.S. dollars (2006)1.
But average income growth indicators do not reflect the situation concerning the welfare of different population groups. In present-day Russia, despite the positive dynamics of the average cash incomes increase, social polarization and concentration due to the rapid growth of the highest incomes and salaries are not reduced, but continue to grow [9]. The distribution of cash incomes among the population of Russia is extremely uneven, as it is proved by all the indicators of the differentiation. According to Rosstat, the ratio of the average income of the richest 10% to the poorest 10% (R/P 10% ratio) equaled 16.5 times in 2010 (tab. 3) . This level is extremely high, while in Western European countries R/P 10% ratio does not exceed 10 points: the world experience shows that if the ratio of the incomes of 10% of the richest to 10% of the poorest exceeds 1:10, the country enters a stage of conflicts, and then – social disasters. That is, in this respect, Russia has gone far beyond the critical level [1].
According to the researchers studying the differentiation of population, the values of R/P 10% ratio do not reflect the real level of inequality in the society for several reasons.
Table 3. Distribution of the RF population’s overall monetary incomes in 1990 – 2010
|
1990 |
1995 |
2000 |
2005 |
2010 |
|
|
Monetary incomes – total, % |
100.0 |
100.0 |
100.0 |
100.0 |
100.0 |
|
Including by 20% groups: |
|||||
|
First (bottom) |
9.8 |
6.1 |
5.9 |
5.5 |
5.2 |
|
Second |
14.9 |
10.8 |
10.4 |
10.1 |
9.8 |
|
Third |
18.8 |
15.2 |
15.1 |
15.1 |
14.8 |
|
Fourth |
23.8 |
21.6 |
21.9 |
22.7 |
22.5 |
|
Fifth (top) |
32.7 |
46.3 |
46.7 |
46.7 |
47.7 |
|
R/P 10% ratio, times |
not available |
13.5 |
13.9 |
15.2 |
16.5 |
|
Gini coefficient |
not available |
0.387 |
0.395 |
0.409 |
0.420 |
|
Source: Russia in figures. 2011: concise statistical book. Rosstat. Moscow, 2011. |
|||||
-
1. Indicators of incomes differentiation are calculated on the basis of the Rosstat data, which are, in turn, based on budget statistics, and are therefore underrated: household surveys do not include the marginal groups of the society (7 – 10% of population according to sociologists) and super-rich people (5%) [10].
-
2. The level of inflation for the most and least well-off groups of population differs more than 2-fold [12].
-
3. When calculating R/P 10% ratio only the value of the officially registered incomes is taken into account, excluding shadow incomes (about 30 – 40% of funding), which are mainly concentrated in the hands of the wealthiest population groups.
That is why the real level of differentiation is not 17, but 25 – 30 times, which corresponds to the situation observed in Latin American countries. As the calculations of some researchers show, R/P 10% ratio for Moscow in 2009 was 42.7 [8]. Raw-material economy, similar to that of Russia, initially implies a very narrow circle of rich people and large groups of the poor. The transition to innovation model of the economy and profound reforms are necessary in order to change the situation radically [2].
In 2010, 20% of the richest citizens accounted for 47.7% of cash income, and 20% of the poorest – for only 5.2%.
As G.V. Anisimova2 points out, it causes the fragmentation of the social structure of the society into many strata and groups isolated from each other, the undermining of social solidarity, and ultimately, the ousting of certain categories of population from social life [1].
Some economic scientists believe that the moment when the bow of the Lorenz curve is bent to the fullest comes when the poorest 40% of the population receive less than 12 – 13% of total household incomes in the country. Such imbalance in the distribution of benefits usually arouses enormous discontent among the poor and can lead to socio-economic and even political consequences very undesirable for the country. It is noteworthy that in the Russian Federation according to the 2010 data, the two low quartile groups accounted for only 15% of the total income of the population.
According to 2011 data, the per capita income of 20% of the wealthiest Russians exceeded the subsistence level (SL) almost 8-fold, while the average income of the bottom population group equals only about 84% of the officially established indicator (tab. 4) .
Table 4. 2000 – 2011change of average per capita monetary income of the population of the Russian Federation in view of socio-economic groups
|
20% groups of population according to the income |
Average per capita monetary income, rub. |
Ratio to subsistence level, fold |
Ratio of 2011 incomes to 2000 incomes, % |
||
|
2000 |
2011 |
2000 |
2011 |
||
|
First (bottom) |
673 |
5330 |
0.56 |
0.84 |
7.9 |
|
Second |
1186 |
10150 |
0.98 |
1.59 |
8.6 |
|
Third |
1722 |
15280 |
1.42 |
2.40 |
8.9 |
|
Fourth |
2498 |
23175 |
2.06 |
3.64 |
9.3 |
|
Fifth (top) |
5326 |
48600 |
4.40 |
7.63 |
9.1 |
Sources: Statistical yearbook of Russia.2008. Rosstat. Moscow, 2008; Russia in figures. 2011: concise statistical book. Rosstat. Moscow, 2012.
In dynamics, the ratio of income to the size of the subsistence level is increasing, still in the upper groups – more rapidly than in the lower ones, due to the different rates of per capita income growth in the observed period. Current assessments show the 7.9-fold increase in the income of the first population group, the 9.1-fold increase in the income of the fifth population group.
As the result of the reforms in Russia, only 20% of the richest population (the fifth income group) received substantial benefit: their average incomes increased from 4.7 to 7.6 SL (fig. 4) . The representatives of the fourth and the third groups retained their welfare level. And the level of income and, accordingly, the living standard of the first and second groups with the lowest incomes decreased considerably. Moreover, more than half of the representatives of the first income group are below the absolute poverty line.
Recently, the gap between the rich and the poor has been constantly increasing throughout the world. According to the research “Inequality increases in spite of economic growth” conducted by OECD3 in 30 developed countries, Mexico, Turkey and the U.S. head the list of “troublesome” countries in this respect. The study shows that in Mexico the rich earn 25 times more than the poor, in the United States – 16 times more. At the same time, the average level of population incomes in these countries equals 1,000 dollars and 6,000 dollars, respectively.
According to experts, the most successful countries by this indicator are Denmark and Sweden, where the incomes of the rich only 5-fold exceed those of the poorest.
The standard gap between the population groups in OECD countries is considered to be the ratio of 1:9. Russia was not included in this rating because the study had been conducted among the OECD member states. At the same time, OECD analysts believe that our country, holding the leading position, is closest to Mexico regarding the gap between the incomes of the rich and the poor.
The 2008 global financial crisis had some impact on the incomes gap between the richest and the poorest, because it resulted in the decrease of the richest people’s incomes, which caused a certain reduction in R/P 10% ratio: if in 2007 and 2008 it was 16.8 times, then afterwards it experienced a downward trend – its value according to 2011 data, was 16.1.
The impact of the global financial crisis on the population inequality in the Vologda Oblast can be estimated on the basis of the structure of population and the assessment of their own incomes (tab. 5) .
Figure 4. Dynamics of ratios of per capita cash income to the subsistence level (SL) in the quintile groups (1 – 5) of the population of the Russian Federation in 1990 – 2010, fold
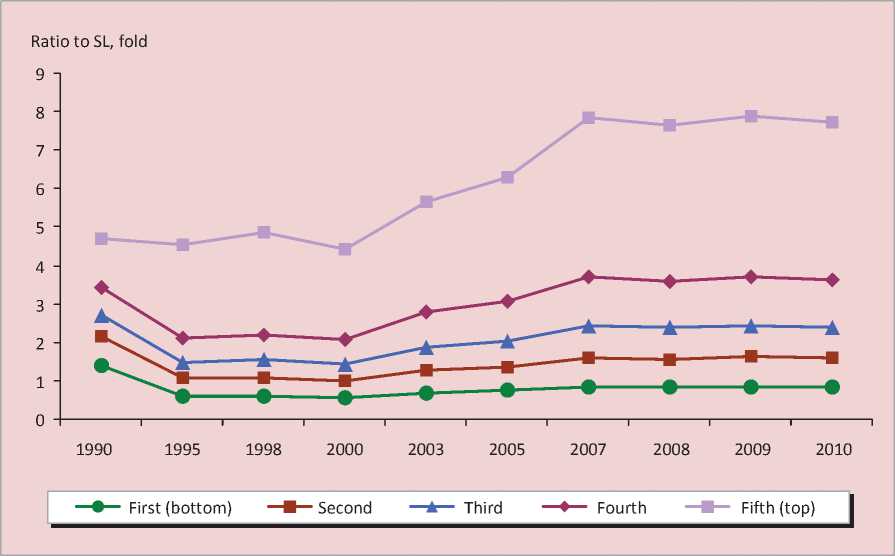
Table 5. Structure of the Vologda Oblast population according to the assessment of their own incomes in 2000 – 2011 (in % of the total number of respondents)
|
Year |
Population groups according to the assessment of their own incomes |
||||
|
Extremely poor |
Poor |
With low income |
Well-off |
Rich |
|
|
2000 |
15.9 |
46.4 |
31.2 |
4.1 |
1.4 |
|
2001 |
14.0 |
43.8 |
32.0 |
6.0 |
2.1 |
|
2002 |
12.8 |
40.7 |
35.1 |
6.1 |
3.1 |
|
2003 |
12.6 |
38.8 |
36.7 |
7.8 |
2.4 |
|
2004 |
9.6 |
35.9 |
41.7 |
6.9 |
2.3 |
|
2005 |
6.3 |
34.7 |
46.7 |
8.6 |
1.4 |
|
2006 |
4.3 |
34.4 |
47.9 |
9.4 |
1.6 |
|
2007 |
3.8 |
31.1 |
50.1 |
10.9 |
2.3 |
|
2008 |
3.4 |
13.6 |
62.7 |
17.5 |
2.1 |
|
2009 |
6.1 |
34.3 |
52.2 |
6.3 |
1.1 |
|
2010 |
5.1 |
30.3 |
51.6 |
11.1 |
1.7 |
|
2011 |
3.5 |
28.8 |
53.2 |
11.7 |
2.1 |
|
Source: 2000 – 2011 ISEDT RAS sociological surveys data |
|||||
Judging by the 2009 assessments, it should be noted that the structure of population became similar to that of 2005, when about 38% of the region’s population could be defined as “poor” and “extremely poor”. The amount of the poor changed most significantly (from 14% to 34%), due to the transition to this group of those who had been considered low-income residents. The crisis reduced the share of the well-off and the rich from 20% to 7%.
In 2010 – 2011, the situation began to level off, and first of all the share of the rich was recovered. However, according to our estimates, it will take not less than two years to restore the pre-crisis structure of the population.
Thus, population’s incomes inequality, which had been strictly regulated and controlled in the Soviet times, started to increase rapidly with the transition to market relations. Two main stages of the formation of inequality in Russian society can be pointed out. The first stage encompasses the period from 1990 to 2000. At this time the main factors determining inequality were the liberalization of prices, hyperinflation, privatization, the depreciation of savings, increase in wages differentiation, unemployment, the change of population’s income structure and the development of shadow economy. Having emerged as a temporary phenomenon that accompanied the reform processes, the inequality of Russian population acquired stagnant character.
The second stage, from 2000 up to the present time, is characterized by a considerable increase in the incomes of the richest 20% of the population. The inequality has been somewhat reduced because of 2008 financial crisis that led to the decrease in the incomes of the upper population groups.
The danger of the situation lies not only in the negative impact of inequality on the psychological climate of the society. The point is that the high degree of inequality hampers economic development, negatively influences the demographic indicators and reduces the quality of human capital, which is inadmissible in the conditions of modernization of the economy.
References Formation of inequality of Russia's population
- Anisimova G.V. Socio-economic inequality. Trends and mechanisms of regulation: monograph. Moscow: UNITY-DANA, 2010.
- Bogomolova T.Yu., Tapilina V.S. Poverty in modern Russia: the scope and territorial differentiation. ECO. 2004. No. 11. P. 41 -56.
- Vartanova I.S. Differentiation of population incomes in the conditions of transition to the market. Ph.D. in Economics thesis summary. Moscow, 2000.
- Wages and salaries in Russia: evolution and differentiation. Ed. by V.Ye. Gimpelson, R.I. Kapelyushnikov. Moscow: Publishing house HSE, 2007.
- The history of the miners’ movement in Vorkuta in the 1990s. Available at: http://www.uran.donetsk.ua/~masters/2002
- Kislitsyna O.A. Inequality in incomes and health in modern Russia. Doctor of Economics thesis summary. Moscow, 2006.
- Mau V. Russian economic reforms as viewed by their Western critics. Voprosy ekonomiki. 1999. No. 11, 12.
- Modernization and economic security of Russia.Vol.1. Ed. by academician N.Ya. Petrakova. Moscow: Publishing house “Finances and credit”, 2009.
- Poverty reduction, promotion of employment and local economic development in the North-West Federal district of the Russian Federation: report within the framework of the ILO project. Moscow, 2004.
- Rimashevskaya N.M. Two Russias -social polarization of Russian society. Fair and unfair social inequality in modern Russia. Moscow: Referendum, 2003.
- Rimashevskaya N.M. Economic stratification of the population in Russia. Society and economics. 2002. No. 12. P. 6 -14.
- Shevyakov A.Yu. The most important Russia’s social problems and ways of their solution. Federalizm. 2011. No. 2 (62). P. 25 -34.
- Shkaratan O.I. Socio-economic inequality and its reproduction in modern Russia. Moscow: CJSC “OLMA Media Group”, 2009.
