Frequency of cardiovascular risk factors among the population of Ferghana valley
Автор: Atakhanova Nilufar Sayibjonovna
Журнал: Re-health journal.
Рубрика: Внутренние болезни
Статья в выпуске: 2,3 (6), 2020 года.
Бесплатный доступ
In the article analyzed frequency of cardiovascular risk factors according to patients’ gender and number of risk factors. Results showed, that, every second men and women had arterial hypertension, overweight/obesity. Smoking became as the main risk factor in men and was revealed in 70,9% (p=0,0001). Among residents of Fergana valley 84,3% men and 41,9% women had 3 and more risk factor (p=0,0001). Amount of the cardiovascular risk factors increased according to age of people.
Isk factors, cardiovascular disease, smoking, overweight, xatar omillari, yurak qon tomir kasalligi, chekish, semizlik
Короткий адрес: https://sciup.org/14125441
IDR: 14125441 | DOI: 10.24411/2181-0443/2020-10074
Текст научной статьи Frequency of cardiovascular risk factors among the population of Ferghana valley
Actuality of the theme. Atherosclerosis with its basic clinical manifestations keeps leading in structure of illness and death. At the same time in last years achieved high advances in decreasing of cardiovascular death in many developed countries. In experts’ judgment, this effects show introduction of atherosclerosis primary prophylaxis rules, healthy life-style, basic principles of conclusive medicine and so results of polycentric clinical researches [1].
Disease of cardiovascular system is one of actual problems of healthcare of Republic of Uzbekistan. Analysis of mortality reasons showed, that death-rate from CVD staying as prevalent in structure of total mortality, it made 56% (79120 per.) in 2005, and 59,3% (79239 per.) in 2009 years [2]. Comparative analysis of mortality rate from CVD among people able-bodied age (to 100 thousand able-bodied populations in age of 2564 years, in a year) show, that Uzbekistan among countries of CIS takes 8th place (among women 121,3 and among men 220,7 to 100 thousand able-bodied populations). Although, mortality substantially lesser than Russian Federation (among women 241,9 and among men 762,8), Kazakhstan (252,2 and 672,3), Ukraine and Belorussian, but more than European countries, such as Germany, France, Sweden and others (37 and 107,4 etc.) [3].
Important aspect of CVD prophylaxis is detection of persons with disturbance of lipids’ metabolism and without clinical symptoms of IHD. Estimation of individual fatal risk, so possibility of death from IHD, peripheral atherosclerosis and stroke on persons without clinical symptoms of enumerated diseases in 10 years takes on table of Systemic Coronary Risk Evaluation (SCORE). Is shown that, decrease of a level such powerful risk factors (RF) such as, hypercholesterolemia (HChE) and arterial hypertonia (AH) - leads to significant (to 20-40%) reduction of total death from CVD [4].
Aim of the research was to study the frequency of CVD RF, such as smoking, AH, HChE men and women in different age.
Materials and methods of the research. The object of study is based on 382 patients, in the age of 25-69 years, which haven’t clinical signs of atherosclerosis. Performed one-timely patient examination, with method of random sample and filling specially prepared questionnaire.
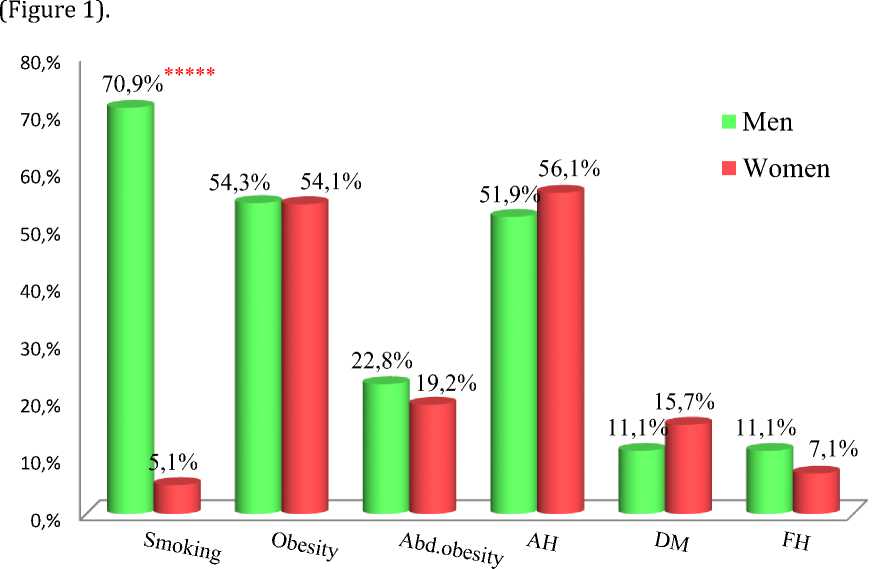
Results and discussion. Examined 382 patients: 33.2% (127 per.) of them men and 66.8% (255 per.) women (p˂0,0001). Results of the study showed, that among examined patients smoking was revealed in 70.8% men (90 per.) and 5.1% (13 per.) women. Overweight/obesity and AH revealed approximately in equal parts, in 55.1% (70 per.) and 51.9% (66 per.) men, and in 54.1% (138 per.) and 56.1% (143 per.) women, accordingly

Figure 1. Frequency of risk factors in men and women.
Note: ***** - P < 0,0001.
Overweight/obesity and AH revealed approximately in equal parts, in 55.1% (70 per.) and 51.9% (66 per.) men, and in 54.1% (138 per.) and 56.1% (143 per.) women, accordingly.

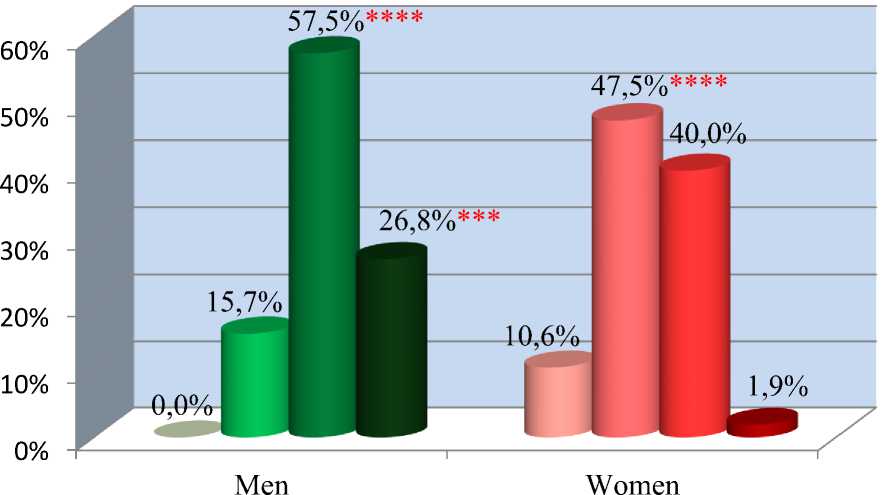
■ 0 ■ 1-2 13-4 ■■>5
Figure 2. Association of risk factors according to gender.
Analyze of RF (age, gender, smoking, abdominal obesity, AH, DM, HChE and family history of premature CVD) showed, that 10.6% (27 per.) of women were had no one RF. 1-2 RF were had in 15.7% (20 per.) men and reliably often in women 47.5% (121 per.) and was reliable (p˂0,001) (Figure 2).
Combination of 3-4 RF had 57.5% (73 per.) men and 40% (102 per.) women (p˂0,001), 5 and more RF revealed on 26.8% (34 per.) and 1.9% (5 per.) men and women (p˂0,005), accordingly.
Conclusion.
-
1. Every second men and women had AH, overweight/obesity. Smoking became as the
main RF in men and was revealed in 70.9% (p˂0,0001).
-
2. Among residents of Fergana valley 84.3% men and 41.9% women had 3 and more
RF (p˂0,0001), amount of which increased according to age.
Список литературы Frequency of cardiovascular risk factors among the population of Ferghana valley
- Бойцов С.А. Структура факторов сердечно-сосудистого риска и качество мер их профилактики в первичном звене здравоохранения в России и в Европейских странах (по результатам исследования EURIKA). // Кардиоваскулярная терапия и профилактика. - 2012. - №11(1). - С.11-16.
- Курбанов Р.Д., Уринов О. Профилактика основных факторов риска основа снижения смертности от сердечно сосудистых заболеваний. uzssgzt.uz 08.02.2016.
- Эпидемиологический надзор факторов риска неинфекционных заболеваний STEPS ВОЗ: http://www.who.int/steps 2014.
- European Society of Cardiology/ European Atherosclerosis Society Guidelines for the management of dyslipidaemias. The Task Force for the management of dyslipidaemias of the European Society of Cardiology (ESC) and the European Atherosclerosis Society (EAS). Atherosclerosis 2011; 217S: S1-S44.
- The European health report 2012: charting the way to well-being Full report (http://www.euro.who.int/en/what-we-do/data-and-evidence/-european-health-report- 2012) 0% 10% 20% 30% 40% 50% 60% Men Women 0,0% 10,6% 15,7% 47,5%**** 57,5%**** 40,0% 26,8%*** 1,9% 0 1-2 3-4 >5.


