From the demographic dividend to population ageing: world trends in the system-wide transition

Author: Barsukov Vitalii N.
Journal: Economic and Social Changes: Facts, Trends, Forecast @volnc-esc-en
Section: Ocial development
Article in issue: 4 (64) т.12, 2019.
Free access
In the 21st century, the increasing intensity of quantitative and qualitative demographic changes is becoming one of the most important factors that determine the direction of socio-economic development. Global downward trends in the birth and death rates have created conditions for the demographic system to shift to a new qualitative state. Humanity is at the crossroads of a transition between two phenomena it has not witnessed before: demographic “window” and population ageing. Under the circumstances, the research on the factors and implications of this system-wide transition is becoming increasingly important, because obtaining relevant information about the actual and forecast states of the demographic system is one of the key tasks of strategic planning for sustainable development. In this regard, the goal of the present research is to study the patterns, characteristics and driving forces of transition of the world population from the stage of realization of the demographic dividend to the stage of ageing. In our research we use fundamental works of foreign and domestic scientists and United Nations and World Bank statistics. In the first part of the article we consider approaches to the term “demographic dividend” and its conceptual substantiation, drivers of its formation and options to implement the demographic window. The second part of the paper presents the results of testing the methodology for determining the degree of implementation of the demographic dividend and the transformation of the age structure towards its ageing. We conclude that in the countries that are implementing the catching-up development model (from both the economic and demographic points of view; the “yellow group”) the intensity and depth of the implementation of the demographic dividend is significantly higher than in the countries that have already completed it (mainly developed countries - the “red group”). At the same time we argue that the width of the demographic window of opportunity is directly proportional to the scale of potential impact of population ageing, which inevitably follows the stage of the dividend implementation.
Demographic dividend, population ageing, system-wide transition
Short address: https://sciup.org/147224194
IDR: 147224194 | UDC: 314 | DOI: 10.15838/esc.2019.4.64.11
Text of the scientific article From the demographic dividend to population ageing: world trends in the system-wide transition
Introduction. In the last two thousand years planet’s population has grown up, according to different sources [1; 2], 25–50 times (from 150–300 million to 7.5 billion people). But the biggest increase happened in the second half of the 20th century, when world’s population grew by 4.5 billion people. It is important to understand that increase rates in different regions of the world were different (Fig. 1) .
It is possible to see in the figure that demographic map of the world significantly changed in the last 65 years: a share of the European population in general structure has decreased more than by 50%, while the African population increased by 7%. According to the average variant of UN forecast, by 2100 changes in the structure of world’s population will be even more significant: more than 80% of whole world’s population will be living in Asia and Africa. The latter, at the same time, will become the only region with the number of population constantly growing at an accelerated rate (by 2100, 40% of people on Earth will be living in Africa; now 16% of global population live there).
Moreover, in the 20th century quantitative changes of the demographic system were followed by its qualitative transformations [3; 4]. Global trends of declining birth rates and mortality created absolutely unique situation for planet’s population, when age structure, which remained almost completely unchanged in in the previous centuries, started to rapidly change which led to the reduction of proportion of younger population and parallel increase of able-bodied and elderly population. The
Figure 1. Structure of world’s population (1950–2100): fact and forecast, %
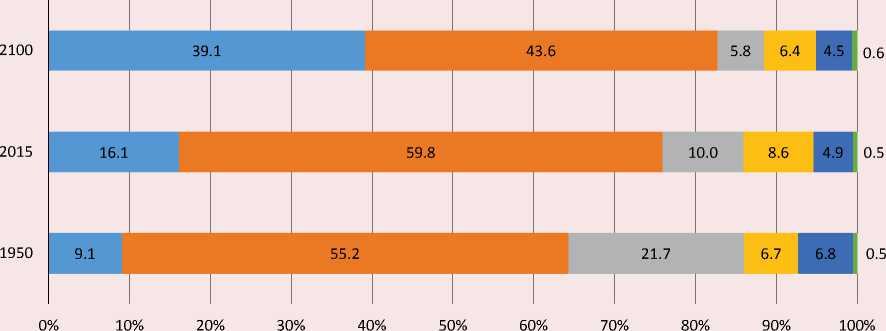
■ Africa ■ Asia ■ Europe ■ Latin America ■ North America ■ Oceania
Source: according to World Population Prospects data: the 2015 revision. Available at:
enormous growth of the population number and the change in its age structure has become one of the main factors and drivers of socioeconomic development. It is difficult to overestimate the impact of demographic changes on economic processes. For example, as M. Yuselius’ [5] research shows, the effect of population’s age structure explains the main part of trend inflation and has the following pattern: increase of the share of able-bodied population causes its decrease, while increase of the share of children and elderly population causes its increase. From the point of view of economic theory it is difficult to explain a connection between demographic and monetary phenomena. However, history proves that post-war “baby boomers” era, or developed countries’ ageing population in the 21st century, significantly impacted the average speed of prices’ raise in the same period. But the effect of age structure can positively influence economic development if local territory enters the stage of the “demographic dividend” (DD) implementation.
The problem of interconnection between the age structure transformation and economic growth is represented in one of the most actively developing directions of economic theory – “economics of generations”. The term “demographic dividend” is in the center of this concept, and it became one of the primary terms in socio-demographic studies [6]. New approaches toward its evaluation and the evaluation of support coefficients, taking into account age features of income and consumption, were developed within the system of national transfer accounts [7]. In fact, economics of generations receives: 1) social institutes and economic mechanisms through which generations or age groups produce, consume, rearrange and save resources; 2) economic flows between generations of age groups; 3) explicit and implicit contracts, which manage intergeneration’s flows; 4) income and consumption of separate generations and age groups [8].
The emergence of “demographic window” becomes possible in certain conditions of the age structure when, as a result of a rapid birth rate decrease, the share of able-bodied population tends to some maximum, and the share of kids and elderly people – to minimum. The stage of implementation of demographic dividend is reviewed as the period of economic “favor”, and the efficiency of “demographic bonus” usage largely determines further socioeconomic development of the country.
The term “demographic dividend” can be interpreted from different points of view:
-
1. Demographic : DD is a state of population’s age structure when, as a result of a birth rate decrease, the share of able-bodied population tends to some maximum and the share of dependency groups – to minimum.
-
2. Economic: period of DD implementation is reviewed as the time of economic favor: the share of able-bodied people and consumption rates increase, savings decrease, and the loading on state budget and pension funds reduces.
-
3. Social: implementation of DD is inevitably followed by the change of social space, characterized by changes in the structure of social values and norms.
In general, as the experience of developed countries shows, the period of implementation of demographic dividend positively affects countries’ economic development [9]. Today we can say that many Asian countries finish implementation of DD but, unlike the West, its economic effect is traced more clearly. Thus, for example, some researchers connect “economic miracle” of Japan and four Asian “tigers” (South Korea, Singapore, HongKong, Taiwan) to growth of the share of their able-bodied population in the second half of XX century [9]. Still, in some cases this phenomenon can lead to negative consequences. In particular, A. Korotaev and Yu. Zin’kina, while reviewing the role of impact of so-called “youth bulge” (increasing amount of young people in a total number of population) on revolutionary events in Egypt in 2011 [10], сome to the conclusion that the very transformation of population’s age structure played a major part in country’s political situation destabilization.
Thereby, the entry into the stage of DD implementation does not guarantee that the state automatically receives economic dividends, because there should be starting socioeconomic conditions for effective usage of “demographic bonus”. If the country is not ready for consequences of population’s age structure transformation, there might be some crisis manifestations in the economy (for example, unemployment growth) leading to destabilizing effects in other spheres of social life (Fig. 2) .
Effective DD implementation primarily determines a degree of the state readiness for the transition to “old” age structure. If it is possible to provide productive employment for the most part of the population during this period, so increase rates of per capita incomes significantly accelerate which, in perspective, leads to sustainable increase of economic growth [11]. The period of demographic dividend implementation and, respectively, emerging “window” could differ: in particular, in developed countries, where ageing of population started noticeably earlier, timing opportunities for DD implementation and carrying out of reforms to neutralize consequences were wider than in modern developing countries, where the process of age structure transformation happened much more intensively. Thus, effective implementation of demographic dividend allows creating favorable conditions for transition to the stage of ageing population and neutralizing its consequences.
Under certain circumstances, the emergence of the second dividend is possible even
Figure 2. Variants of demographic dividend implementation
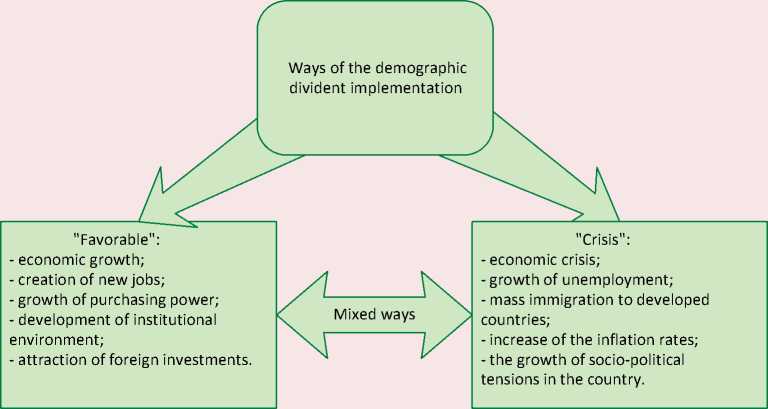
Source: own compliation.
after the implementation of “demographic bonus” [11]. Increase in the number of elderly people causes additional demand for certain types of resources, necessary for sustaining consumption at the same level. However, in the current moment, most countries have not yet completed the implementation of the first demographic dividend, which actualizes the studies of the features, patterns, and the possibilities, as well as consequences, of this process for the development of states.
The methodology of the research. Demographic dividend is a potential of economic growth which could be caused by the change of population’s age structure. First of all, situation when the share of able-bodied population (from 15 to 64) exceeds the share of non-working age population (below 14 – above 65) [12]. In this study, the methodology of determining the entry, implementation and completion of the demographic dividend stage is based on the usage of the demographic load indicator by the non-working population under 14 and over 65 years on the able-bodied population aged between 15 and 64 years. The application of age limits allows, to some extent, neutralizing the imbalance in terms of differences of the retirement age borders, on the one hand, and, on the other hand, to consider earlier access to the labor market of the population from some developing and least developed countries.
Formally, situation of demographic “window” appears in the moment of birth rate decrease and increase of the share of ablebodied population. However, the difference between relation of unproductive and productive population, for example, in the proportion 1 to 1 or 1 to 2 is quite large in terms of defining degree of positive economic effect for the state. In a number of works [13–17] authors point out that the period of demographic dividend implementation in the economic meaning is much shorter than in demographic, i.e. it extents for short periods of time when the share of able-bodied population not just grows, but reaches its maximum historical values. Thus, in our study, the period of demographic dividend implementation is understood as the state of the age structure, when the proportion of unproductive groups to productive population is 1 to 2 or lower (i.e. the loading of unproductive population is less than 500 per mille, and the share of population between 15 and 64–66.6% or higher).
Based on the suggested methodology, the countries of the world could be divided in the following groups:
-
1. Countries which finished demographic dividend implementation: the coefficient of demographic loading exceeds 500 per mille and tends to grow; the proportion of population aged between 15 and 64 has already reached its maximum values, has fallen below 66.6%, and has a steady decrease trend (conditionally referred to as “the red group”).
-
2. Countries which are at the intermediate stage of demographic dividend implementation: the coefficient of demographic loading is below 500 per mille; the proportion of population aged between 15 and 64 exceeds 66.6%, having, at the same time, a tendency to its decrease or growth (conditionally referred to as “the yellow group”).
-
3. Countries which did not enter the stage of demographic dividend implementation : the coefficient of demographic loading is above 500 per mille, but tends to decrease; the proportion of population aged between 15 and 64 tends to grow but it has not yet reached 66.6% (conditionally referred to as “the green group”).
It should be noted that the methodology, used to determine the degree of demographic dividend implementation, allows splitting of the
Table 1. Demographic dividend implementation in the regions of the world
Region Countries which finished demographic dividend implementation, or countries of the early transition (“the red group”) Countries which are at the intermediate stage of dividend implementation (“the yellow group”) Countries which are in the late stage of demographic dividend (“the green group”) Africa – Mauritius, Seychelles, Algeria, Libya, Tunisia, Western Sahara (total – 6) Burundi, Comoros, Djibouti, Eritrea, Ethiopia, Kenya, Madagascar, Malawi, Mayotte, Mozambique, Reunion, Rwanda, Seychelles, Somalia, South Sudan, Uganda, Tanzania, Zambia, Zimbabwe, Angola, Cameroon, Central African Republic, Chad, Congo, Democratic Republic of the Congo, Equatorial Guinea, Gabon, Sao Tome and Principe, Algeria, Egypt, Libya, Morocco, Sudan, Tunisia, Western Sahara, Botswana, Lesotho, Namibia, South Africa, Swaziland, Benin, Burkina Faso, Cape Verde, Cote d’ivoire, Gambia, Ghana, Guinea, Guinea Bissau, Liberia, Mali, Mauritania, Niger, Nigeria, Senegal, Sierra Leone, Togo (total – 57) Asia Japan, Sri Lanka, Georgia (total – 3) China, Hong Kong, Macau, Taiwan, North Korea, Japan, Mongolia, South Korea, Uzbekistan, Bangladesh, Bhutan, India, Iran, Maldives, Brunei, Indonesia, Malaysia, Myanmar, Singapore, Thailand, Vietnam, Armenia, Azerbaijan, Bahrain, Cyprus, Kuwait, Lebanon, Oman, Qatar, Saudi Arabia, Turkey, United Arab Emirates (total – 32) Afghanistan, Kazakhstan, Kyrgyzstan, Tajikistan, Turkmenistan, Pakistan, Nepal, Cambodia, Laos, Philippines, East Timor, Iraq, Israel, Jordan, Palestine, Syria, Yemen (total – 17) Europe Bulgaria, Czech Republic, Hungary, Poland, Romania, Russia, Ukraine, channel Islands, Denmark, Estonia, Finland, Iceland, Ireland, Latvia, Lithuania, Norway, Sweden, UK, Croatia, Greece, Italy, Malta, Montenegro, Portugal, Serbia, Slovenia, Spain, Austria, Belgium, France, Germany, Netherlands, Switzerland (total – 33) Belarus, Moldova, Slovakia, Albania, Bosnia and Herzegovina, Macedonia, Luxembourg (total – 7) – Latin America and the Caribbean Barbados, Curacao, virgin Islands (total – 3) Antigua and Barbuda, Aruba, Bahamas, Cuba, Jamaica, Puerto Rico, Santa Lucia, Saint Vincent and the Grenadines, Trinidad and Tobago, Costa Rica, Mexico, Brazil, Chile, Colombia, Suriname (total – 15) Dominican Republic, Grenada, Guadeloupe, Haiti, Martinique, Belize, El Salvador, Guatemala, Honduras, Nicaragua, Panama, Argentina, Bolivia, Ecuador, French Guiana, Guyana, Paraguay, Peru, Uruguay, Venezuela (total – 20) North America Canada, USA (total – 2) – – Oceania Australia, New Zealand (total – 2) New Caledonia, French Polynesia (total – 2) Fiji, Papua New Guinea, Solomon Islands, Vanuatu, Guam, Kiribati, Federated States of Micronesia, Samoa, Tonga (total – 9) Source: own calculations according to World Population Prospects data: the 2015 revision. Available at: selected groups into more private ones. For example, in the red group it is possible to divide countries according to the axis of temporal distance from the moment when the share of able-bodied population reached numbers below 66.6%; in the yellow – according to the direction of the vector of able-bodied population share change regarding 66.6% milestone (i.e. removal from him or reverse approximation); in the green zone – according to the proximity of achieving 66.6% milestone. However, in our research we stick to three groups identified earlier, because the main task is to determine common patterns, not to conduct in-depth cross-country analysis.
Factors and peculiarities of demographic dividend implementation in the regions of the world. Data from Table 1 shows that the red group includes primarily developed and developing countries: most European countries, USA, Canada, Australia, New Zealand, Japan, Georgia, Sri Lanka and several Caribbean island states. In numerical terms, the representation of countries in the yellow group (intermediate stage of transition) is significantly higher. It includes 7 European, 6 African, 32 Asian, 15 Latin American, and 2 island states of Oceania. The largest number of countries is in the green group.
Acquired data shows economic and geographic differentiation of the countries regarding stage of demographic dividend implementation: the red group primarily includes economically developed and developing (according to the methodology of World Bank) European, North American, and Oceanian countries, the yellow group – primarily developing countries of Asia and Latin America, the green group – a number of developing and less developed African, Asian, Latin American, and Oceanian countries. Classification of the groups according to territorial features gives an opportunity to obtain an approximate economic and geographical distribution. But in terms of defining features and patterns of the global transition, it is more important to assess the contribution of each group to global demographic processes (Tab. 2).
We can draw several important conclusions based on obtained data. Change in the balance of global population’s age structure from 1950 to 2015 was characterized by increase of share of population below 14 years old (by 8.1%) and a parallel increase of the share of ablebodied and elderly population (by 4.9 and 3.2% respectively). In general, this indicates the presence of a single global trend of the age structure transformation, but contributions of identified groups to its change are significantly different. In 1950, for example, 25% of the world’s child population, one third part (33%) of the working-age population, and 50% of the elderly people lived in the red group countries. However, due to the relatively early entry and completion of the demographic dividend implementation, the red group showed the
Table 2. Matrix of the balance of global population’s age structure change, 1950 and 2015
|
Year |
Contribution to the share of global population aged from 0 to 14 |
Contribution to the share of global population aged from 15 to 64 |
Contribution to the share of global population aged above 65 |
|||||||||
|
Red group |
Yellow group |
Green group |
Total |
Red group |
Yellow group |
Green group |
Total |
Red group |
Yellow group |
Green group |
Total |
|
|
1950 |
8.7 |
19.4 |
6.1 |
34.2 |
20.6 |
31.7 |
8.4 |
60.7 |
2.5 |
2.1 |
0.5 |
5.1 |
|
2015 |
2.8 |
13.6 |
9.8 |
26.1 |
11.7 |
39.8 |
14.1 |
65.6 |
2.9 |
4.3 |
1.1 |
8.3 |
|
+/- |
-5.9 |
-5.8 |
+3.7 |
-8.1 |
-8.9 |
+8.1 |
+5.7 |
+4.9 |
+0.4 |
+2.2 |
+0.6 |
+3.2 |
Source: own calculations based on World Population Prospects data: the 2015 revision. Available at: largest decline in the proportions of younger and working-age population, as well as the smallest increase of the share of elder people. Thus, by 2015, the contribution of the red group to the formation of the three main groups of the world population decreased to 11, 18 and 35%. Demographic processes in the countries of the yellow and red groups equally contributed to the reduction of the proportion of the child population in the global population structure. While the countries in the intermediate stage of DD implementation contributed to the largest increase in the proportion of the workingage (by 4.9%) and the elderly population (by 2.2%) by increasing their contribution to the formation of these age groups in the global population to 61 and 52%, respectively. The green group is the only group which showed a growth of child population share from 1950 to 2015. Also, the growth of working-age (by 5.7%) and elderly (0.6%, which is 0.2% higher than in the red group) population groups was recorded.
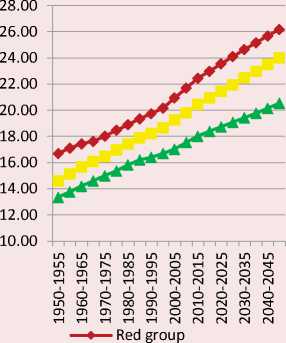
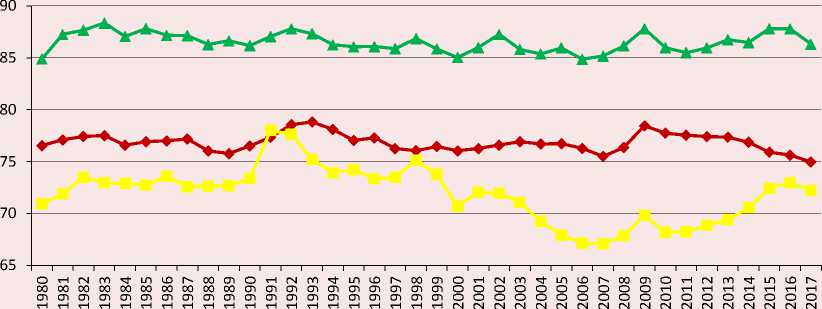
The reasons of differences in contributions of three country’s groups to the transformation processes of global population’s age structure should be sought for in the trends of mortality and fertility rates change. Control over many reasons of deaths, thoroughly described within the theory of epidemiological transition [18; 19], is the primary cause of changes which led to the beginning of global demographic transition. Let us look at the data of life expectancy changes in three groups of the countries (Fig. 3).
Data, presented in the graphs, show that selected groups are characterized by factual and forecasted increase of life expectancy across all ages. Red group countries still surpass other regions in terms of population’s life expectancy, but rates of LEB increase were almost two times higher in 1950–2015 with births in two other groups (13 years against 23.5 and 25 years respectively). The reason is in great reserves of decrease of infant mortality rates in yellow and green groups (maintained at the fairly high
Figure 3. Trends of life expectancy changes in three identified groups: fact and forecast (A – life expectancy at birth; B – life expectancy at the age of 65; C – life expectancy at the age of 80)
90.00
85.00
80.00
75.00
70.00
65.00
60.00
55.00
50.00
45.00
40.00
=0= Red group
Yellow group
* Green group
Yellow group
—*— Green group
11.00
10.00
9.00
8.00
7.00
6.00
5.00
4.00
• Red group
Yellow group * Green group
Source: own calculations according to World Population Prospects data: the 2015 revision. Available at: unpd/wpp/ level), which became a primary factor of such significant life expectancy growth at birth. At the same time, LEB increase at the age of 65 and 80 during the analyzed period in all three groups was roughly equal: in the red group – by 5 and 3 years, in the yellow group – by 6 and 3 years, in the green – by 5 and 2 years.
We can confidently say that world population’s life expectancy increase is the result of its age structure ageing. But it should be noted that the rate of population ageing in the red group countries and their increasing contribution to the formation of global population aged 65 years and above is lower than in the countries from the yellow and green groups, where the population can still be described as “young”. Thus, group of countries having the largest share of elderly population, the highest survival and ageing “depth” rates have the least impact on global population ageing “from above”. Meanwhile, countries of early transition showed the biggest decrease rates of young and able-bodied population. This paradoxical, at the first glance, situation, requires an appeal to the next factor which determines the size of the foundation of global population’s age pyramid – fertility trends.
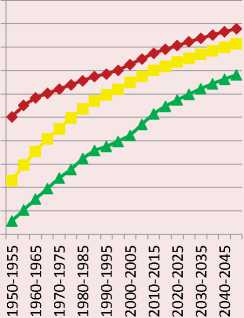
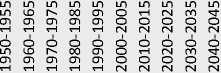
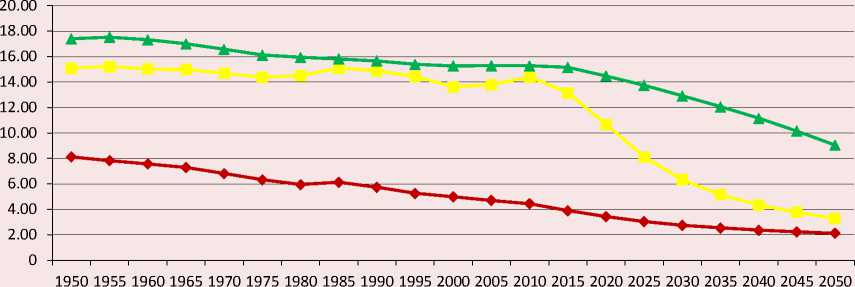
The graphs (Fig. 4) show the differences in changes of the total fertility rate (TFR) in three groups, which are more significant than in the case with LEB. TFR decrease in the countries of early transition started at the lower level and was much more moderate than in the intermediate and late transition groups. In the second half of the 20th century – at the beginning of the 21st century TFR coefficient in the countries of yellow group decreased rapidly (from 5.6 to 1.9). It created a situation when, on the one hand, fertility rates sharply dropped below the level of mere population’s reproduction and, on the other hand, conditions for a fast transition to the demographic dividend implementation were created. In the countries of late transition decrease of TFR indicator was also significant,
Figure 4. Changes of the total fertility rate in the groups of the countries: fact and forecast
—ф— Red group Yellow group —А— Green group
Source: own calculations according to World Population Prospects data: the 2015 revision. Available at: unpd/wpp/
Table 3. Average values and variation coefficients for some demographic indicators in the world countries from 1950 to 2015
|
Year |
Indicator |
|||||
|
Share of population aged above 65 in world countries |
LEB at the age 65+ |
Total fertility rate |
||||
|
Average value |
Variation coefficient |
Average value |
Variation coefficient |
Average value |
Variation coefficient |
|
|
1950 |
4.9 |
49.8 |
11.5 |
14.9 |
5.5 |
30.3 |
|
2015 |
8.4 |
70.2 |
16 |
16.5 |
2.9 |
49.6 |
|
Change 2015-1950 |
+3.5 |
+20.4 |
+4.5 |
+1.6 |
–3.6 |
+19.3 |
Source: own calculations according to World Population Prospects data: the 2015 revision. Available at: but its value is still at the relatively high level (about 4 children per 1 woman of reproductive age).
Next, it is advisable to examine the change in the variation of the studied indicators for world population as a whole from 1950 to 2015 (Tab. 3).
Conducted calculations allow suggesting that, despite the growth of average values of the share of population older than 65, the degree of heterogeneity of all reviewed countries’ indicators in 1950–2015 also significantly increased: coefficient of variation share of 65+ population grew from 49.8 to 70.2%. It should be mentioned that analyzed sample was not homogeneous in the 1950s (variation coefficient exceeded 33%), while the degree of differentiation was a little bit lower which definitely affected distribution of countries. Thus, it is obvious that the population of the world as a whole is ageing, but the difference between two poles of countries (“young” and “old”) is growing.
The data presented in the table confirm the fact that the reason of the observed changes is not the increase of population’s life expectancy in old age. From 1950 to 2015 life continuity at the age of 65+ tended to grow, but variation coefficient of this indictor in world’s countries has not changed and remained at the same low level (15 and 16.5% respectively). Therefore, despite the different intensity of demographic ageing in the regions of the world, the growth of LEB in older ages occurs in a similar scenario and does not significantly affects the increase of the territories differentiation by the level of old age. The main reason is the difference in birth rates decrease as the grounding factor of population’s ageing [20]. The trend of fertility decline is global, which is confirmed by data on the change of the total fertility rate: from 1950 to 2015, in average, the indicator decreased from 5.5 to 2.9 (Tab. 3). However, variation coefficient significantly increased (from 30.3 to 49.6%) by almost the same number as the variation of the proportion of population aged over 65 years (about 19–20%). Thus, the general trend of declining fertility and, accordingly, the global ageing of the population is determined by a group of countries (about 40% of the total number of territories, primarily developed and developing), which entered the third phase of the demographic transition. A primary feature of this process is that other territories lag behind. In these countries fertility rates remain relatively high, and it predetermines the growth of the revealed differentiation.
To clarify, let’s compare the distribution of the world’s countries by the level of demographic old age in the classifications of the United Nations and Boege-Garnier-Rosset in 1950 and 2015 (Tab. 4 and 5).
We can draw several conclusions based on these tables’ data. Thus, it is clearly seen that
Table 4. Distribution of countries according to the level of demographic old age in 1950 and 2015 (UN classification), %
|
Level of old age |
Share of world’s countries, % |
|
|
1950 |
2015 |
|
|
Young population (share of those older than 65 is less than 4%) |
47.5 |
31.5 |
|
Mature population (share of those older than 65 is from 4 tо 7%) |
29 |
24.5 |
|
Mature population (share of those older than 65 exceeds 7%) |
23,5 |
44 |
Source: own calculations according to World Population Prospects data: the 2015 revision. Available at:
Table 5. Distribution of countries according to the level of demographic old age in 1950 and 2015 (Boege-Garnier-Rosset classification), %
|
Stage |
Share of people at the age of 60 and older, % |
Distribution of countries, % |
|
|
1950 |
2015 |
||
|
1 |
Demographic youth (<8) |
66 |
43.5 |
|
2 |
The first threshold of old age (8–10) |
9.5 |
10 |
|
3 |
Threshold of old age itself (10–12) |
12 |
7.5 |
|
4 |
Demographic old age (12 and higher) |
12 |
39 |
|
Initial level of demographic old age (12–14) |
6 |
4.5 |
|
|
Intermediate level of demographic old age (14–16) |
5.5 |
5 |
|
|
High level of demographic old age (16–18) |
1 |
2 |
|
|
Very high level of demographic old age (18 and higher) |
0 |
27.5 |
|
Source: own calculations according to World Population Prospects data: the 2015 revision. Available at:
the share of countries which can be described as demographically old, in the period from 1950 to 2015, noticeably increased: from 23.5 to 44% according to the UN methodology and from 12 to 39% on the scale of Boege-Garnier-Rosset. On the one hand, this trend once again confirms the conclusion that the process of demographic ageing of the world is quite intense. On the other hand, the presence of countries in the “buffer” zone between young and old territories significantly decreased. In fact, in the 1950s, three conventional levels of old age were distributed in descending order from “young” to “old”. However, at the moment, both classifications suggest the existence of two poles, one of which primarily includes young territories, the other – old territories.
Back at the time, it took 120 years for France to double the number of population older than 60 years old, while the same took 20 years in China in the second half of the 20th century. At the same time, France has long been considered as one of the “oldest” countries in the world, and China is still at the maximum point of the demographic dividend implementation. Today, the rate of fertility decline in yellow and green groups is significantly higher than in the countries of the red group in earlier periods, and the population of these territories exceeds the levels of demographic old age. This fact suggests that, under conditions of intense global population ageing and in addition to measuring the levels of demographic ageing through the prism of the share of elderly population, the parameters of demographic dividend in a particular area should be assessed too.
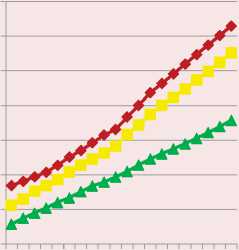
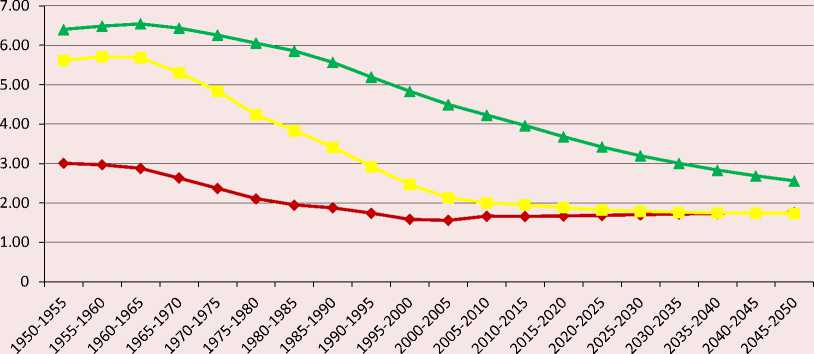
The demographic dividend is some kind of a bonus which allows creating new economic basis for further development of a state in new demographic environment (further age structure ageing). The bigger this bonus is – the higher the chance that a manifestation of population’s ageing consequences will be more vividly expressed. Thus, the very change of the demographic “window” parameters becomes one of the most important tasks in terms of defining the real scale of age structure transformations and accompanying socioeconomic changes. Figure 5 presents factual and forecasted change of the share of population aged between 15 and 64 in three groups in relation to 66.6% indicator.
According to this data, the growth of ablebodied population share in the red and yellow groups became noticeable after the end of postwar “baby boom” with time lag around 5–10 years. It happened significantly later in the green group. However, it is more important to define the parameters of achieving maximum values of the indicator within demographic dividend implementation (in our scenario – in relation to 66.6% indicator). As you can see in the figure, countries from the red group achieved the beginning of the maximum stage of demographic dividend implementation in the 1980s. This process went on until 2010–2015 (i.e. about 30–35 years). Herewith, the biggest value of the share of able-bodied population in this period was 68%. The yellow group countries entered this stage at the beginning of the 21st century, and they are currently at the peak of demographic dividend implementation. Despite approximate equality of duration of this period between these countries and the countries of the red group, the “depth” of DD implementation in the yellow group is significantly bigger: from the mid-2000s, the share of population aged between 15 and 64 years exceeds 71%. Countries of the green group approach maximum parameters of demographic dividend implementation very fast. However, according to the intermediate variant of the UN forecast, the most countries will achieve these values only in the second half of the 21st century.
The emergence of the wider demographic “window” for the countries of the yellow group was made possible because of the imposition of a number of conjuncture factors: relatively fast decrease of fertility and mortality rates in the second half of the 20th century. But relatively fast (by historic standards) obtaining of big demographic dividend can become a large-scale consequence of age structure ageing
Source: own calculations according to World Population Prospects data: the 2015 revision. Available at: unpd/wpp/
for the countries of this group in the nearest future. The return to quantitative indicators of the overall demographic loading is followed by qualitative changes of its structure ( Tab. 6 )
From the data presented in the table, it can be concluded that the structure of the demographic loading in all three groups of countries tends to “ageing”. In the red group, the share of elder population loading increased by 42.5%, in the yellow – by 45.2%. However, it should be noted that growth rates of demographic loading in the countries going through the intermediate stage of transition is much higher than in other groups of countries (more than 5.5 times growth in 65 years). For more clarity, let us review the support coefficient – the reverse indicator of population’s demographic loading (Fig. 6).
After the huge demographic dividend implementation, the support coefficient in the countries of the yellow group will go though unprecedented decline. Consequences of this process are already noticeable in many spheres. So, in recent years, there was growth rates decrease in three largest economies of the yellow group (China, India and Brazil) [21], which primarily determine steady development of the whole world. The rating of pension systems [22], in which 43 countries of the world underwent detailed analysis, is also very indicative. It is significant that China, India and Brazil were placed on 40th, 42nd and 43rd positions respectively, because of the largest negative dynamics by all parameters.
Table 6. Change of the structure of overall demographic loading in three groups of countries, 1950–2015
|
Indicator |
The red group |
The yellow group |
The green group |
|||
|
1950 |
2015 |
1950 |
2015 |
1950 |
2015 |
|
|
Share of children’s loading in the total demographic loading, % |
77.3 |
34.8 |
89.8 |
42.3 |
91.7 |
73.8 |
|
Share of elderly people’s loading in the total demographic loading, % |
22.7 |
65.2 |
10.2 |
57.7 |
8.3 |
26.2 |
Source: own calculations according to World Population Prospects data: the 2015 revision. Available at:
Figure 6. The support coefficient of the population older than 65 in three groups of countries: fact and forecast
— ♦ — Red group Yellow group —A— Green group
Source: own calculations according to World Population Prospects data: the 2015 revision. Available at: unpd/wpp/
Figure 7. Changes of final consumption level in three groups of countries, in % from GDP, 1980–2016
• Red group Yellow group * Green group
Source: own calculations according to World Population Prospects data: the 2015 revision. Available at: unpd/wpp/
From the data, concerning final level of consumption in three reviewed groups of the countries (Fig. 7) , it follows that the level of final consumption in the green group, in relation to GDP, exceeded similar indicators in the red and yellow groups throughout the research period. The reason is in remaining high values of demographic loading by young population. At the same time, the level of per capita final consumption, in turn, is quite low, which could be explained by larger transfers toward children. The yellow group countries showed more noticeable rates of the final consumption level decrease in relation to demographic dividend implementation, i.e. situation when population produces significantly more than consumes, and the deficit of life cycle is noticeably smaller on the age axis. However, due to the rapid growth of the share and number of elderly citizens, reverse trends are gaining momentum now. It, consequently, leads to increase of the state budget expenditures related to “old age”.
Experience of developed countries allows stating that ageing “from above”, i.e. at the expense of life expectancy increase, in the future will become the primary factor of increase of elderly population share, which will affect growth of budget expenditures, but without the compensating effect of a higher level of capital-labor ratio. As a result, the most likely overall outcome for ageing societies is a decline of per capita consumption level with the same high GDP levels.
Conclusion. As the analysis showed, in terms of global population’s age structure transformation world’s countries are conditionally divided into three groups: the red group (countries which finished the demographic dividend implementation and entered the stage of irreversible population ageing); the yellow group (countries which are in the process of the demographic dividend implementation, including those which just started it or finishing it); the green group (countries which did not start the demographic dividend implementation).
One of the most important conclusions is the establishment of the following pattern: currently, the intensity and the depth of the demographic dividend implementation is significantly substantial in the developing countries (in terms of economy and demography; the yellow group) than in the countries which finished this process (primarily developed countries). The analyzed phenomenon fits the economic concept of beta-convergence [22]. Developing countries show not only the higher rates of economic growth, but also approach a number of developed countries’ demographic indicators. However, the enormous demographic dividend, received by the yellow group countries, has a downside: the width of the demographic opportunity “window” is directly proportional to the scale of the potential consequences of population ageing, which inevitably follows the stage of the dividend implementation. At the moment, a number of the world’s largest economies included in the yellow group (China, India, Brazil), significantly reduced the rates of economic growth with a parallel increase of negative manifestations in the social sphere (in particular, the problem of pensions). Depending on the context of the current state of population’s age structure, countries form the red and yellow groups need to introduce a whole array of programs of their policy adaptation to new demographic conditions (increase of labor productivity, optimization of social institutions work, etc.).
To make competent management decisions it is necessary to acknowledge not just the fact of the demographic dividend phenomenon, but also track the mechanisms of its formation. The important element is the ability of the state to rethink its social policy in new demographic conditions and creating opportunities for saving steady rates of the development and fair redistribution of social goods. Moreover, as stated before, a country should be ready to implement the policy of economy adaptation to the consequences of age structure transformation in order to efficiently use the
“demographic bonus”. Perhaps, in the nearest century the countries of the green group will be the primary factor of demographic and economic development. Most countries of the African continent, as well as one third of the Asian and Latin American countries, still has not implemented its demographic dividend, which largely affects world’s economic development in general. Nonetheless, the issue of their readiness to face consequences of age structure change remains. Economic development of the countries from the green group shows positive trends. It, however, might not be enough for effective implementation of the demographic dividend. In this regard, it is possible to point out several possible directions which will help to prepare the economy of these countries for the stage of DD implementation:
-
– creation of new jobs, taking into account the projected increase of labor market supplies;
-
– development of the education and health system;
-
– attraction of foreign investments for development of socio-economic infrastructure;
-
– elimination of informal employment and discrimination on labor market;
-
– reorientation of the economy to high-performance and labor-intensive production;
-
– private sector development and cuts of business taxes.
Decrease of mortality and fertility in combination with effective implementation of policy support measures can give the developing dividend to the developing countries and raise the quality of their citizens’ lives. As a result, the green group might, and should, become one of the primary members of global economy and help partially alleviate the consequences of the world’s population ageing. However, inability to take advantage of the opportunities, offered by this new demographic situation, can cause significant economic and social risks.
References From the demographic dividend to population ageing: world trends in the system-wide transition
- Maddison A. The World Economy: Historical Statistics. OECD, 2003. 657 p.
- Tanton J. End of the migration epoch? Time for a new paradigm. The Social Contract, 1994, vol. 4, pp. 162-173.
- Shabunova A.A., Barsukov V.N. Trends of demographic ageing of the Russian Federation population and ways to overcome them. Problemy razvitiya territorii=Problems of Territory's Development, 2015, no. 1, pp. 76-87. (In Russian).
- Shabunova A.A. Social development and demographic challenges of our time. Problemy razvitiya territorii=Problems of Territory's Development, 2014, no. 2. pp. 7-17. (In Russian).
- Yuselius M. Age and inflation. Finansy i razvitie=Finance
- Lee R., Mason A. What is the demographic dividend? Finansy i razvitie=Finance
- Prskawetz A., Sambt J. Economic support ratios and the demographic dividend in Europe. Demographic Research, 2014, vol. 30, pp. 963-1010.
- Lee R., Mason A. Population aging and generational economics: key findings. In: Population Aging and the Generational Economy. Cheltenham, UK: Edward Elgar Publishing, 2011. Pp. 3-31.
- Mason A., Lee M., Abrigo M., Lee S. Support Ratios and Demographic Dividends: Estimates for the World. New York, 2017. 52 p.
- Korotaev A.V, Zin'kina Yu.V. The Egyptian revolution of 2011: a sociodemographic analysis. Istoricheskaya psikhologiya i sotsiologiya istorii= istorical Psychology
- Lee R., Mason А. Population Aging, Wealth, and Economic Growth: Demographic Dividends and Public Policy. WESS Background Paper. 2015. 35 p.
- Bloom D., Canning D., Mansfield R., Moore M. Demographic Change, Social Security Systems, and Savings. National Bureau of Economic Research, 2006, 22 p.
- Bloom D., Canning D., Fink G., Jocelyn E. Fertility, Female labor force participation, and the demographic dividend. Journal of Economic Growth, 2009, vol. 14, pp. 79-101.
- Prskawetz A., Bloom D., Lutz W. Population aging, human capital accumulation, and productivity growth. Population and Development Review, 2008, vol. 33, pp. 125-145.
- Meltem I. Economic and social consequences of population aging the dilemmas and opportunities in the twenty-first century. Applied Research in Quality of Life, 2015, vol. 10, pp. 735-752.
- Orlicka E. Impact of population ageing and elderly poverty on macroeconomic aggregates. Procedia Economics and Finance, 2015, vol. 30, pp. 598-605.
- Nerlich С., Schroth J. The economic impact of population ageing and pension reforms. Economic Bulletin Articles, European Central Bank, 2018, vol. 2. Available at: https://ideas.repec.org/a/ecb/ecbart/201800022.html
- Vishnevskii A.G. Praise of ageing. Otechestvennye zapiski=Notes of the Fatherland, 2005, no. 3(24). Available at: http://www.strana-oz.ru/2005/3/pohvala-stareniyu. (In Russian).
- Omran A.R. The epidemiologic transition: a theory of the epidemiology of population change. The Milbank Quarterly, 2005, vol. 83(4), pp. 731-757.
- Lee R., Zhou Y. Does fertility or mortality drive contemporary population aging? The revisionist view revisited. Population and Development Review, 2017, vol. 43(2), pp. 285-301.
- Bulletin on Current Trends in Global Economy, 2018. No. 34. Available at: http://ac.gov.ru/files/publication/a/17357.pdf. (In Russian).
- Global Retirement Index, 2018. Available at: https://www.im.natixis.com/us/resources/2018-global-retirement-index-report
- Barro R., Sala-i-Martin X. Economic Growth and Convergence across the United States. NBER Working Papers 3419, 1990. Available at: https://ideas.repec.org/p/nbr/nberwo/3419.html
