Full analysis of Sierra Leone bauxite and possibilities of bauxite residue filtration

Author: Dobra Gheorghe, Kiselev Anatoly, Filipescu Laurentiu, Alistarh Vicol, Anghelovici Nicolae, Iliev Sorin
Journal: Журнал Сибирского федерального университета. Серия: Техника и технологии @technologies-sfu
Article in issue: 5 т.9, 2016.
Free access
Chemical analysis, classical or instrumental using ICP and the XRF spectrometry, offers complete information on elemental composition and major chemical constituents of bauxite and bauxite residues resulted from the Bayer process. The XRD diffractometric analysis provides information on quantitative mineralogical composition of these materials and it enables the real identifi cation of main chemical combinations, whose reactivity is essential in driving the process of obtaining alumina through the Bayer process. Mineralogical components identified in the bauxite samples were Gibbsite (30-40 %), Al - goethite (20-30 %) and hematite (less than 5 %). About 40 % of the Sierra Leone bauxite mineralogical phases were found in amorphous state, but all these amorphous phases are also originating from the above crystalline components, under the excessive wearing during bauxite deposit formation and its metamorphic transformations. The minor crystalline components from bauxite are: kaolin, quartz, zircon, ilmenite and anatase, but their concentration is below 2 % (close to the detection limit of the XRD analysis). The main mineralogical components identified in red mud are the Al-goethite (35 %) and the hematite (12 %). The minor crystalline components from red mud are: gibbsite, katoite, sodalite, calcite, rutile and anatase. Experimental data of this type of bauxite have shown that a compact mass of approximately 50-55 % of bauxite passes fully untransformed through all important stages of the Bayer process. This material of uniform size and composition can form a structure with low hydraulic resistance, easy filterable both on conventional or hyperbaric steam fi lters.
Bauxite, sierra leone, mineralogy description, filtration
Short address: https://sciup.org/146115099
IDR: 146115099 | UDC: 669.713.17 | DOI: 10.17516/1999-494X-20169-5-643-656
Подробный анализ бокситов Сьерра-Леоне и возможности фильтрации остаточного продукта переработки бокситов
Химический анализ, классический или инструментальный с использованием индуктивно связанной плазмы (ИСП) и рентгенофлуоресцентного анализа (РФА), дает достаточную информацию по элементному анализу и основным химическим составляющим боксита и бокситовых осадков, образующихся в процессе Байера. Рентгеновская дифрактометрия информирует о количественном минералогическом составе этих материалов и обеспечивает реальную идентификацию основных химических комбинаций, реакционная способность которых служит движущей силой получения глинозема в процессе Байера. В пробах боксита были следующие минералогические компоненты: гиббсит (30-40 %), алюмогетит (2030 %) и глиноземистый гематит (менее 5 %). Около 40 % состава боксита из Сьерра-Леоне представлено аморфными материалами, однако эти аморфные фазы также образованы вышеупомянутыми кристаллическими компонентами при чрезмерном износе в процессе образования бокситового осадка и его метаморфических превращений. Второстепенными кристаллическими компонентами в боксите являются: каолин, кварц, циркон, ильменит и анатаз, но их концентрация менее 2 % (близко к пределу обнаружения рентгенодифракционным анализом, РДА). Основные минералогические компоненты, определенные в красном шламе, - алюмогетит (35 %) и глиноземистый гематит (12 %). Второстепенные кристаллические компоненты в красном шламе - гиббсит, катоит, содалит, кальцит, рутил и анатаз. Экспериментальные данные по этому типу бокситов показывают, что компактная масса в размере 50-55 % боксита проходит практически без превращений через все важные стадии процесса Байера. Этот материал однородного размера и состава может образовывать структуры с низким гидравлическим сопротивлением, легко фильтруемые на традиционных фильтрах или фильтрах с избыточным давлением пара.
Text of the scientific article Full analysis of Sierra Leone bauxite and possibilities of bauxite residue filtration
What the chemical analysis offers, is exactly the same provided by ICP or XRF spectrographic analysis, as well as many other methods. The three main mentioned methods have a satisfying accuracy level, when is about simple substances and a small number of elements present in the analyzed sample. The XRD analysis (quantitative) shows the real chemical combinations content, but this analysis takes into consideration only the solid crystallized phases existing in the analyzed sample. The amorphous solid phases cannot be viewed by the XRD analysis. In principle, to get a real picture on the composition of a material, at least the following methods must be applied: chemical method, ISP, XRF and XRD. In the bauxite case, applying the XRD analysis (quantitative) is compulsory mainly, when big or unexpected variations of the physical and chemical characteristics of this raw material, compared to other bauxite types were noticed. Presence of some polymorphic phases can change a lot the parameters of the bauxite processing process. A complete analysis of the bauxite comprising the chemical analysis together with the ISP, XRF, and the qualitative or/and quantitative XRD analysis serves undoubtedly the processing technology, due to its engineering support for assisting the optimum parameters choice.
Collecting and preparing the bauxite and mud samples
For this evaluation, 3 bauxite samples were selected and taken from different exploited pits and supplementary, a type of red mud coming from the bauxite sample having the closest chemical composition to the typical Sierra Leone bauxite. To take the representative samples, all current norms recommended by the specialty literature were applied. The red mud sample comes from the processing of the bauxite related to MG sample and it was taken from the last step of the mud washing line. The analyzed samples are presented in Tables 1 and 4.
Mineralogical analysis of the bauxite and red mud samples
Samples preparation for the XRD diffractometric analysis. Samples preparation was made according [1]. Samples were homogenized and from each sample two specimens were separated:
-
a) From each sample of about 2g, a specimen was hand crushed in an agate mortar for micronization (below 40 μm) and homogenization. This was used for the phase qualitative analysis (qualitative mineralogy);
-
b) The second specimen of each sample was mixed with a known quantity of pure spectral ZnO. In this way samples with a controlled ZnO content were obtained. The zinc oxide was used as an external standard (it was not component in the initial samples). Zinc oxide allows correction of the experimental data and is a reference material required for the phase quantitative analysis. This sample was crushed
Table 1. Bauxite and red mud samples
DRXP data acquisition. Acquisition of data was achieved on the BRUKER D8 ADVANCE diffraction instrument by means of the DIFFRAC plus XRD Commander (Bruker AXS) software through the Bragg-Brentano diffraction method, coupling Θ–Θ on vertical configuration (according to [2]).
DRXP data processing. The data processing was performed by means of the DIFFRAC plus BASIC Evaluation Package software, version EVA12, 2006 of the software package containing DIFFRAC plus BASIC (Bruker AXS) (according to [3]) and the data base ICDD PDF-2 Release 2006 (according to [4]). Calibration of the diffraction instrument concerning the position, intensity and shape of the maximum points of diffraction was made according to [5, 6] by means of a reference standard sample which is a part of the Bruker D8 Advance equipment. The compounds identification (the DRXP phase qualitative analysis) was made by means of the software EVA12 – Module Search / Match [6] and of the data base ICDD PDF-2 Release 2006 [7].
The quantitative phase analysis was made through Rietveld method by means of the software DIFFRACplus TOPAS Version 3.0 (Bruker AXS) [8, 9]. The structural data needed to the Rietveld quantitative analysis were taken over from the data bases: Crystallography Open Database and The American Mineralogist Crystal Structure Database [10-13] for all crystalline phases identified after the phase qualitative analysis.
In the specimen submitted to the Rietveld analysis, a known quantity crystalline ZnO (zincite) was added. In this approach, the mass concentration of each mineral identified is quantified in comparison with the external standard zincite. The amorphous material content is given by the difference between 100 % and the sum of all crystalline phases concentrations identified and quantified. The content of amorphous material determined in this way actually represents the solid amorphous phases, the liquid phases retained into amorphous mass porosity (humidity, salts solutions, etc.), the poor crystallized phases and/or undetected amorphous or crystalline phases.
The qualitative analysis of the bauxite samples enabled the identification of the following mineralogical phases: Crystalline compound Gibbsite
Goethite-aluminian
Hematite-aluminian
Kaolinite
Quartz
Zircon
Ilmenite
Anatase
|
Formula |
PDF References |
|
Al(OH) 3 |
01-076-1782 (I) |
|
(Fe 1-x Al x )O(OH) |
01-081-0464 (I) |
|
(Fe1-xAlx)2O3 |
00-033-0664 (*) |
|
Al 4 (OH) 8 (Si 4 O 10 ) |
01-078-2110 (*) |
|
SiO 2 |
01-085-0794 (A) |
|
ZrSiO 4 |
01-089-2655 (*) |
|
FeTiO 3 |
01-075-1208 (*) |
|
TiO 2 |
03-065-5714 (*) |
The qualitative analysis of the red mud allowed the identification of the following mineralogical phases:
Compound Name
Formula
PDF References
|
Goethite-aluminian |
(Fe 1-x Al x )O(OH) |
01-081-0464 (I) |
|
Hematite-aluminian |
(Fe1-xAlx)2O3 |
00-033-0664 (*) |
|
Ilmenite |
FeTiO 3 |
01-075-1208 (*) |
|
Katoite, silicatian |
~ Ca 3 Al 2 (SiO 4 )(OH) 8 |
00-038-0368 (I) |
|
Sodalite |
~ Na 8 (Al 6 Si 6 O 24 )Cl 2 |
01-072-4895 (A) |
|
Gibbsite |
Al(OH) 3 |
01-076-1782 (I) |
|
Calcite |
CaCO 3 |
00-005-0586 (*) |
|
Quartz |
SiO 2 |
01-085-0794 (A) |
|
Zircon |
ZrSiO 4 |
01-089-2655 (*) |
|
Anatase |
TiO 2 |
03-065-5714 (*) |
|
Rutile |
TiO 2 |
01-077-0440 (A) |
|
Magnetite |
Fe 3 O 4 |
01-082-1533 (*) |
We mention that this approach was used and successfully validated in more studies concerning the X-rays diffraction performed for the identification and quantification of the products obtained during the thermal decomposition of the alumina hydrates. (Gan et al. [16]). Related to the residues from the sample dissolution in HCl, the phase quantitative analysis was achieved by Rietveld method, assuming that all identified phases are crystalline.
In this approach, the sum of the mass concentrations of all quantified crystalline phases is 100 %. In this context, the amorphous material content (that generally refers to the poor crystallized phases and/or undetected and/or liquid retained in the porosity of studied powder) was ignored being considered negligible.
Experimental results
DRXP Analysis. The results of the Rietveld quantitative analysis performed on the bauxite samples prepared for the mineralogical phases identification are presented in Table 2. The data in the Table 2 show that the Sierra Leone bauxite has a variable content of gibbsite (as major aluminium carrier phase), which depends on the main source and the main source location. The particularly structure of this type of bauxite is determined by the presence of alumino-goethite as a prevalent phase between the iron compounds identified in this product. In general, and in Sierra Leone bauxite in particular, even the hematite present in the Sierra Leone bauxite is an aluminous hematite with a significant content of aluminium substituted in the hematite crystal lattice (the iron concentration is 7-8 % atomic).
In alumino-goethite, the aluminium substitution in the goethite crystal lattice reaches up to a concentration of 22-25 % atomic. The alumino-goethite is mostly found as a fine and uniform crystallized product, having the crystallite size below 10 nm. The concentration of this aluminum-goethite varies between 17 and 25 % from the bauxite mass. The alumino-goethite coarse fraction, rising up to 2-5 % of the bauxite mass, is irregular and it consists of highly deformed crystallites having variable sizes ranging between 20 and 50 nm.
The data in the Table 3 show that the gibbsite is a minor phase in the red mud composition. The Al2O3 constituent in the red mud is trapped into alumino-goethite and in the aluminous hematite. It is obvious that the washing of this type of red mud should be limited to the removal of soluble aluminium and sodium, and a highly-efficient washing means a full recovery of the unbounded sodium from the red mud mineralogy (actually, the sample was intensively washed to clean out the insoluble phases for – 647 – a better accuracy in evaluation of the insoluble phases). The quantitative crystallographic analysis of the Sierra Leone bauxite and of the mud resulting after the Al2O3 extraction during the Bayer process applied at SC Alum SA Tulcea enables an analysis of the main chemical constituents distribution in the bauxite crystalline phases, as well as in the red mud crystalline phases.
Table 2. Bauxites mineralogical composition
|
Mineralogical phases |
Bauxite composition, sample MG, Bauxite, % |
Average dimension of crystal Lvol-IB (nm) |
Bauxite composition, sample IRM-E III, Bauxite, % |
Average dimension of crystal Lvol-IB (nm) |
Bauxite composition, sample IRM-D II, Bauxite, % |
Average dimension of crystal Lvol-IB (nm) |
|
*Zincite |
0 |
276 ± 26 |
0 |
203 ± 14 |
0 |
191 ± 13 |
|
Gibbsite |
43.9 ± 2.5 |
98.1 ± 2.0 |
31.3 ± 1.7 |
90.7 ± 2.0 |
54.1 ± 2.6 |
102.5 ± 2.0 |
|
Al-Goethite, fine |
17.07 ± 0.99 |
9.63 ± 0.88 |
24.9 ± 1.4 |
9.55 ± 0.76 |
21.4 ± 1.0 |
6.76 ± 0.67 |
|
Al-Goethite, coarse |
2.20 ± 0.13 |
49 ± 29 |
2.89 ± 0.16 |
42 ± 18 |
6.42 ± 0.31 |
20.2 ± 2.0 |
|
Al-Hematite |
4.81 ± 0.28 |
28.5 ± 1.7 |
3.35 ± 0.19 |
22.8 ± 1.9 |
3.41 ± 0.16 |
29.7 ± 2.4 |
|
Kaolinite |
1.379 ± 0.080 |
15.7 ± 5.9 |
4.28 ± 0.24 |
6.4 ± 1.1 |
0.909 ± 0.044 |
15.6 ± 8.8 |
|
Quartz |
0.618 ± 0.036 |
46 ± 18 |
1.85 ± 0.10 |
127 ± 26 |
0.813 ± 0.039 |
25.9 ± 7.8 |
|
Zircon |
0.750 ± 0.044 |
12.7 ± 2.8 |
0.640 ± 0.036 |
12.7 ± 3.2 |
0.519 ± 0.025 |
12.7 ± 4.1 |
|
Ilmenite |
0.298 ± 0.017 |
40 ± 28 |
0.606 ± 0.034 |
66 ± 28 |
0.365 ± 0.017 |
80 ± 58 |
|
Anatase |
0.178 ± 0.010 |
38 ± 26 |
0.189 ± 0.011 |
38 ± 26 |
0.1048± 0.005 |
110 ± 170 |
|
Amorphous |
28.7 ± 4.6 |
30.0 ± 4.3 |
12.0 ± 4.6 |
Table 3. Quantitative analysis of the red mud mineralogical composition coming from the bauxite sample MG
|
Mineralogical phases |
Red mud composition 100 % |
Average dimension of crystal Lvol-IB (nm) |
|
*Zincite |
0 |
81.5 ± 3.8 |
|
Al-Goethite, fine |
34.15 ± 0.55 |
12.94 ± 0.33 |
|
Al-Goethite, coarse |
1.161 ± 0.019 |
190 ± 180 |
|
Al-Hematite |
12.46 ± 0.20 |
21.12 ± 0.73 |
|
Ilmenite |
3.118 ± 0.051 |
12.7 ± 1.7 |
|
Katoite |
2.506 ± 0.041 |
36.8 ± 7.3 |
|
Sodalite |
2.315 ± 0.038 |
63.7 ± 7.0 |
|
Gibbsite |
1.247 ± 0.020 |
280 ± 200 |
|
Calcite |
1.012 ± 0.016 |
109 ± 33 |
|
Rutile |
0.759 ± 0.012 |
12.7 ± 4.3 |
|
Anatase |
0.4976 ± 0.0081 |
12.7 ± 4.7 |
|
Quartz |
0.3917 ± 0.0064 |
130 ± 100 |
|
Magnetite |
0.1200 ± 0.0019 |
54 ± 38 |
|
Amorphous |
40.3 ± 1.1 |
Figure 1 (Tables 4–6) shows that the variation of the Al2O3, content (crystallized as gibbsite) varies within relatively wide ranges in the bauxites samples. The MG and IM EII samples are similar, though not identical, and the IRM EII sample reveals an excess of gibbsite. The second major constituent is Fe 2 O 3 is crystallized in the form of alumino-goethite and aluminous hematite and follows variations which are similar to those of the gibbsite content in bauxite samples. Basically, the mass ratio between these components determines the fine structure of the Sierra Leone bauxite chemical composition. The SiO2 contribution to the bauxite composition is minor, but it is technologically significant (see the
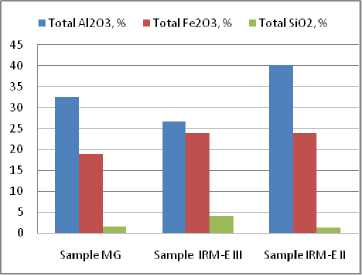
Fig. 1. Distribution of the major chemical constituents in the bauxite crystalline phases
Table 4. Al 2 O 3 content in the analysed bauxites crystalline phases
|
Crystalline phase/Al 2 O 3 , %/ % |
Sample MG |
Sample IRM-E III |
Sample IRM-E II |
|||
|
Phases/ Al 2 O 3 , %/ % |
Total Al 2 O 3 , % |
Phases/ Al 2 O 3 , %/ % |
Total Al 2 O 3 , % |
Phases/ Al 2 O 3 , %/ % |
Total Al 2 O 3 , % |
|
|
Gibbsite(Al 2 O 3 ∙3H 2 O) /Al 2 O 3 |
43.9 / 28.7 |
88.2 |
31.3 / 20.5 |
76.6 |
54.1 / 35.3 |
87.8 |
|
Al-Goethite fine / Al2O3 |
17.07 / 2.69 |
8.2 |
24.9 / 3.92 |
14.6 |
24.1 / 3.37 |
8.4 |
|
Al-Goethite coarse / Al 2 O 3 |
2.20 / 0.35 |
1.1 |
2.89 / 0.45 |
1.7 |
6.42 / 1.01 |
2.5 |
|
Al-Hematite / Al 2 O 3 |
4.8 / 0.25 |
0.8 |
3.35 / 0.19 |
0.7 |
3.41 / 0.18 |
0.5 |
|
Kaolinite / Al 2 O 3 |
1.38 / 0.55 |
1.7 |
4.28 / 1.7 |
6.4 |
0.9 / 0.35 |
0.8 |
|
Total Al 2 O 3 |
32.54 |
100 |
26.76 |
100 |
40.21 |
100 |
Table 5. Fe 2 O 3 content in the analysed bauxites crystalline phases
|
Crystalline phases / Fe 2 O 3 , % / % |
Sample MG |
Sample IRM-E III |
Sample IRM-E II |
|||
|
Phases/ Fe 2 O 3 , % / % |
Total Fe 2 O 3 , % |
Phases/ Fe 2 O 3 , % / % |
Total Fe 2 O 3 , % |
Phases/ Fe 2 O 3 , % / % |
Total Fe 2 O 3 , % |
|
|
Al-Goethite fine / Fe 2 O 3 |
17.07 / 12.5 |
66.43 |
24.9 / 18.2 |
76.44 |
21.4 / 15.7 |
65.9 |
|
Al-Goethite coarse / Fe 2 O 3 |
2.20 / 1.61 |
8.55 |
2.89 / 2.12 |
8.90 |
6.42 / 4.71 |
19.8 |
|
Al-Hematite / Fe 2 O 3 |
4.81 / 4.55 |
24.17 |
3.35 / 3.17 |
13.3 |
3.41 / 3.23 |
13.5 |
|
Ilmenite / Fe 2 O 3 |
0.298 / 0.16 |
0.85 |
0.61 / 0.32 |
1.36 |
0.36 / 0.19 |
0.8 |
|
Total Fe 2 O 3 |
18.82 |
23.81 |
100 |
23.83 |
100+ |
|
Table 6. SiO 2 content in the analysed bauxites crystalline phases
|
Crystalline phase/ SiO 2 , % / % |
Sample MG |
Sample IRM-E III |
Sample IRM-E II |
|||
|
Phases / SiO 2 , % / % |
Total SiO 2 , % |
Phases/ SiO 2 , % / % |
Total SiO 2 , % |
Phases/ SiO 2 , % / % |
Total SiO 2 , % |
|
|
Quartz/SiO 2 |
0.618 / 0.618 |
41.0 |
1.85 / 1.85 |
45.7 |
0.813 / 0.813 |
57.8 |
|
Caolinite /SiO 2 |
1.379 / 0.642 |
42.7 |
4.28 / 1.99 |
49.2 |
0.909 / 0.422 |
30.0 |
|
Zircon/SiO 2 |
0.75 / 0.245 |
16.3 |
0.64 / 0.21 |
5.1 |
0.519 / 0.172 |
12.2 |
|
Total SiO 2 |
1.505 |
100 |
— 4.05 |
100 |
1.407 |
100 |

Fig. 2. Distribution of the chemical constituent Al 2 O 3 in the crystalline mineralogical phases containing Al 2 O 3
unwanted excess in the IRM EIII sample). Therefore, the mass ratio gibbsite / (aluminous goethite + aluminous hematite) should be considered as the main characteristics to define the technological value of the Sierra Leone bauxite.
Figure 2 (Table 4) shows the distribution of chemical constituent Al 2 O 3 between the bauxite crystalline phases. It can be seen that the gibbsite has a content of 80-90 % in all the samples. The lower gibbsite concentration in the IRM EIII sample is due to the excess of minor components with SiO2 content and it is not due to the change of the mass ratio between the major mineralogical phases expressed as mass ratio gibbsite / (aluminous goethite + aluminous hematite). This ratio remains constant in all three samples and demonstrates that these samples come from a unitary type of bauxite deposit.
Figure 3 (Table 5) shows the distribution of the chemical constituent Fe2O3 between the crystallized mineralogical phases contained in the bauxite samples. The main mineralogical phases are the alumino-goethite and the aluminous hematite. Both phases are standing in all samples as solid solutions with same ratio between Al 2 O 3 /Fe 2 O 3 , irrespective of sample. In the presence of the other mineralogical phases, the variations in Al/Fe ratio from one sample to another are eventually attenuated, as it was noticed in the Fig. 2 (Table 5). Hence, the mass ratio Fe/Al in the two mineralogical phases can be considered as the second main characteristics to define the technological value of the Sierra Leone bauxite.
The disparity between the mass fractions of alumino-goethite and aluminous hematite is emphasized in Fig. 3 by an exclusive presentation of iron content mineralogical phases distribution – 650 –
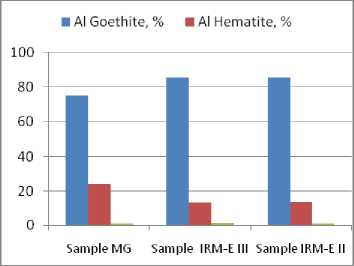
Fig. 3. Distribution of the chemical constituent Fe 2 O 3 in the bauxite crystallized mineralogical phases containing Fe 2 O 3
Table 7. Al 2 O 3 and Fe 2 O 3 content in the red mud crystalline phases
Alumino-goethite is present in the crystallographic structure of Sierra Leone bauxite under two distinct forms: a fine form with the crystallites sizes of 7-10 nm and a coarse form with the crystallites sizes of 20-50 nm. The fine form is a fundamental phase created during the ore deposit bauxitization. The coarse form is a secondary phase, which appeared during the transformations occurring after bauxitization. According to the Table 7, the concentration of the alumino-goethite fine form is predominant in all three bauxite samples, confirming as in the case of Al2O3 chemical constituent, the unitary type of the ore deposit, out of which the analyzed bauxite samples came from. Consequently, the aluminous goethite / aluminous hematite mass ratio and the fine fraction/coarse fraction mass ratio in the alumino-goethite phase should be overall considered as the third main characteristics to define the technological value of the Sierra Leone bauxite.
Ilmenite is a minor fraction in the Sierra Leone bauxite and its technological role is null.
Silica distribution per mineralogical compounds has little technological relevance. According to the Fig. 4 (Table 6), in the samples MG and IRM E III the mineralogical compounds with silica content – 651 – are equally distributed. The IRM EII sample contains small amount of silicates and a very large amount of quartz. Differences in the SiO2 content and crystallized phases distribution in the analyzed samples can come from the bauxite source, when it refers to mineralogical compounds insoluble in alkaline solutions, or can come from deficiencies of the washing operation at source, when it refers to mineralogical compounds fast soluble in the alkaline solutions. For this reason, the total silica content, especially the kaolinite content, should be considered as the forth main characteristics to define the technological value of the Sierra Leone bauxite (Tables 1–4 and 8).
Distribution of Al 2 O 3 and Fe 2 O 3 as mineralogical phases of the red mud is shown in the Fig. 5, 6. Hence, the largest part of the aluminium present in the red mud which came from the MG sample processing is trapped in alumino-goethite (approximate percents: 70 %). The rest of alumina in residue is distributed in equal percents between gibbsite, aluminous hematite, katoite (formed by sodalite or cancrinite transformation in reaction with lime in the red mud washing line) and minor quantities of unconverted sodalite. The iron in the red mud is incorporated in alumino-goethite and aluminous hematite (Fig. 6). The ratio between the two compounds is the same as in bauxite, because none of these mineralogical compounds undergoes chemical transformations during the bauxite processing. Since in the Bayer process from the raw bauxite only the gibbsite is fully dissolved, the titan compounds concentration in the red mud is increasing. But, this does not modify the ratio between the major compounds of the red mud – alumino-goethite and aluminous hematite.
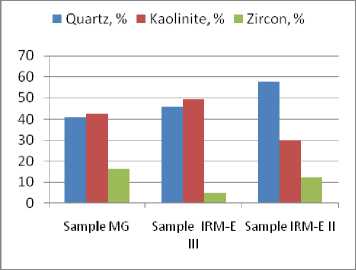
Fig. 4. Distribution of the chemical constituent SiO 2 in the bauxite crystallized mineralogical phases containing SiO 2
Table 8. SiO 2 and CaO content in the red mud crystalline phases
|
Crystalline phase / SiO 2 , % / % |
SiO 2 |
Crystalline phase /CaO, % / % |
CaO |
||
|
Phases / SiO 2 , % / % |
Total SiO 2 , % |
Phases / CaO, % / % |
Total CaO, % |
||
|
Quartz / SiO 2 |
0.392 / 0.392 |
31.6 |
- |
- |
- |
|
Katoite / SiO 2 |
2.506 / 0.374 |
— 30.1 |
— Calcite / CaO |
1.012/0.566 |
28.9 |
|
Sodalite / SiO 2 |
2.315 / 0.476 |
38.3 |
Katoite / Cao |
2.505/1.39 |
71.1 |
|
Total SiO 2 |
1.242 |
100 |
Total CaO |
1.956 |
100 |
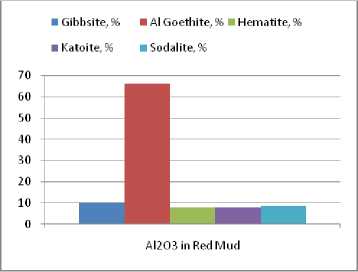
Fig. 5. Distribution of the chemical constituent Al 2 O 3 in the red mud crystallized mineralogical phases containing Al 2 O 3
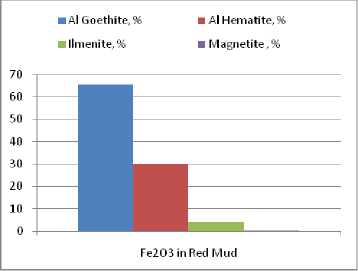
Fig. 6. Distribution of the chemical constituent Fe 2 O 3 in the red mud crystallized mineralogical phases containing Fe 2 O 3
Summarizing, the conclusions coming out from the red mud mineralogical study can suggest significant modifications of the technological process.
Blockage of the largest part of the alumina present in the red mud in alumino-goethite and aluminous hematite, conservation of the two compounds ratios in the red mud without major chemical transformations during the bauxite processing, as well as the katoite formation with significant losses of aluminium due to the excess of calcium in the mud washing process are major operational problems in Bayer technology. These features should be overall considered as the fifth main characteristics to define the technological value of the Sierra Leone bauxite.
In the Table 9 and 10 there are presented two kinds of comparison of obtained data with the two analysis methods – DRXP and XRF- for both bauxites and red mud. In the Table 9 are given the comparison data for all bauxite samples.
The DRXP analysis enabled the calculation of crystalline chemical compounds concentrations. The Al2O3 concentration (gibbsite) is obviously lower than the total concentration of Al2O3 (as the XRF data shows). Difference between the two values accounts for Al 2 O 3 (amorphous) concentration. This value is almost equal in the MG and IRM E III bauxites (15.5 and, respectively, 16.5 %) and much lower in IRM E II (10.0 %).
Concerning the XRF analysis, the difference between the sums of the major compound concentrations is below 100 %, and the difference is the overall concentration of the other chemical compounds.
Concerning the DRXP analysis, the calculation is the same, but accounting for in the terms of crystalline phase proportions.
Values from the Table 9 (last calculation row) there are obtained from adding to the total concentration of the crystalline mineralogical compounds the Al2O3 (amorphous) concentration. From this table, it can be noticed that the differences representing the concentrations of other compounds than the major constituents, according to the DRXP analysis are close in plus or in minus to the same values, according to the XRF analysis.
This particular feature in bauxite and red mud composition may be used to make some considerations about the amorphous phase chemical composition. So far, the differences between the – 653 –
XRF and DRXP analysis data for MG bauxite and the red mud coming from the bauxite, converted in the terms of chemical constituents, are accounted as amorphous phases and recorded as total difference in last line of the Table 11.
Table 9. Bauxites composition. Comparison between the obtained data with the two analysis methods: DRXP and XRF
|
Components |
Sample MG, mineralogical phases, % |
Sample MG, XRF, % |
Sample IRM E III mineralogical phases, % |
Sample IRM E III, XRF, % |
Sample IRM E II, mineralogical phases, % |
Sample IRM EII, XRF, % |
|
Al 2 O 3 |
32,5 (gibbsite) |
48.7 |
26.7 (gibbsite) |
42.91 |
40.2 |
50.29 |
|
Fe 2 O 3 |
18.5 |
20.3 |
23.8 |
21.75 |
23.8 |
18.07 |
|
SiO 2 |
21.5 |
3.36 |
4.0 |
9.03 |
1.4 |
2.24 |
|
CaO |
0.01 |
0.01 |
0.01 |
0.01 |
0.01 |
0.01 |
|
TiO 2 |
0.34 |
1.53 |
0.54 |
2.3 |
0.3 |
1.38 |
|
Al 2 O 3 (amorphous) |
15.5 |
- |
16.5 |
- |
10.0 |
- |
|
Difference |
31.5 |
26.1 |
28.3 |
24 |
24.3 |
28 |
Table 10. Red mud composition. Comparison between the obtained data with the two analysis methods: DRXP and XRF
|
Mineralogical phase / Chemical component |
RM, DRXP, Mineral components, % |
RM, DRXP, Chemical components, % |
RM, XRF, Chemical components, % |
|
Gibbsite |
1.25 |
- |
- |
|
Goethite |
35.31 |
- |
- |
|
Hematite |
12.46 |
- |
- |
|
Al 2 O 3 |
- |
8.81 |
19.35 |
|
Fe 2 O 3 |
- |
27.88 |
45.95 |
|
Sodalite |
2.31 |
- |
- |
|
Na 2 O |
- |
0.56 |
3.38 |
|
Quartz |
0.39 |
- |
- |
|
Katoite |
2.51 |
- |
- |
|
SiO 2 |
- |
1.63 |
9.30 |
|
Calcite |
1.01 |
- |
- |
|
CaO |
- |
1.61 |
4.91 |
|
Rutile |
0.76 |
- |
- |
|
Anatase |
0.5 |
- |
- |
|
Ilmenite |
3.15 |
- |
- |
|
TiO 2 |
- |
2.25 |
|
|
Al 2 O 3 (amorphous) |
10.5 |
- |
- |
|
Difference |
29.8 |
14.31 |
Table11. Bauxite MG and red mud composition. Comparison between DRXP and XRF data
|
MP/ CC |
Bauxite, DRXP, from which the MP, % |
Bauxite, XRF, from which the total CC, % |
RM, DRXP, from which the CC in CF, % |
RM, XRF, from which the total CC, % |
|
Al 2 O 3 |
32.5 (gibbsite) |
48.07 |
8.81 |
19.35 |
|
Fe 2 O 3 |
18.5 |
20.30 |
27.88 |
45.95 |
|
Na 2 O |
- |
- |
0.56 |
3.38 |
|
SiO 2 |
2.15 |
3.36 |
1.63 |
9.30 |
|
CaO |
0.01 |
0.01 |
1.61 |
4.91 |
|
TiO 2 |
0.34 |
1.53 |
1.66 |
2.25 |
|
Al 2 O 3 (amorphous) |
15.5 |
- |
10.54 |
- |
|
Difference |
31.0 |
26.73 |
47.31 |
14.31 |
|
MP – minralogical phases ; CC – chemical constituents; CF – crystaline phases |
Mass balance of the chemical constituents in DRXP data and respectively, in XRF data shows that all the main chemical constituents coexists in both materials as crystalline and amorphous phases. Because the available alumina in Sierra Leone sample was found 37.0 % and the gibbsite crystalline phase in bauxite accounts for 32.5 %, is reasonable to conclude the difference 37.0 – 32.5 = 4.5 % come from the amorphous phases containing soluble Al 2 O 3 . So far, it could be roughly accepted that the amorphous phases contain the same chemical constituents as the crystalline phases. This is an important bauxite property, because the crystalline gibbsite may react with Bayer liquors with different rates than the amorphous phases containing Al2O3.
Conclusions
-
1. Sierra Leone bauxite and the red mud coming from this type of bauxite processing were thoroughly investigated by DRXP and XRF analysis for full characterization as chemical and mineralogical composition.
-
2. There were found 5 mineralogical and chemical particularities with significant meanings in defining the technological value of the Sierra Leone bauxite.
-
3. The entire mass of Fe2O3 was found only in solid solutions: alumino-goethite and aluminous hemaite. These compounds incorporate large quantities of unusable Al 2 O 3 .
-
4. All the chemical constituents of Sierra Leone bauxite are laying in both in crystalline and amorphous state.
-
5. A significant mass of amorphous phases are accompanying the well defined mineralogical phases in both bauxite and red mud.
-
6. From the bauxite and red mud mineralogy, it can be concluded that Sierra Leone bauxite processing implies significant changes in the applied Bayer technology, namely: improving bauxite preparation process at source, changing process parameters in desilication and digestion processes and maybe hastening the investments in red mud filtration.
References Full analysis of Sierra Leone bauxite and possibilities of bauxite residue filtration
- PS X -Procedura Specifica pentru Analiza Calitativa de Faza prin Difracţie cu Radiaţii X pe Pulberi, document intern INCDMN
- IL DRXP -Instrucţiuni de Lucru pentru Difractometrul cu Radiaţii X BRUKER Tip D8 -ADVANCE, document intern INCDMN
- DIFFRACplus BASIC Evaluation Package EVA 12 Relese 2006, User’s Manual, © Bruker AXS GmbH, 2006, Karlsruhe, Germany
- ICDD database, Powder Diffraction File, edited by International Centre for Diffraction Data
- IL X 01 -Instrucţiune de lucru pentru Alinierea Difractometrului cu Radiaţii X BRUKER Tip D8 -ADVANCE în Confi guraţie Bragg -Brentano, document intern INCDMNR
- IL X 02 -Instrucţiune de Lucru pentru Recalibrare a Difractometrului cu Radiaţii X Bruker Tip D8 -ADVANCE, document intern INCDMNR
- Certificate of Analysis, Standard Reference Material1976, Instrument Sensitivity Standard for X-Ray Powder Diffraction, National Institute of Standards & Technology
- DIFFRACplus TOPAS Version 3.0, User’s Manual, © Bruker AXS GmbH, 2005, Karlsruhe, Germany
- DIFFRACplus TOPAS Version 3.0, Tutorial, © Bruker AXS GmbH, 2005, Karlsruhe, Germany
- Grazulis S., Chateigner D., Downs R.T., Yokochi A.F.T., Quiros M., Lutterotti L., Manakova E., Butkus J., Moeck P. and A. Le Bail. Crystallography Open Database -an open-access collection of crystal structures, J. Appl. Cryst. 2009. N. 42, 726-729
- Downs R.T., Hall-Wallace. M. The American Mineralogist Crystal Structure Database, American Mineralogist. 2003. N. 88, 247-250
- Cheary R.W., Coelho A.A. A fundamental Parameters Approach of X-Ray Line-Profile Fitting, J. Appl. Cryst. 1992. N. 25, 109-121
- Cheary R.W., Coelho A.A., Cline J. P. Fundamental Parameters Line Pofile fi tting in Laboratory Diffactometers, J. Res. Natl. Inst. Stand. Technl. 2004. N. 109, 1-25
- O’Connor B.H., Ravewen M.D. Application of Rietweld refinement procedure in assaying powder mixture, Powder Diffr. 1988. N. 3, 2-6
- Madsen I.C., Scarlett N.V.Y. Powder diffraction. Theory and Practice, chap.11, edited by R.E. Dinnerbier and S.L. J., Billinge 2008, Cambridge Royal Society of Chemistry, Cambridge, UK
- Gan B.K., Madsen I.C., Hockridge J.G. In situ X-ray diffraction of the transformation of gibbsite to alpha-alumina through calcination: effect of particle size and heating rate, J. Appl. Cryst. 2009. N. 42, 697-705
