Fuzzy Clustering of Educational Data with Automated Selection of Processing Parameters in System Analysis of Quality Education

Author: Zhengbing Hu, Oleksandr Derevyanchuk, Serhiy Balovsyak, Yuriy Ushenko, Hanna Kravchenko, Iryna Sapsai
Journal: International Journal of Modern Education and Computer Science @ijmecs
Article in issue: 4 vol.17, 2025.
Free access
Clustering of educational data was performed in the space of two parameters using the K-Means method. Students who are characterized by grades in certain types of activities were used as objects of clustering. Software for fuzzy data clustering is implemented in the Python language in the Google Colab cloud service. The obtained clusters are described by fuzzy Gaussian membership functions, which allowed to reliably determine the membership of each object to a certain cluster, even if the clusters do not have clear boundaries. Due to clustering, the most important characteristics of the educational process for a certain task are obtained, that is, this is how Data Manning tasks are solved. Fuzzy membership functions implemented using the scikit-fuzzy library. The developed program can also be used for educational purposes, as it allows a better understanding of the principles of cluster analysis and fuzzy logic. The correctness of the work of the developed program was confirmed during the processing of test educational data. The determination of the number of clusters was performed by software, taking into account the intra-cluster and inter-cluster distances, as well as the shape of the clusters. Automated selection of the number of clusters and cluster boundaries allows to reduce data processing time. The developed clustering tools are designed to increase the efficiency of system analysis of quality education.
Education Technology, Clustering methods, Data Mining, Educational Data, Fuzzy Logic, K-Means, System Analysis, Quality Education
Short address: https://sciup.org/15019907
IDR: 15019907 | DOI: 10.5815/ijmecs.2025.04.07
Text of the scientific article Fuzzy Clustering of Educational Data with Automated Selection of Processing Parameters in System Analysis of Quality Education
Currently, Data Mining methods are widely used for processing educational data, since the volume of such data is constantly increasing and their manual processing is time-consuming [1, 2, 3]. For example, a common task is the analysis of student grades in certain subjects. Due to the methods of Data Manning, it is possible to automatically process large volumes of data of various types [4, 5, 6, 7, 8]. As a result of clustering, the initial set of objects (data) of a large size is divided into subsets (clusters), which allows to structure the data and purposefully process the objects of individual clusters. In particular, students or study groups are considered as objects of clustering. Each clustering object is described by a number of parameters (characteristics): grades in certain subjects, number of points for test tasks, etc. For example, when clustering students' learning outcomes, students' grades are used as indicators for clustering. In most cases, clustering is performed on the basis of two features (parameters), but clustering is also possible in the space of a larger number of parameters. A number of clustering algorithms are used, in particular, Hierarchy Algorithms, Agglomerative Nesting, Divisive Analysis [9]. Hierarchical methods include BIRCH (Balanced Iterative Reducing and Clustering using Hierarchies), which forms a tree-like structure and is effective for processing large data sets. That is, in the BIRCH method, small-sized clusters are processed at low levels of the hierarchy, and at high levels, such clusters are combined with each other. The DBSCAN method (Density-based spatial clustering of applications with noise) is effective under the condition that the clusters form dense (compact) areas in the space of their characteristics. Such methods can be used when processing data with noise [10].
A common clustering method is the K-means method, the advantages of which are simplicity of software implementation and high speed [11]. In addition, the advantage of the K-means method is its low computational (time) complexity (relative to similar methods), which is O( N ), where N is the number of objects under study [12, 13]. In comparison, for the DBSCAN method, the computational complexity is not less than O( N log N ), and the computational complexity of hierarchical clustering is not less than O( N 2 log N ) [14]. The low computational complexity of the K-means method allows for high-speed clustering of even large volumes of data ( N > 1000), i.e. the K-means method scales well for processing large data sets. Therefore, the work uses the K-Means method for data clustering, which divides the initial data into non-overlapping clusters. However, in the K-means method there is a problem of choosing the quantity of clusters. It is possible to automate the selection of the quantity of clusters, in particular, taking into account intra-cluster and inter-cluster distances. When determining the quantity of clusters, the conditions of a specific task are also taken into account; for example, if students need to be divided into three groups based on the results of their studies, then the quantity of clusters is chosen equal to the quantity of such groups. However, in most cases, the quantity of clusters needs to be determined. Cluster boundaries are described by line segments, circles, ellipses, or arcs, so it is advisable to automate the selection of cluster boundaries as well.
Cluster analysis is widely used for processing educational data, which is described in works [15, 16, 17]. Clustering methods are used to analyze of student behavioral patterns in work [15], which allows for purposeful work with different groups of students. It is shown that for the same data it is advisable to use different clustering methods, for example hierarchical methods, DBSCAN and k-means. From the obtained clustering results, the best ones are obtained, for example, according to the criteria of intra-cluster and inter-cluster distances. The paper [16] describes how the assessment of student learning outcomes is performed using clustering methods in modern educational platforms. Work [17] shows that by means of clustering of educational data it is possible to analyze and correct students' learning in electronic systems, to predict their achievements. Due to clustering, it is possible to investigate complex relationships between data of various types [18], in particular, between educational data. Work [19] describes methods of adapting the educational process to the needs of each student, the advantages of taking into account the peculiarities of student learning. The application of intellectual data analysis contributes to the improvement of educational achievements of students [20, 21, 22]. In works [23, 24, 25], the possibilities of using deep learning methods and artificial neural networks to evaluate the effectiveness of the educational process were investigated. The reviewed works show that modern clustering methods perform automatic analysis of significant volumes of educational data according to various parameters, which increases the accuracy and speed of system analysis of the quality education.
In the simplest cases, the clusters are compact and clearly separated. However, when processing educational data, clusters often overlap, which leads to the problem of separating objects at cluster boundaries. For example, if a certain student is close to the boundary of two clusters, then taking into account the student's belonging to only one cluster will lead to the loss of information about his partial belonging to the other cluster. Even a slight change in the parameter of an object located on the boundary can lead to his belonging to the other cluster. If we consider clusters as fuzzy sets, then it is possible to describe the belonging of objects on the boundary simultaneously to several clusters by fuzzy membership functions [26, 27, 28, 29]. Fuzzy logic capabilities are used to process data of various types, for example, when segmenting images. The type of fuzzy membership function should be chosen taking into account the features of the cluster shapes, which are characteristic of the studied data. Therefore, the purpose of this work is to increase the accuracy of clustering of educational data by means of fuzzy logic [26], as well as to reduce the complexity of data processing due to the automatic determination of the number and boundaries of clusters. The topic of the work is relevant, since the analysis of the results of students' learning by means of Data Manning allows improving the educational process [30].
2. Theoretical Foundations of Data Clustering Using Fuzzy Logic 2.1. Principles of data clustering
Educational data contains information about N objects, each of which is characterized by several parameters. We will perform the clustering process on the basis of 2 parameters of objects (in the space of 2 features), therefore, from all parameters, two parameters x 1 and x 2 are selected, which are the most important for a certain task [31]. Such parameters can mean, for example, the grades of N students in two subjects. The x 1 and x 2 parameters of the objects correspond to the x 1 and x 2 axes of the rectangular Cartesian coordinate system, so the data objects under study are visualized as points with coordinates ( x 1 , x 2 ).
Mathematically, objects are clustered based on their parameters x 1 ( i ) and x 2 ( i ), where i = 1,..., N . The distance ρ( i , m ) between objects with numbers i and m is calculated as the Euclidean distance or distance of city blocks (Manhattan distance). In most cases, the Euclidean distance is used. Quantification of clustering quality is performed on the basis of intra-cluster distance (1) and inter-cluster distance (2) [12-14]. For a clear separation of clusters (with minimal overlap), the average intra-cluster D IN distance should be minimal:
Din
Sj j i S m=i [C i =C m ]-P(i,m)
X’lJLlfe = ^ m ]
^ min,
where c i is the cluster number for the object with number i ; c m is the cluster number for the object with number m . For better separation of clusters, the average inter-cluster distance D OUT should be maximal:
Dour
ZiL i £ m^l [c i *c m ]'P(i.m)
Zi— l S m-i [c i ^c m ]
^ max.
The analysis of the quality of the clustering results is simplified if we use the ratio D R (3) of intra-cluster D IN distances to inter-cluster distances D OUT :
Dr — Dj/ / DoUT ^ min.
The distance ratio DR depends on the clustering method used and on the quantity of clusters. A smaller DR value means higher reliability of clustering results. However, the analysis of distances DR does not take into account the shape of the clusters. Compact clusters with a shape close to a sphere are convenient for processing. Therefore, the study of the shape of clusters was performed by analyzing their average eccentricity value EC [32], which describes the symmetric or asymmetric distribution of objects relative to the center of the cluster. To calculate the eccentricity E C , the centers of gravity of the C x1 and C x2 clusters are first calculated relative to the x 1 and x 2 coordinate axes. Discrete central moments of the cluster are calculated according to the formulas:
Hi 1 —7- Z^Ax i( i) - Cx,) ■ (x2(i) - CX)),(4)
№o —rZL(Xi()-C1)2,(5)
^o 2 — ^Zm(X)(Q-CX2 )2,(6)
L 4
where Cq is the quantity of objects in the cluster.
Eccentricity EC is calculated through discrete central moments according to the formula:
(M 20 -P 02 )2+4p li
(^ 2o +M o2 )2 '
If the shape of the cluster has a clear orientation, then E C ≈ 1; if the shape of the cluster does not have a certain orientation, then E C ≈ 0; in intermediate cases E C ≈ 0.5.
-
2.2. Using fuzzy membership functions to describe clusters
Fuzzy membership functions, for example, triangular or Gaussian, are used to determine whether a certain object belongs to clusters [26, 27]. Triangular functions are simple to implement, but Gaussian functions provide a more correct description of the belonging of objects to clusters, since they change smoothly. Mathematically, fuzzy Gaussian membership function, which depends on the x coordinate of objects, is described by the formula:
M (х, х0, о-) = ехр ( ~^ ), (8)
where x 0 is the center of the function; σ is the standard deviation.
As a result of clustering, N objects are divided into Qk clusters with numbers k = 1,..., Qk . Since during clustering, each object is described by coordinates x 1 and x 2, therefore we will introduce fuzzy membership functions µ x 1( k , dx 1) and µ x 2 ( k , d x 2 ). The fuzzy function µ x 1 ( k , d x 1 ) describes the extent to which an object belongs to cluster # k , where d x 1 is the distance of the object to the center of cluster # k by coordinate x 1 . Similarly, the fuzzy membership function µ x 2 ( k , d x 2 ) describes the degree to which an object belongs to cluster # k , where d x 2 is the distance of the object to the center of cluster # k by coordinate x 2 . The fuzzy membership function µ ρ ( k , ρ) describes the extent to which an object belongs to cluster # k , where ρ is the distance of the object to the center of cluster # k by coordinates x 1 and x 2 .
In the case of compact and symmetric clusters, it is convenient to describe their boundaries with circles (with radius Rc ) or ellipses. However, when processing educational data, the shapes of clusters are often asymmetric, so it is advisable to describe the boundaries of such clusters with arcs of circles with radii:
-
• RcL is the radius of the left arc for the cluster boundary.
-
• RcR is the radius of the right arc for the cluster boundary.
-
• RcDn is the lower arc radius for the cluster boundary.
-
• R cUp is the radius of the upper arc for the cluster boundary.
For the studied objects, their fuzzy functions of belonging to clusters with numbers k = 1,..., Q k are calculated. The measure of object belonging to the cluster with number k is calculated as the value of the fuzzy membership function µ ρ ( k , ρ) according to the formula:
^ р (к,Р ) = 1 — ^, (9)
where ρ is the distance of the object to the cluster center with number k (by coordinates x 1 , x 2 );
Rc is the cluster radius # k ; kR is the cluster size factor (for example, kR = 1.5)
The cluster size factor kR is used to adjust the overlap of clusters (if there is significant data correlation, there will be a large overlap of clusters and the value of kR should be increased). The values of the membership function lie in the range from 0 to 1. For example, if the distance ρ of the object to the center of the cluster with the number k is equal to 0, then µρ( k , ρ) = 1, that is, the object completely belongs to the cluster with the number k . If the distance ρ is equal to or greater than ( R c ∙ k R ), then µ ρ ( k , ρ) = 0, that is, the object does not belong to the cluster with number k at all.
Fuzzy membership functions are also calculated, which describe the belonging of an object to a cluster taking into account its coordinates:
-
• µ x1 ( k , d x 1 ) is a fuzzy function of the object belonging to cluster # k , where d x 1 is the distance of the object to the
center of the cluster by coordinate x 1 .
• µx2(k, dx2) is a fuzzy function of object belonging to cluster # k, where dx2 is the distance of the object to the center
3. Software Implementation
of the cluster by coordinate x 2.
The fuzzy function of belonging µx12( k , dx 1, dx 2) of an object to cluster # k by coordinates dx 1, dx 2 is calculated by the formula:
^й^ г Ц^ хг У^^й^ хт Ц^ хт УУ
M x 1 2 ( к , ^ х 1 ,^ x2 ) — г~
The values of the fuzzy membership functions µ ρ ( k , ρ), µ x12 ( k , d x 1 , d x 2 ), µ x1 ( k , d x 1 ) and µ x2 ( k , d x 2 ) can be specified by changing the cluster size factor k R , for example, for refinement of the function µ ρ ( k , ρ) in formula (9). This allows for more accurate cluster analysis for educational data.
Software implementation of fuzzy clustering of educational data is made in Python using Google Colab cloud service and Jupyter Notebook [33, 34]. In the process of clustering, N objects under study are divided into Q k clusters based on the parameters of objects x 1 and x 2 .
The developed program first reads the initial educational data (for example, student grades in certain subjects), from which two parameters ( x 1 and x 2 ) are extracted. Next, the quantity of clusters Q k is set either manually, or the program cycles through the values of Qk in the set range. For each Qk the average intra-cluster distance DIN , the average inter-cluster distance DOUT and the distance ratio DR are calculated according to formulas (1-3). Based on the distance ratio DR , a specific value of the quantity of clusters Qk is selected. Software determination of the quantity of clusters reduces the subjective factors associated with the work of the performer.
The initial data are recorded in arrays x 1( i ) and x 2( i ), where i = 1,..., N . Data clustering is performed by the k -means method, which is implemented in the KMeans( Q k ) function of the Sklearn library [35]. As a result of clustering, the number of the cluster k = 1,..., Q k to which it belongs is determined for each object. The defined cluster numbers for the objects are stored in the array N k ( i ), where i = 1,..., N . The coordinates x 1 and x 2 of their centers of gravity are calculated for the obtained clusters, which are stored in the arrays C x 1 ( k ) and C x 2 ( k ) respectively.
For each cluster k, the quantity of objects C q , the radii of the cluster boundary arcs R c , R cL , R cR , R cDn , R cUp , as well as the fuzzy membership functions pp( k , p), px1( k , d x 1 ), p x 2( k , d x2 ), p xi2 ( k , d x 1 , d x 2 ) of the object to the cluster are calculated. Gaussian fuzzy membership functions are calculated by the gaussmf() function of the scikit-fuzzy library. A characteristic feature of Gaussian membership functions is a smooth change in their values (according to the normal law), so the belonging of objects to clusters is determined correctly.
Fuzzy membership functions make it possible to calculate the degree of belonging of the studied objects to each cluster. After that, the obtained clusters, their centers, boundaries and fuzzy membership functions are visualized. Clusters with a symmetrical distribution of objects relative to the center can be distinguished by straight line segments, circles or ellipses. However, for clusters of asymmetric shape (this shape of clusters is often found in educational data processing), it is more appropriate to describe the cluster boundaries by arcs for each quadrant. This allows for more accurate spatial localization of clusters, which simplifies the visual perception of clustering results for their further analysis. Cluster boundaries are described by arcs with radii R cL , R cR , R cDn , R cUp . The values of arc radii are calculated by the coordinate descent method (with a minimum step, for example, 1) under the condition that the radii are minimal and all objects are inside the arcs of the corresponding cluster.
4. Results and Discussion
By developed program the clustering and analysis of test educational data [36] was performed, which contained the results of student learning (grades from several subjects, the values of which are in the range from 0 to 100). Data preprocessing consisted of discarding objects with missing values and outliers (anomalies) (objects whose parameter values are outside the allowable ranges), as well as normalizing clustering parameters (scaling to one range). Normalization ensures that all object parameters are taken into account equally when clustering them. At the user's discretion, data preprocessing is possible, in which objects with missing values and outliers are not removed, and their parameter values are replaced with average or interpolated values. Clustering was performed according to the "math score" ( x 1 -coordinate during clustering) and "writing score" ( x 2 -coordinate during clustering) parameters. Each of the parameters x 1 and x 2 takes N values ( N = 1000). Clustering using other parameters is performed similarly.
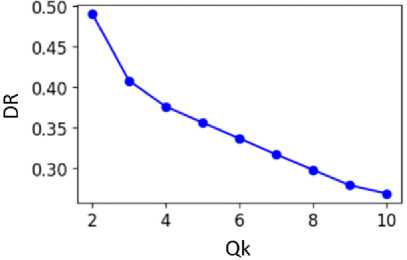
Using the K-Means method, data clustering was performed with the quantity of clusters Qk , which varied in the range from 2 to 10. For each Qk , the average intra-cluster distance DIN , the average inter-cluster distance DOUT , and the distance ratio DR were calculated (Fig. 1a). Calculations were made using Euclidean and Mathetian distances. In both cases, similar results were obtained, confirming the stability of clustering. In the following, Euclidean distance was used.
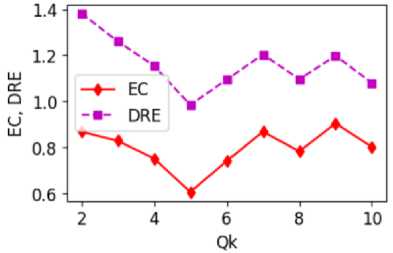
Based on the distance ratio D R , it is advisable to choose the largest value of the quantity of clusters Q k =10. An analysis of the shape of the clusters, which is described by the E C eccentricity (7) was also carried out (Fig. 1b). To select the optimal quantity of clusters Q k , the minimum refined distance ratio D RE = D R + E C was used. The clustering process was performed 10 times, as a result of which the minimum D RE value was obtained for Q k = 5 (Fig. 1b). In addition, when Q k > 5, the analysis of the obtained clusters is complicated, since in this case it is more difficult to describe the characteristics of students who, according to their assessments, entered a certain cluster. Therefore, for further clustering, the value Qk =5 was chosen, which provides a better separation of clusters (compared to smaller values of Qk ).
a)
Fig. 1. Graph of the dependence of the distance ratio DR (a), eccentricity EC and refined distance ratio DRE (b) on the quantity of clusters Qk
b)
By the help of developed software using the K-Means method obtained the following results (Fig. 2).
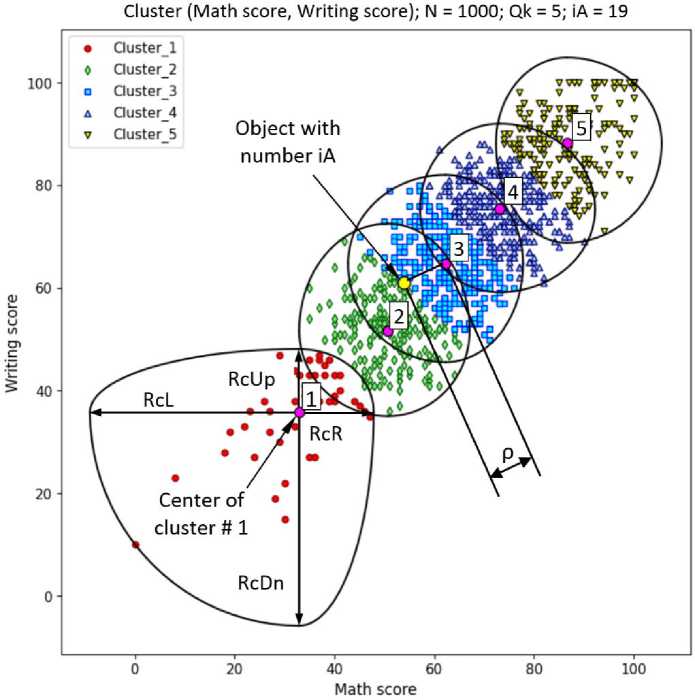
Fig. 2. The result of clustering test educational data according to the parameters "math score", "writing score"; cluster boundaries are limited by arcs with radii RcL, RcR, RcDn, RcUp
Each cluster with the number k corresponds to a set of students who are characterized by certain learning outcomes:
-
1 – low grades in mathematics and writing.
-
2 – higher than low grades in mathematics and writing.
-
3 – lower than average grades in mathematics and writing.
-
4 – average grades in mathematics and writing.
-
5 – high grades in mathematics and writing.
Based on the obtained clusters, it is possible to study the results of the educational process. The program allows to analyze the study results of a student with an i A number. For such a student, the distances to the centers of clusters with numbers k , where k = 1,..., Q k are calculated: distance d x 10 along the x coordinate, distance d x 20 along the x 2 coordinate, Euclidean distance ρ 0 . Based on the calculated distances d x 10 , d x 20 , ρ 0 the degree of student belonging to cluster k is determined as the value of the fuzzy membership functions µ x1 ( k , d x 10 ) (Fig. 3), µ x2 ( k , d x 20 ) (Fig. 4), µ ρ ( k , ρ 0 ) (Fig. 5).
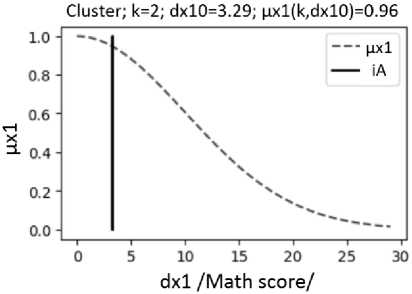
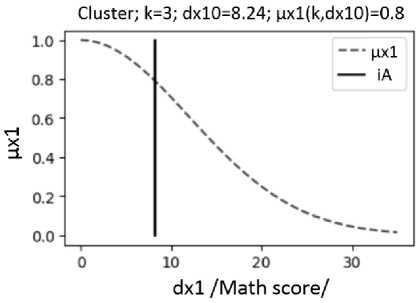
Fig. 3. Fuzzy functions of belonging µx1(k, dx1) of students to clusters with numbers k = 2, 3 according to "math score"; the vertical segment shows the value of the distance dx10 for the analyzed student with number iA =19 (Fig. 2)
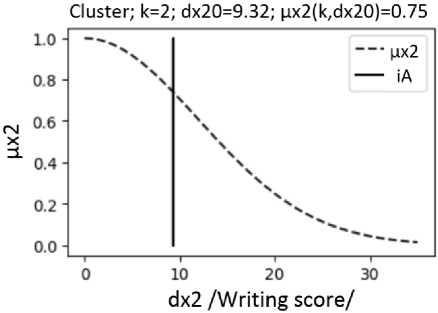
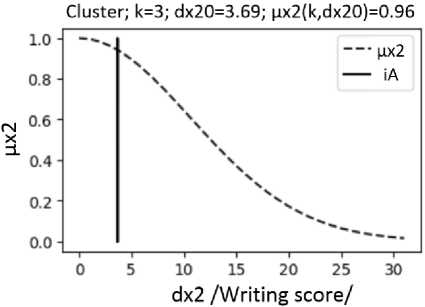
Fig. 4. Fuzzy functions of belonging µx2(k, dx2) of students to clusters with numbers k = 2, 3 according to "writing score"; the vertical segment shows the value of the distance dx20 for a student with number iA =19 (Fig. 2)
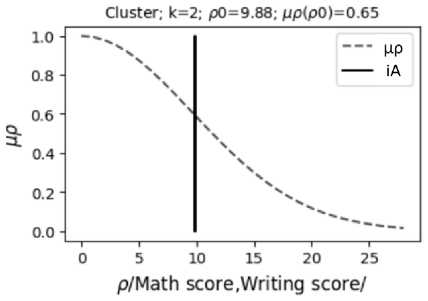
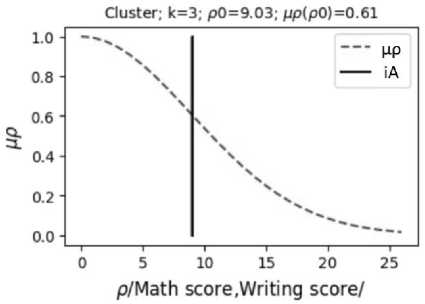
Fig. 5. Fuzzy functions of belonging µρ(k, ρ) of students to clusters with numbers k = 2, 3 based on "math score" and "reading score"; the vertical segment shows the value of the distance ρ0 for the student with number iA = 19 (Fig. 2)
With the use of fuzzy membership functions µ x1 ( k , d x 10 ) (Fig. 3) and µ x2 ( k , d x 20 ) (Fig. 4), the values of degrees of membership of the analyzed student with number i A to all clusters with numbers k (Fig. 6) were calculated as functions µ x1R ( k ) and µ x2R ( k ), respectively. With the use of fuzzy functions µ ρ ( k , ρ 0 ) (Fig. 5), the value of the degree of belonging of the analyzed student with number i A to clusters with numbers k (Fig. 7) was calculated as the value of µ ρR ( k ). The value of the degree of belonging of the student with number i A to clusters with numbers k is calculated as the value µx12R( k ) according to formula (6), using the values µx1R( k ) and µx2R( k ). Since the asymmetric form of clusters is taken into account when calculating µx12R( k ), the values of µx12R( k ) more correctly show the belonging of students to clusters (compared to µρR( k )).
Due to this, the values of µ xyR ( k ) allow accurate assessment and analysis of the student's educational achievements. For example, the analyzed student with the number iА (Fig. 7) mostly belongs to cluster 3 (µx12R(3) = 0.884) is the fuzzy set "below average math and writing scores", and to a lesser extent belongs to cluster 2 (µx12(2) = 0.861) is the fuzzy set "above low math and writing scores".
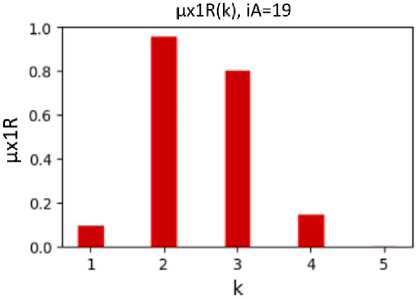
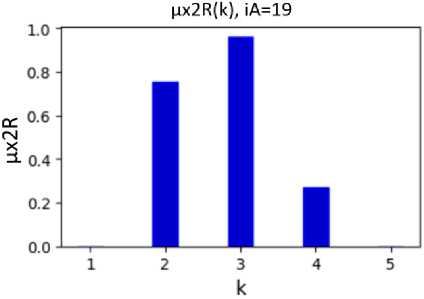
Fig. 6. The value of the degree of belonging of the analyzed student with number iА =19 (Fig. 2) to clusters with numbers k, calculated on the basis of the membership functions µx1(k, dx10) (Fig. 3) and µx2(k, dx20) (Fig. 4)
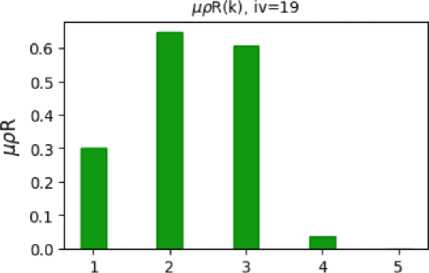
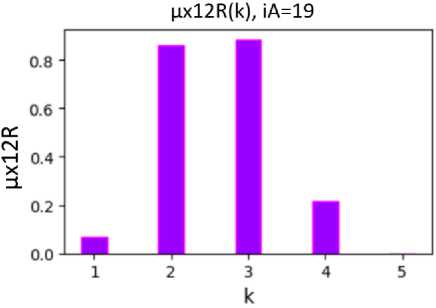
Fig. 7. The value of the degree of belonging of the analyzed student with number iА =19 (Fig. 2) to clusters with numbers k, calculated on the basis of fuzzy membership functions µρ(k, dρ0) (Fig. 5) and µx12(k, dx10, dx20) (10)
Each obtained cluster contains students with a certain level of competence, so such clustering results can be used in the educational process to determine the level of difficulty of tasks (tests, laboratory work). In real cases, students may partially belong to different clusters (which overlap), so such students are offered tasks of different levels of difficulty. For example, the analyzed student with number i А is offered tasks with difficulty level 3 and additionally tasks with level 2. The obtained clustering results are intended to increase the efficiency of the system analysis of the quality education, which involves targeted data collection, processing and adjustment of the educational process. The division of students into clusters according to their educational achievements increases the accuracy of monitoring learning outcomes. Based on the results of such monitoring, correction of individual educational trajectories of students or elements of academic disciplines is performed [37, 38]. Cluster analysis is effective in processing educational data of various types: scores in academic disciplines, test results [39] and learning styles [40, 41], etc.
5. Conclusions
Software tools for fuzzy clustering of educational data have been developed, which is an integral part of the system analysis of the quality education. The clustering program was implemented in Python on the Google Colab cloud service. The developed program uses the scikit-learn library for clustering, and the scikit-fuzzy library for working with fuzzy functions. Clustering was performed using the K-Means method in the space of two features, which were used to evaluate students in certain subjects. Automated determination of the number of clusters and their boundaries based on intra-cluster and inter-cluster distances made it possible to minimize subjective factors and reduce data processing time.
The novelty of the work is the description of objects belonging to clusters by their own fuzzy Gaussian functions µρ, µx1, µx2 and µx12, which makes it possible to correctly determine the belonging of objects to several clusters.
Testing of the developed program when processing real educational data showed correct results. The use of fuzzy membership functions made it possible to correctly calculate the degree of belonging of the studied objects to several clusters, even if the objects are located on the borders of the clusters. Cluster analysis of students' educational achievements allows to individually determine the recommended level of difficulty of tasks for each student. The developed program can also be used for educational purposes when studying the principles of clustering and fuzzy logic.
