Gamma-ray compton spectroscopy of tungsten using 662 KeV gamma-ray radiation

Author: Hamouda Samir A.
Journal: Инженерные технологии и системы @vestnik-mrsu
Section: Физика
Article in issue: 2, 2016.
Free access
Compton profile measurement of Tungsten polycrystalline sample has been performed with 662 KeV y-radiation from a cesium-137 source scattered at 900. The Spectrometer calibration and data corrections for the high energy experiment are discussed. The data are compared with the augmented-plane-wave (APW) band theoretical Compton profile of Tungsten. Theoretical predictions show the band theory overestimates the momentum density at low momenta and underestimates it at intermediate momenta. The discrepancies between experiment and theory were attributed to some non-local exchange-correlation effects and the spin-orbital interaction effect which were neglected in the theoretical calculation.
High energy gamma-ray spectroscopy, methods and technologies, characterization techniques, modelling and materials theory, compton scattering, and detection techniques
Short address: https://sciup.org/14720209
IDR: 14720209 | UDC: 620.22:678.742.2:66.094.942 | DOI: 10.15507/0236-2910.026.201602.211-217
Комптоновская гамма-спектроскопия вольфрама с использованием гамма-излучения 662 КэВ
В статье описывается комптоновское измерение профиля вольфрамового поликристаллического образца, выполненное с помощью гамма-излучения мощностью 662 КэВ от источника цезий-137, с углом рассеяния 900. В качестве обсуждения приводятся калибровка спектрометра и данные поправки на высокие энергии эксперимента. Полученные данные сравниваются с зоной присоединенной плоской волны (ППВ) теоретического комптоновского профиля вольфрама. Теоретические прогнозы показывают, что зонная теория переоценивает плотность импульса при малых импульсах и недооценивает его при промежуточных импульсах. Расхождения между экспериментом и теорией были отнесены к некоторым нелокальным обменно-корреляционным эффектам и влиянию спин-орбитального взаимодействия, которые не были учтены при теоретическом расчете.
Text of the scientific article Gamma-ray compton spectroscopy of tungsten using 662 KeV gamma-ray radiation
Compton scattering is a technique for obtaining an experimental measure of the momentum distribution of electrons in materials [1 – 2]. The scattering from a distribution of moving electrons is Doppler-broadened due to the motion of the target electrons. This broadened line shape, referred to as the Compton profile, J ( pz ), is defined within the impulse approximation [3] as the projection of the ground state electron momentum density distribution, ρ( p ), along the scattering vector (assigned as the z axis). and is given by;
J(pz) = ∫ ∫ n( px, py, pz) dpxdpy. (1)
The impulse approximation implies that the energy transfer is much larger than the one-electron binding energies. However the conditions imposed by the impulse approximation had made Compton profile measurements to be restricted to materials of low atomic number Z when using low gamma-ray energies [4 – 5].
To extend the applicability of Compton profile measurements to materials of higher atomic number Z while maintaining the validity of the impulse approximation, together with overcoming the practical limitation imposed by the photoelectric absorption require the use of high gamma-ray energies [6]. For 662 KeV gamma ray radiation, the Compton cross section is greater than the photoelectric cross section up to about Z = 90 see DuBard [7]. Since the theoretical Compton profile has already been computed for Tungsten (Z = 74) by Papanicolaou et. al. [8] using the wave functions from self-consistent augmented-plane-wave (APW) method. It was therefore thought to be of interest to measure the Compton profile of Tungsten in order to provide a possible check for the new APW theoretical calculation.
An outline of this paper is as follows: Sec. 2 describes briefly the experimental procedure and other experimental aspects of the measurement. Sec. 3 presents the experiment and data analysis. Sec. 4 discusses experimental and theoretical results, followed by some concluding remarks.
The experimental procedure
The experimental setup used in this study is shown in figure1, and can be described as follows: γ-rays from a 10 Ci 137Cs (662 KeV) source scatter from a sample through a mean angle of 900. The scattered radiation is detected by a HpGe detector [9].
A photon entering the detector generates an electrical pulse which was converted to a voltage pulse proportional to the initial photon energy by the detector pre-amplifier. The output pulses are fed to the amplifier at which they are reshaped and transmitted to the Analogue to Digital Converter (ADC). Finally the energy and counts of photons recorded spectrum are stored in a MultiChannel Analyzer (MCA).
Using the 133-Ba point source lines, the relative efficiency of the HpGe detector was found to be 10 % at the Compton line (288 KeV). The energy resolution of the detector was measured using the 133-Ba point source lines in the energy range from 53 KeV to 384 KeV. At the Compton line the energy resolution of the detector was found to be FWHM = 0.33 a.u. Which corresponds to FWHM = 750 KeV. The geometrical resolution of the Compton scattered radiation was approximated as FWHM = 0.5 a.u. (1a.u. of momentum is 2.0x10⁻²⁴ kg m s-1). By combining the detector resolution function and the geometrical resolution function an overall experimental resolution function of
FWHM = 0.6 a.u was obtained
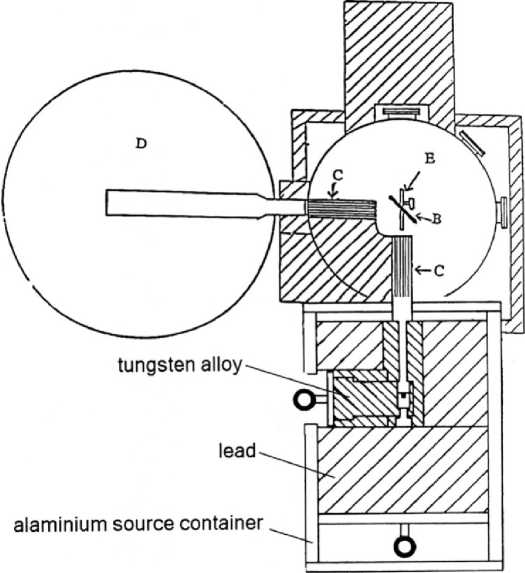
F i g. 1. Schematic diagram for the 137-Cs 10 Ci Compton spectrometer. (B) sample position, (C) soller slits type collimators, (D) HpGe detector, and (E) goniometer
Р и с. 1. Схема устройства комптоновского спектрометра на цезии-137 мощностью 10 кюри. (В) – примерное положение, (С) – цели коллиматорного типа, (D) – HPGe-детектор и (Е) – гониометр
The experiment
The sample used in this experiment was a 20 mm x 40 mm x 1 mm Tungsten polycrystalline sample which has a density of 19.3 grams/cm3. In this measurement 40,000 counts were collected at the peak channel and 8 x 10⁶ counts under the Compton peak (-10 a.u. to +10 a.u.). The multichannel analyzer channel width was 89 eV which corresponds to 0.04 a.u. The statistical error at the Compton peak was 0.5 % and 0.3 % at J(0). The background spectrum was measured (with no sample in position) and time scaled with measurement. The signal-to-background ratio at the Compton peak was 73:1. Before the data can be interpreted, a series of energy dependent corrections have to be applied. Our data reduction procedures were adapted from the software package created by the Compton group at the University of Warwick [10–14]. These were applied to the measured data and the corrected data was extracted on a momentum scale (pz) division of 0.1 a.u.
The multiple scattering contribution under the Compton profile from -10 a.u. to +10 a.u was 11 %. The mul-

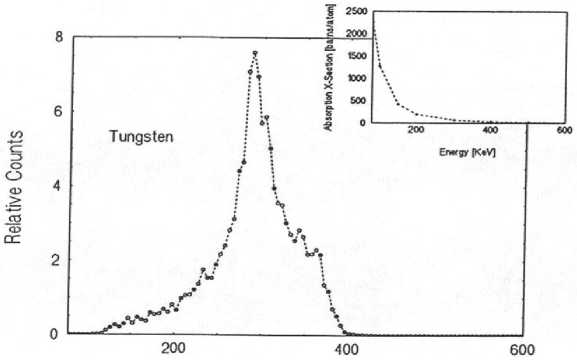
tiple scattering in the sample is calculated by a Monte Carlo simulation originally developed by [15]. The correction for multiple scattering in the sample is performed by subtracting the simulated spectra of the multiply scattered photons [16] from the experimental profile. The spectral distribution of the multiply scattered photons from tungsten sample shown in figure 2. contained 2 x 10⁴ photons from an input of 38 million photons. After correction for multiple scattering the Compton profile was normalized to the free atom profile value of 60.4901 in the momentum range from -10 a.u. to +10 a.u. [17].
Energy [KeV]
F i g. 2. The multiple scattering distribution from tungsten at 900 scattering angle with 662 KeV incident photon
Р и с. 2. Многократное распределение рассеяния из вольфрама под углом 900 с падающего фотона излучением 662 КэВ
Results and Discussion
The experimental profile was normalized to the free atom profile value of 30.2475 in the momentum range from 0.0 a.u. to 10 a.u. and then compared with the APW calculation of Papanicolaou et al [8] which was convoluted with 0.60 a.u. to mimic the experimental resolution and normalized to the same area. Figure 3. shows the difference between the APW calculation and the experimental Compton profile of tungsten.
It can be seen from figure 3. that there is a significant difference between the APW calculation and the experimental result. The most obvious feature of this comparison is the excess of electron momentum density for the APW calculation at low momenta (pz < 1 a.u.). The difference between the APW calculation and the experimental profile amounts to 7.3 % at J(0). On the other hand the APW calculation appears to underestimate the electron momentum density at the intermediate momenta (1.0 a.u. < pz < 3 a.u.). However, above 3 a.u. the APW calculation is in good agreement with experiment.
The discrepancies between APW calculation and experiment were attributed to some non-local exchange-correlation effects and the spin-orbital interaction effect. All these effects were neglected in the APW calculation of Papanicolaou et al [8]. The nonlocal exchange-correlation effects which are not included in the local density approximation may affect the electron momentum distribution since the delocalization of the d electrons was shown to increase from V to Ta see Chang et al. [18].
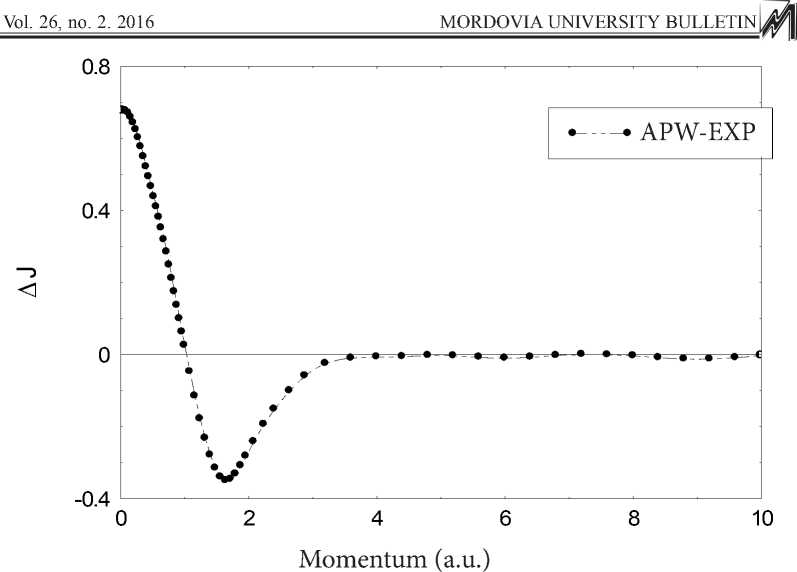
F i g. 3. The difference between the APW theory and experimental Compton profile of tungsten measured with 662 KeV radiation
Р и с. 3. Различие между теорией аугментной плоской волны и экспериментальным профилем Комптона вольфрама, измеренным излучением 662 КэВ
The spin-orbital interaction has been investigated through the Hamiltonian of H=ξl.s. by Bacalis et al. [19] and found that the coupling constant ξ to increase with the mass of the element and the average splitting of the d state. This implies that a correction of the spin-orbital interaction for Compton profile may appear larger with an increase of the mass of the element. This may well be applied to the case of tungsten. In a recent work on tungsten, Rozing et al. [20] have suggested that the spin-orbital coupling may affect the Fermi surface and hence the electron momentum distribution. All these effects were neglected in the APW calculation of Papanicolaou et al. [8].
Therefore, the non-local exchange effect and the spin-orbital interaction correction are necessary to correct the band structure theory to bring it closer to experiment. The theoretical and experimental Compton profiles of tungsten are summarized in table.
T a b l e
Т а б л и ц а
Experimental and theoretical Compton profiles of tungsten. The theoretical profiles have been convoluted with a Gaussian of FWHM = 0.60 a.u. to mimic the experimental resolution half width
Экспериментальные и теоретические комптоновские профили вольфрама. Теоретические профили были свернуты с гауссовой полной шириной на уровне половинной амплитуды, равной 0,60 a.u., чтобы сымитировать экпериментальное разрешение полуширины
|
P. |
EXP. |
APW |
Free Atom |
|
0.0 |
8.646 ± 0.027 |
9.322 |
10.09 |
|
0.1 |
8.618 |
9.292 |
9.994 |
|
0.2 |
8.560 |
9.203 |
9.727 |
|
0.3 |
8.473 |
9.062 |
9.342 |
|
0.4 |
8.355 |
8.876 |
8.903 |
|
0.5 |
8.199 |
8.651 |
8.464 |
|
0.6 |
8.012 |
8.393 |
8.061 |
|
0.7 |
7.803 |
8.105 |
7.699 |
|
0.8 |
7.584 |
7.791 |
7.375 |
|
0.9 |
7.336 |
7.454 |
7.075 |
|
1.0 |
7.077 |
7.102 |
6.788 |
|
1.2 |
6.542 |
6.394 |
6.231 |
|
1.4 |
6.019 |
5.740 |
5.698 |
|
1.6 |
5.534 |
5.187 |
5.215 |
|
1.8 |
5.082 |
4.754 |
4.802 |
|
2.0 |
4.688 |
4.419 |
4.461 |
|
2.4 |
4.118 |
3.966 |
3.969 |
|
3.0 |
3.531 |
3.488 |
3.495 |
|
4.0 |
2.84 ± 0.015 |
2.853 |
2.859 |
|
5.0 |
2.236 |
2.239 |
2.245 |
|
6.0 |
1.747 |
1.737 |
1.728 |
|
7.0 |
1.359 |
1.358 |
1.364 |
|
8.0 |
1.102 |
1.098 |
1.102 |
|
9.0 |
0.908 |
0.912 |
0.914 |
|
10.0 |
0.785 ± 0.007 |
0.782 |
0.783 |
Conclusions
In this paper the performance of the high energy (662 keV) gamma-ray 137Cs 10 Ci Compton spectrometer was tested and its quality was assessed. This was done by measuring the Compton profile of tungsten and compared with the available theoretical models. Despite the reasonable resolution of the present system comparison between experimental data and the theoretical model can be made and the discrepancies can be revealed and distinguished. This has been demonstrated in the measurements made on tungsten discussed above. This allows the use of this system to study a wide range of high Z-materials and their alloys.
References Gamma-ray compton spectroscopy of tungsten using 662 KeV gamma-ray radiation
- Williams B, editor. Compton Scattering. New York: McGraw-Hill; 1977.
- Cooper MJ. Compton Scattering and electron momentum determination. Rep. Prog. Phys. 1985; 48:415-
- Available from: http://citeseerx.ist.psu.edu/viewdoc/download?doi=10.1.1.131.970&rep=rep1&type=pdf.
- Eisenberger P, Platzmann PM. Compton Scattering of x-ray from Bound. Electrons Phys Rev. 1970; A2:415.
- Andrejczuk A, Dobrzynski L, Zukowski E, Cooper MJ, Hamouda SA, Latuszkiewicz J. Compton Scattering Studies of Charge Transfer in Fe-Ni-B Amorphous Alloys. J. Phys: Condens Matter: 1992; 4:2735-2745. Available from: http://iopscience.iop.org/article/10.1088/0953-8984/4/10/033/pdf.
- Ahuja BL, Sharma MD, Sharma BK, Hamouda SA, Cooper MJ. Compton Study of the Electronic State in Fe-Ni Alloys. Physica Scripta. 1998; 58:185-188. Available from: http://iopscience.iop.org/arti-cle/10.1088/0031-8949/58/2/014/pdf.
- Ahuja BL, Sharma MD. Performance of 20 Ci 137Cs y-ray Compton Spectrometer for the Study of Momentum Densities. Pramana -J. Phys. 2005; 1(65):137-145.
- DuBard JL, Compton Profile Measurements of Aluminum and Iron with 662 KeV y-radiation. Phil. Mag., 1978; B37:273-283.
- Papanicolaou NI, Bacalis NC, Papaconstantopoulos DA. Handbook of Calculated Electron Momentum Distribution, Compton Profiles and X-Ray Form Factors of Elemental Solids. Florida: CRC press; 1991.
- Hamouda SA. A 137-Cs Spectrometer for Compton Scattering studies Industrial Research Journal. 2007; 22.
- Timms DN. Ph.D. Thesis (unpublished). Warwick: University of Warwick; 1989.
- Hamouda SA. Detector Efficiency Correction for High Energy y-ray Compton Scattering Studies. Journal of Sciences Garyounis University: Second Symposium. 2005:236.
- Hamouda SA. The influence of the Detector Response Function of Gamma-Ray Spectrometer on the asymmetry ofCompton Profiles. AL-NAWAH, Scientific Magazine Issued by Nuclear Research Center. 2008; 7(11):66.
- Hamouda SA. Geometrical and Source Broadening Corrections for High Gamma-Ray Compton Spectrometer. AL-NAWAH, Scientific Magazine Issued by Nuclear Research Center. 2010; 9(13):48.
- Hamouda SA. Data Reduction for High Gamma-ray Compton Scattering. The 4th International Conference "Current Problems in Nuclear Physics and Atomic Energy". Kyiv: NPAE; 2012.
- Felsteiner J, Pattison P, Cooper MJ. Phil Mag. 1974; 30:537.
- Hamouda SA, Sergiwa SS. Multiple Scattering Correction for High Gamma-Ray Compton Experiments'The 2nd International Conference on Science and Technology JIPMA 2009/MATERIAUX 2009. IOP Conf Series: Material Science and Engineering. 2010; 13:1.
- Biggs F, Mendelsohn LB, Mann JB. Atomic Data and Nuclear Data. 1975; 16:201-309.
- Chang CN, Shu YM, Liu HF. The Compton Profiles of Tantalum. J Phys: Condens Matter. 1993; 5:5371.
- Bacalis NC, Blathras K, Thomaides P, Papaconstantopoulos DA. Various Approximations in Augmented-Plane-Wave Calculations. Phys Rev. 1985; B13:2292.
- Rozing GJ, Mijnarends PE, Benedek R. Fully Relativistic Calculation of Two-Photon Momentum Distribution for Positron Annihilation in Tungsten. Phys Rev. 1991; B43:6996.
