General assessment of the effectiveness of social sphere financing in Russia's regions

Author: Chichkanov Valerii P., Chistova Elena V., Tyrsin Aleksandr N.
Journal: Economic and Social Changes: Facts, Trends, Forecast @volnc-esc-en
Section: Public finance
Article in issue: 5 (59) т.11, 2018.
Free access
The paper presents an approach to assessing the effectiveness of social sphere financing (healthcare, education, housing and utilities sector) in regions of Russia. In the framework of the study, we test the following hypothesis: when the socio-economic situation in a region gets better, the effectiveness of social sphere financing in it reduces. The methodology for studying the effectiveness of social sphere financing in regions with different levels of socio-economic development is based on assessing the dependence of the dynamics of the indicators achieved by them and the amount of budget expenditures. To carry out the assessment, we select nine resulting indicators of the functioning of social sectors, taking into account the list of indicators for assessing the effectiveness of performance of executive authorities of constituent entities of the Russian Federation (the list was approved in November 2017 by the decree of the President of the Russian Federation) and on the basis of the presence of a statistical relation between them and the Human Development Index as a final indicator...
Efficiency of financing, quality of life, region of Russia, social sphere, multidimensional correlation analysis
Short address: https://sciup.org/147224103
IDR: 147224103 | UDC: 338.24 | DOI: 10.15838/esc.2018.5.59.6
Text of the scientific article General assessment of the effectiveness of social sphere financing in Russia's regions
In conditions when regions are getting considerable independence, the need for effective management of financial flows at the regional level increases. All the more so that now there is a certain destabilization of regional budgets, which is caused, in particular, by the implementation of the May Decrees, since they now bear the main load of additional expenses. According to the estimates by N.V. Zubarevich [1], regional budgets covered 70% of the costs in pursuance of the Decrees in 2013 and 2014, and 80% – in 2015. Moreover, according to the research carried out by Vologda Research Center of RAS [2], the imbalance of territorial budget systems was predetermined by the actions aimed to optimize the tax burden of major taxpayers. This situation certainly leads to tight budget constraints, which actualizes the research on the effectiveness of the use of budgetary resources of the regions [3-5], as an additional “funding source”.
Classical analysis of the economic efficiency of financial investments involves evaluating the ratio of results and costs in monetary terms. However, in practice, it is difficult to assess the effectiveness of budget spending with such an approach, especially when it comes to the social sphere. As a rule, socially significant results are achieved by joint actions of many authorities
[6]. That is why there exist certain difficulties in determining the impact of a particular item of expenditure on the quality of life as the final indicator of social sphere financing.
Since 2007, at the state level, there is a system for assessing the effectiveness of the work of the executive authorities of constituent entities of the Russian Federation1, including a list of key indicators of socio-economic development. During this period, the system has been improved more than once. Since 2012, the method of effectiveness assessment has been simplified, the list of indicators has been reduced, the calculation of ineffective costs has been canceled, the accounting of average annual values of indicators has been introduced, which made the monitoring of effectiveness assessment more understandable and goal-oriented [7]. However, this technique was criticized by the academia. First of all, researchers [8] note the terminological inaccuracy in the approach to the concept of effectiveness. According to the approved methodology, the subject of evaluation is the results of the work of the executive authorities of the Russian Federation, rather than their effectiveness. The evaluation of effectiveness should be based on the balance between the results and the resources used to achieve them. In addition, scientists engaged in debates concerning the indicators of the performance evaluation system. It was noted that there was an unnecessary large number of indicators, which often duplicated each other, which did not have a clear methodology of calculations and did not reflect an objective picture of a particular sector [7]. Also, a number of researchers [9–10] criticized the composition of indicators, as some indicators were focused not on the interests of the population, but rather on the reporting of the region. In order to improve the system of assessing the effectiveness of regional authorities, a new list of indicators was approved in November 20172, and earlier decrees of the President of Russia were declared invalid. This list, in addition to statistical indicators (life expectancy, total fertility rate, etc.), includes people’s sociological assessments (their assessment of the effectiveness of activities, assessment of conditions for selfrealization, etc.).
The results of assessing the effectiveness of executive authorities of the Russian Federation are used to build a rating of regions, which characterizes the quality of life in them. Also, this assessment serves as a basis for the provision of grants in order to promote and encourage the achievement of best values of the indicators in constituent entities of the Russian Federation. In accordance with the rules adopted in April 20183, the number of regions that can receive grants on the basis of evaluation results has been increased from 20 to 40. And the amount of grants will be determined depending on the number of residents in the region and the index of budget expenditures of the region. However, long-standing socio-economic differences between regions have a significant impact on the final assessment of the effectiveness of regional authorities [11]. A region, with a high level of socio-economic development can take a high place in the ranking even if the effectiveness of its financial investments is low. We agree with Yu.P. Voronov, who argues that any procedural flaw in the rating technique will distort the general idea of the quality of management and may potentially harm the relevant constituent entities of Russia in cooperation with the federal authorities [12]. Thus, when dealing with the problem of interregional comparison [13-14], this approach to assessment can distort the real situation. In this regard, our study tests the hypothesis, which is as follows: when the socio-economic situation in the region improves, the effectiveness of social sphere financing in it is reduced.
Methodology and research data
The methodology for studying the effectiveness of financing of the social sphere in regions with different levels of development is based on the assessment of the dynamics of the indicators achieved by them and the amount of budget expenditures. The study was conducted on the example of social sectors financing, because on the one hand, the main objective of the authorities is to improve people’s quality of life [15-16]. On the other hand, from the point of view of society and the state as an institution of protection of the interests of the nation, the purpose of investments in the development of the social sphere is the growth of human capital [17]. In the framework of the present study, the human development index (HDI), a widespread indicator, was used as a general indicator of the quality of life in the region, because, as many researchers note [18-20], it is a simple and multidimensional indicator of development of the territory. On the basis of the recently approved list of indicators for assessing the effectiveness of executive authorities of constituent entities of the Russian Federation, we selected nine resulting indicators of the functioning of social sectors (indicators of socio-economic development in the region). The list of indicators used for modeling is presented in Table 1.
The condition for the selection of the resulting indicators of financing the social sphere of regions, in addition to their
Table 1. Indicators used in modeling the effectiveness of social financing in regions with different levels of development
|
# |
Indicator, unit of measurement |
Shorthand name |
|
General indicator of region’s development |
||
|
1 |
HDI, points |
IND |
|
Indicators of social sphere financing in the region |
||
|
2 |
Healthcare expenditures of the consolidated budget of a constituent entity of the Russian Federation and territorial state extra-budgetary fund, rubles per person |
X 1 |
|
3 |
Education expenditures of the consolidated budget of a constituent entity of the Russian Federation and territorial state extra-budgetary fund, rubles per person |
X 2 |
|
4 |
Housing and utilities expenditures of the consolidated budget of a constituent entity of the Russian Federation and territorial state extra-budgetary fund, rubles per person |
X 3 |
|
Resulting indicators of regional socio-economic development |
||
|
5 |
Life expectancy at birth, years |
Y 1 |
|
6 |
Average per capita cash income, rubles |
Y 2 |
|
7 |
The cost of a fixed set of consumer goods and services at the end of the year, rubles |
Y 3 |
|
8 |
Population with cash income below the subsistence level, % of the total population |
Y 4 |
|
9 |
Total fertility rate, units |
Y 5 |
|
10 |
Number of registered crimes, cases per 100 thousand population |
Y 6 |
|
11 |
Gross regional product per capita, rubles |
Y 7 |
|
12 |
Unemployment rate (according to ILO methodology), % |
Y 8 |
|
13 |
Mortality from external causes, persons per 100 thousand population |
Y 9 |
widespread use as indicators of the quality of life (and in legal documents, as well), was the presence of a statistical relationship between them and HDI. We conducted a discriminant analysis [21] for the annual data of the resulting indicators Y 1, Y 2, ... , Y 9 for three groups ( IND = 1, IND = 2, IND = 3) for the retrospective period. The results showed the sustained recognition of the three groups. Incorrect recognition for each group was limited to an average of 5% of the regions adjacent to the other group; this fact is acceptable and understandable, since the HDI values in these cases were close, and sometimes they even coincided among the neighboring border regions from different groups. Discriminant data analysis was carried out in Statistica package.
In order to take into account the regional specifics of development in assessing the effectiveness of social sphere financing, we grouped constituent entities of the Russian Federation on the basis of the value of HDI. To ensure statistical sustainability of the results when building the model, we did not take into account 17 subjects of the Russian Federation with the highest and lowest values of HDI and with abnormal values or with missing statistical data on certain indicators. Thus, the model includes 68 subjects of the Russian Federation, divided into three groups – 23 subjects in the first group (low HDI values), 23 subjects in the second group (average HDI values), and 22 subjects in the third group (high HDI values). Since the regions develop unequally, the composition of the group during the reporting period changes depending on the values of HDI. The second group turned out to be the most “mobile”. Table 2 shows typical representatives of each group (those subjects of the Russian Federation that “retained their position” in the group during the period under consideration).
The values of the indicators for the model are calculated or taken directly from the statistical reports of the Federal State Statistics Service, the Federal Treasury and the reports of the Analytical Center under the Government of the Russian Federation.
Mathematical model representing the relationship between the indicators of financing and the resulting indicators
To model the relationship between the financing of health, education and the housing and utilities sector and the resulting indicators, we use multivariate correlation analysis. We have random vectors: X =( X 1, X 2, X 3) – the indicators of social sphere financing in the region; Y =( Y 1, Y 2,…, Y 9) – the resulting indicators of regional socio-economic development; Z = X и Y = ( XbX 2, X 3 , Y 1 , Y , ,..., Y 9) - all the indicators. Checking the sample data for the normality of the distribution as a whole showed the consistency of this statistical hypothesis. Therefore, we believe that the vectors can be considered as Gaussian.
Table 2. Typical representatives of the group of subjects of the Russian Federation that are used in modeling the effectiveness of social sphere financing in regions with different levels of development
|
Group |
RF subjects |
|
First group of RF subjects with low HDI values |
Republic of Adygea, Republic of Altai, Altai Krai, Republic of Buryatia, Kabardino-Balkar Republic, Republic of Kalmykia, Republic of Mari El, Amur Oblast, Bryansk Oblast, Vladimir Oblast, Ivanovo Oblast, Pskov Oblast, Tver Oblast, Jewish Autonomous Oblast |
|
Second group of RF subjects with average HDI values |
Kaliningrad Oblast, Oryol Oblast, Ryazan Oblast, Ulyanovsk Oblast |
|
Third group of RF subjects with high HDI values |
Republic of Komi, Republic of Tatarstan, Udmurt Republic, Krasnodar Krai, Krasnoyarsk Krai, Belgorod Oblast, Lipetsk Oblast, Omsk Oblast, Orenburg Oblast, Samara Oblast, Sverdlovsk Oblast, Tomsk Oblast, Yaroslavl Oblast |
The estimation of the closeness of correlation between the components of the Gaussian random vector U is found as [22]:
D e ( U ) = 1 - R u I1' m , (1)
where m – the dimension of the vector U , RU – the correlation matrix of the random vector U .
The formula (1) numerically assesses how closely the components of the multidimensional random variable U are connected with each other, given the fact that 0 < D e ( U ) < 1 . We note that De ( U )=0 corresponds to the case of mutual linear uncorrelatedness of the value U 1, U 2,…, Um and De ( U )=1 if and only if at least two random variables Ui and Uj are linearly dependent functionally [23].
According to (1), we have:
D e ( X ) = 1 — R x ^'3 ,
D e ( Y ) = 1 - Ry I1'9 , (2)
D e ( Z ) = 1 - Rz I1'12.
The formula (1) allows us to estimate the closeness of the correlation between the components of the Gaussian random vector. To assess the closeness of the correlation between the two Gaussian vectors U and V with the dimensions m and l, the study [24] suggests the ratio:
De ( U , V ) = 1
⎜⎛ RU ∪ V
⎜⎝ R U ⋅ R V
⎞ m + l ⎟⎟ ⎠
The ratio De ( U , V ) complies with the following properties:
-
1. 0 < D e ( U , V ) < 1 .
-
2. The case De ( U , V )=0 corresponds to the lack of correlation between U and V .
-
3. The case De ( U , V )=1 means that there is a functional relationship between U and V , i.e. at least one component of the vector V is
-
4. De ( U , V )= De ( V , U ).
functionally related to the components of the vector U .
According to (3), we have:
D e ( X , Y ) = 1
⎜⎛ R Z
⎜⎝ R X ⋅ R Y
\ 1'6
⎟⎟⎞
⎠
Results of the modeling
The effectiveness of social sphere financing in regions with different levels of socio-economic development was assessed over a ten-year period, from 2007 to 2016. First, let us study the stability of the regions’ presence in three groups. The results are shown in Table 3 .
After that, we use the formulas (2) to determine the closeness of the correlation between the indicators of social sphere financing in the region (vector X ) and between the indicators of socio-economic development in the region (vector Y ). The results of assessing the closeness of the correlation between De ( X ) and De ( Y ) for each group and overall for all groups are shown in Table 4 .
Having analyzed the results given in Tables 3 and 4, we can formulate the following conclusions.
-
1. When HDI increases, the closeness of the correlation between the indicators of social sphere financing in the region increases, too. This means that the financing of the social sphere in the developed regions is more coordinated.
-
2. When HDI increases, the closeness of the correlation between the resulting indicators of regional socio-economic development decreases. This can be explained by the slowdown in the coordinated development of regions4. This conclusion is consistent with the
Table 3. Assessment of the stability of the regions’ presence in three groups
Indicator
First group
Second group
Third group
Proportion of regions included in the group at least once in the ten-year period, %
51.5
58.8
51.5
Share of regions included in the same group at least seven times in the ten-year period, %
30.9
26.5
27.9
Table 4. Results of assessing the closeness of the correlation between the indicators of social sphere financing in the region and the indicators of regional socio-economic development
Year
D e ( X )
D e ( Y )
First group
Second group
Third group
All groups
First group
Second group
Third group
All groups
2007
0.381
0.481
0.530
0.428
0.621
0.644
0.558
0.516
2008
0.430
0.486
0.406
0.433
0.599
0.617
0.571
0.502
2009
0.381
0.474
0.397
0.427
0.665
0.570
0.525
0.504
2010
0.489
0.234
0.551
0.389
0.655
0.560
0.494
0.488
2011
0.488
0.423
0.470
0.437
0.661
0.604
0.567
0.521
2012
0.467
0.425
0.604
0.511
0.685
0.599
0.528
0.534
2013
0.464
0.633
0.622
0.534
0.658
0.591
0.567
0.534
2014
0.398
0.672
0.530
0.498
0.590
0.635
0.575
0.478
2015
0.531
0.527
0.616
0.454
0.590
0.561
0.557
0.499
2016
0.367
0.461
0.597
0.420
0.592
0.590
0.527
0.509
Average
0.440
0.481
0.532
0.453
0.632
0.597
0.547
0.509
-
3. Thus, we observe opposite trends in the closeness of the correlation between the indicators of social sphere financing in the region and the resulting indicators of regional socio-economic development with the change in HDI.
results of Table 3, which show a high instability of regions in the same group, especially for the first and second groups.
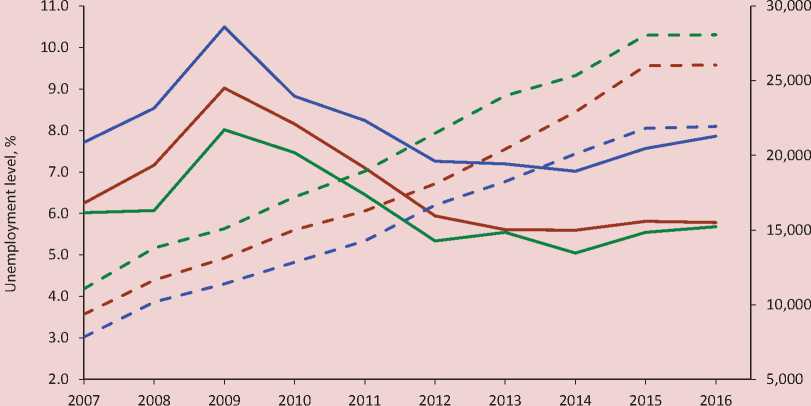
Next, we use the formula (4) to determine the closeness of the correlation between the financing of healthcare, education and housing and the resulting indicators for the three groups of regions and the average for them. The results are shown in Figure 1 .
The obtained estimates of the closeness of the correlation between the resulting indicators and the indicators of financing show that the efficiency of budget spending on average in the regions is low, but we observe its general increase in the period under consideration. At the same time, the correlation between the indicators in the context of individual groups of regions is stronger, especially in the group of regions with low HDI values (first group), which indicates a higher efficiency of their budget spending.
The simulated dynamics of the closeness coefficients for the selected groups of regions vividly reflects the macroeconomic shocks and political decisions adopted for the analyzed year. Depending on the events and trends in Russia, we can distinguish five periods.
The first period, which describes the results of the assessment for the year 2007, is characterized by inertial positive dynamics of socio-economic development of the regions; such dynamics were observed from the beginning of the 2000s. By this time, unemployment continued to reduce. People’s well-being was gradually increasing; by 2007, real wages reached their maximum level (117.2% compared to the previous year) [25]. The dynamics of changes in the level of
-
Figure 1. Results of assessing the relationship between the financing of healthcare, education and housing and the resulting indicators
0.65 -|
0.60
0.55
0.50
0.45
0.40 -
0.35 -................
0.30 -.................
0.25--
2016 2017
2014 2015
2009 2010 2011 2012 2013
2007 2008
— ■ — II group of regions
• for 3 groups of regions
♦ I group of regions
—*— III group of regions
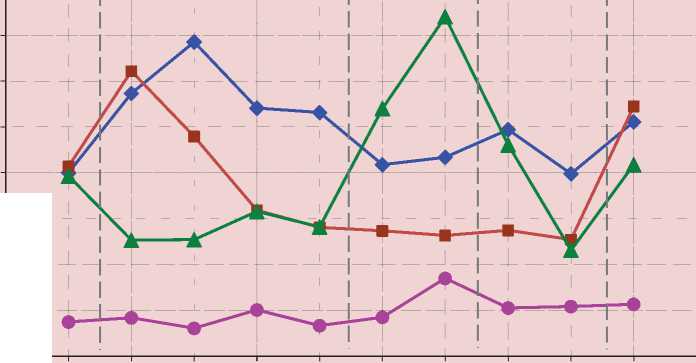
unemployment and the amount of people’s cash income in the three groups of regions is shown in Figure 2 .
Favorable economic conditions and high growth rates of budget revenues have created an opportunity to direct additional “investments in people”; priority national projects have been implemented since 2006. V. Mau [26] points out that one of the results of the positive trends of that period is an increase in the interest in the long-term problems of the country’s development based on stabilization and economic growth. In particular, in October 2007, the Concept for Demographic Policy of the Russian Federation for the period up to 2025 was adopted; it addresses socio-demographic problems and the development of human capital. The implementation of large-scale state programs with the attraction of significant funds from the federal budget had an undoubtedly positive impact on the development of facilities and infrastructure of social sectors [27] and on the quality of life in the regions5. Although, as emphasized in a number of studies [28-29], the results show a sharp regional differentiation. In general, the effectiveness of expenditures on the social sphere in 2007 was low in all groups of regions. The coefficient of closeness of correlation was approximately at the same level: from 0.447 (third group) to 0.457 (second group); however, further trends differ, which is primarily due to the external development factor.
Figure 2. Unemployment rate (solid line, left axis) and per capita cash income (dotted line, right axis), broken down by groups of regions with different levels of socio-economic development
^^— I groupofregions II group of regions III group of regions
The 2008 global financial crisis became such a factor, and its impact and implications outlined the second period. In 2008, the efficiency of financial investments in human capital in regions with low and medium HDI values (first and second groups) significantly increased (up to 0.537 and 0.561, respectively), and it decreased (to 0.377) in the group of regions with high HDI values. The crisis affected all spheres of the economy, including the social sector. By the beginning of 2009, the Russian economy entered into an industrial recession, accompanied by the depreciation of the ruble, rising unemployment and the suspension of investment programs [30]. However, the impact of the crisis on Russian regions was not uniform [31-32]. Calculations by Zubarevich [33-34] show that a strong decline was observed in the regions of metallurgical and machine-building specialization and in agglomerations. Regions of the South, the Far East and Transbaikalia, and oil-producing areas were among the least affected, and the positive dynamics were observed in the economically underdeveloped republics of the North Caucasus. This regional differentiation also affected the obtained estimates of the effectiveness of budget expenditures aimed at improving the quality of life in regions with different levels of socioeconomic development (Fig. 1).
During the crisis, social protection has become the largest and most dynamic direction of budget expenditures [35]. In order to prevent social tension, a program of anti-crisis measures was developed by March 2009, which included various aspects of social protection (pensions, social protection of families with children, support for the unemployed, etc.). According to the estimates of S. Drobyshevsky, S. Sinelnikov-Murylev and I. Sokolov [36], 1.1 trillion rubles (2.7% of GDP) were directed to anti-crisis measures in 2008, and in 2009 – 2.4 trillion rubles (6.2% of GDP) of budgetary and quasi-budgetary funds. But as the research of the Institute of Contemporary Development [30] has shown, the effectiveness of the package of anti-crisis measures, which provided for the infusion of huge funds into the economy, in some cases is not obvious. That is quite understandable, because the measures have primarily been aimed at supporting the most insecure strata of the population, rather than at the development of human capital. Therefore, the results of our assessment were quite expected for the three groups with different levels of socio-economic development. In those regions where the problems with unemployment and poverty have not been solved, the financing of anticrisis measures (additional social payments, indexation of pensions, assistance in the field of employment, etc.) provided a more efficient spending of budgetary funds. The coefficient of the closeness of correlation between the sets of results and financial indicators in the group of regions with low HDI values in 2009 increased to 0.593 (this is the maximum value for 2007–2016). Only in 2010, it began to decline after the policy of increasing public spending and commitments had been revised [36]. The decrease in the effectiveness of social sector financing in this group was observed until 2012. In the second group of regions, the coefficient decreased in 2009 and amounted to 0.490 (which also continued until 2012). In 2010–2011, the values of the coefficient in the second and third groups were approximately in the same range (from 0.390 to 0.409). For regions with high HDI values, the anti-crisis package formed by the Russian Government only mitigated the impact of the economic downturn. In 2010, as the foreign economic situation was improving and large-scale anticrisis measures were adopted, the Russian economy experienced positive dynamics. It was facilitated by the stability of the national currency, gradual recovery of consumer demand and the renewed growth of investment (largely due to the implementation of state projects)6. In the current situation in 2010, only the more prosperous regions (third group) experienced a slight increase in the effectiveness of financial investments in the social sphere. In 2010– 2011, the dynamics of the effectiveness of social sphere financing in all groups of regions was “flat” and without a sharp decline.
However, during and after the crisis, there was a significant increase in social spending of regional budgets, which was not provided by the growth of the revenue base; this fact actually led to the loss of financial independence of the regions and their dependence on intergovernmental transfers from the federal budget. According to the calculations performed at the Center for Macroeconomic Analysis and Short-Term Forecasting7, the ratio of selfsufficiency of budgets of subjects of the Russian Federation in 2011 was only 78.1%. During this period, significant amounts of gratuitous revenues were allocated not only to the regions-outsiders, whose resources to fulfill social obligations to citizens are limited, but also to the leading regions. Following the evaluation of the effectiveness of the executive authorities in 2010, grants (ranging from 63 million to 116 million rubles) were allocated to ten constituent entities of the Russian Federation. At the end of 2011, an additional mechanism was adopted to stimulate those regions that managed to achieve the best results in economic development and attracting investment. These incentive grants were allocated to 20 constituent entities of the
Russian Federation; they received from 206.8 million to two billion rubles depending on their performance. In both cases, additional funding was given to leading regions with high socio-economic potential. Such mechanisms do not help eliminate regional disparities in socio-economic development; they even reinforce this trend [37]. Therefore, it is not surprising that by 2012, according to the results of our assessment, the third group of regions significantly increased the level of efficiency of social sphere financing (Fig. 1) . The coefficients of the closeness of the correlation between the sets of resulting and financial indicators in this group of regions amounted to 0.520 in 2012.
The third period of the analysis describes 2012–2013 and is associated with the so-called “May Decrees” of the Russian President; they deal with education, science, healthcare, economy, demography, and housing and utilities services. These decrees determine the overall strategy for human capital development until 2018–2020 and contain clear social guidelines. To date, it was formally managed to execute 190 orders (out of 202) contained in the decrees8. But the experts from the non-governmental movement All-Russian People’s Front9 (ONF) whom the President of the Russian Federation asked to monitor the implementation of these decrees, believe that most of the orders that were executed need to be finalized. Their monitoring “Teacher’s salary and workload”10 has shown that the real salary of teachers is significantly lower than the official one. To achieve the targets set out in the decrees, compensations for housing and utilities services, for travelling by public transport, etc. are sometimes added to the salary of teachers. This problem is common not only among educational institutions, but also among medical institutions, because they have to find reserves to increase the salaries of employees on their own. As many researchers note11, the execution of the decrees has placed a serious burden on the budgets of the regions against the background of cuts in income tax and federal transfers. Since regional budgets were not ready for such expenditures, almost all regions had to reallocate funds for these tasks to the detriment of development budgets, in particular, investments in infrastructure and other facilities [38]. As a result of this redistribution, the effectiveness of social sphere financing in the first group of regions decreased in 2012–2013. In the prosperous regions (third group), where the funding, resources, and development opportunities are more significant, the opposite situation has developed. In 2013, the effectiveness of expenditure on social services increased dramatically to 0.620 (it is the maximum value in 2007–2016). The coefficient of closeness of the correlation between the sets of resulting and financial indicators in the second group in 2012–2013 did not change.
Serious changes in the macroeconomic situation in 2014 outlined the next period in the study of the effectiveness of social sphere financing in Russia’s regions. In 2014, the Russian economy began to decline under the influence of external factors such as the drop in oil prices on world markets, the introduction of sanctions against Russia, and Russia’s counter-sanctions. One of the most important problems of effectiveness of financing was the continuing growth of the regional budget deficit triggered by a sharp reduction in tax revenues with a simultaneous increase in expenses on social obligations on the part of Russia’s constituent entities. According to the calculations by M.A. Pecherskaya [39], by the end of 2014, the deficit of regional budget systems reached 450 billion rubles, or 6.3% to own revenues of the budgets. According to the Analytical Center under the Government of the Russian Federation12, deficits are typical primarily for the budgets of developed and mid-developed regions: in 2014, they accounted for almost 90% of the total deficit in the country, with 55% of the total revenues of regional consolidated budgets. Public debt in a number of subjects exceeded 80–100% of tax and non-tax revenues [39]. At that time, the Ministry of Finance of the Russian Federation13 set a basic task of “limiting the growth rate of budget expenditures, including those on social payments, wages, and the state apparatus, and of reaching a deficit-free federal budget in the medium term”. In 2015, the Russian Government adopted a package of anti-crisis measures, including a revision of the budget with an average reduction of the costs by 10% [40]. We agree with V.G. Basareva [41] that the result-oriented management, in fact, “is used more and more seldom”; the effectiveness of social sphere financing in the regions of Russia has been declining for 2014– 2015. Since the largest drop was observed in industrialized regions and in regions with a medium level of development14, then the more prominent decrease in effectiveness is observed in the second and third groups of regions. But in contrast to regions with medium values of HDI, where the coefficient of closeness of the correlation decreased from 0.461 to 0.387 in 2014, regions with high values of HDI and with a greater “margin of safety” reduced the efficiency of social sector financing at a later date. The coefficient of closeness of the correlation in the third group of regions decreased from 0.480 to 0.364 in 2015. The decline in the efficiency of social sphere financing in the first group of regions, which were less affected by the deterioration of the macroeconomic situation, was smoother.
In 2016, the Russian economy adapted to the new macroeconomic conditions formed in 2014–2015, and the negative trends were reversed. Leading economists [42] point out that by the beginning of 2017, the economic recession was virtually stopped, and the branches of material production and wholesale trade reached positive dynamics in 2016. By restraining the growth of spending, it was possible to control the size of the federal budget deficit and the debt of regional budgets. As noted in the Report of the Ministry of Labor and Social Protection of the Russian Federation15, despite the difficult financial and economic situation, the efforts undertaken made it possible to maintain positive trends in the sociodemographic situation and in employment, to increase the wages of certain categories of employees (healthcare, education, culture, social services, and science). Based on the data of Rosstat, the decline in certain aspects of the quality of life was moderate and “not quite critical” [43], and positive results were achieved on a number of social development indicators (Fig. 2). Given the dynamics of socio-economic indicators of the regions, which took place against the background of decreasing social spending, we can talk about the effectiveness of these costs. According to calculations, in 2016, the coefficients of closeness of the correlation between the sets of resulting and financial indicators in all the groups increased.
As the crisis phenomena are overcome, the task of promoting socio-economic development comes to the fore. In 2016, the state became interested in the implementation of longterm national projects once again. In order to improve the efficiency of the socio-economic policy of the state, and in order to implement the goals and objectives of the development strategy on the basis of the project approach, the Presidential Council for Strategic Development and Priority Projects was formed16. Priority projects include healthcare, education, mortgage and rental housing, international cooperation and exports, labor productivity, small business and support for individual entrepreneurial initiative, reform of control and supervisory activities, free-of-charge and high-quality roads, single-industry towns, and environment. Despite all the shortcomings of the project-based approach, researchers [44-45] note that it is a more rapid and flexible form of social management.
Conclusions
In general, the results of the study show low efficiency of social sphere financing. Socioeconomic development in regions is determined not so much by regional policy and the level of its financing, but by the level and characteristics of the region itself (availability of resources and favorable conditions). Judging by the estimates we have obtained, we can conclude that the effectiveness of social sphere financing for the regions with different levels of socio-economic development is clearly differentiated in periods of economic instability. The financing of anticrisis measures, the goal of which is to maintain the current situation and mitigate negative consequences rather than promote socioeconomic development, is more effective for the less developed regions of Russia. Such was the case in 2009 and 2014. The opposite pattern was observed in 2012 and 2016 in relatively prosperous regions of Russia. Therefore, as the crisis issues are being addressed and resolved in the socio-economic development of an underdeveloped region (high unemployment, ultra-high mortality, etc.), the urgency of spending on the development of human capital increases. However, this does not mean that long-term projects need to be financed only if the minimum criteria for socio-economic development are met; such projects will simply be less effective.
In stable periods of development (2007, 2016), the efficiency of social sphere financing in different regions is approximately at the same level. Therefore, as V.G. Basareva points out [46], when economic growth is slowing down, it is necessary to adjust the amount of liabilities financed from regional budgets and to take into account the existence of imbalance at a sharp increase in the deficit and public debt.
The calculations we present in the paper have shown that the correlation between the sets of resulting and financial indicators is closer in the regions with low HDI values than in the more developed regions. With the increase in the value of HDI in the region, the impact of budget financing on the quality of life of its population decreases, which is explained by the decrease in the efficiency of social sphere financing in developed regions. Therefore, as many researchers have already noted, the existing mechanism for encouraging the subjects of the Russian Federation that have reached the maximum level of socioeconomic development, without taking into account additional parameters of effectiveness of financing, is not quite fair. Thus, in the conditions of economic instability, in addition to the need for increased financing of the social sphere in the Russian regions, a significant task is to increase its effectiveness and to use available funds more rationally. According to the results of the present study, we can conclude that the policy aimed at increasing the effectiveness of social sphere financing should be tailored to suit the needs of each region.
The approach to the overall assessment of the effectiveness of financing of the social sphere that we present in the paper can be taken into account in the allocation of grants to promote and encourage the achievement of the best values of indicators in constituent entities of the Russian Federation.
References General assessment of the effectiveness of social sphere financing in Russia's regions
- Zubarevich N. It was predetermined that budgets of Russia's regions will strain themselves. Polit.ru, 2015, December 7. Available at: http://polit.ru/news/2015/12/07/regions_com/(accessed 08.06.2018)..
- Ilyin V.A., Povarova A.I. Failures of big business tax administration and their impact on regional budgets. Ekonomika regiona=Economy of Region, 2017, no. 1, pp. 25-37. DOI: 10.17059/2017-1-3
- Povarova A.I. Regional budget for 2017-2019: surplus or economic growth? Ekonomicheskie i sotsial'nye peremeny: fakty, tendentsii, prognoz=Economic and Social Changes: Facts, Trends, Forecast, 2017, vol. 10, no. 2, pp. 236-258. DOI: 10.15838/esc.2017.2.50.13
- Rudnik B.L., Romanova V.V. The budgetary financing of socio-cultural sphere. Zhurnal Novoi ekonomicheskoi assotsiatsii=Journal of the New Economic Association, 2017, no. 2 (34), pp. 124-142..
- Vasileva A. Forecast of labor migration, reproduction of population, and economic development of Russia. 4th International Multidisciplinary Scientific Conferences on Social Sciences & Arts. Conference Proceedings. 2017. August 22-31. Book 1. Vol. 4. Pp. 339-346 DOI: 10.5593/sgemsocial2017/14/S04.045
- de Bruijn H. Managing Performance in the Public Sector. London; New York: Routledge, 2002. 129 p.
- Chepus A.V., Trifonov Yu.N., Ivanov A.V., Kondratenko A.B., Bespalov S.V., Maracha V.G., Kalmykov N.N., Satyr' T.S. An estimate of the effectiveness of the executive authorities of the Russian Federation at the end of 2014. Professional'naya nauka=Professional Science, 2016, no. 3, pp. 47-74..
- Bakhtairova E.A., Derbenev E.A. Assessing activity efficiency of bodies of executive power through the example of registry services agency of Irkutsk Oblast. Elektronnyi nauchnyi zhurnal Baikal'skogo gosudarstvennogo universiteta=Baikal Research Journal, 2015, vol. 6, no. 6, p. 1..
- Lyapina I.R. Classification of regions of Russia: "performance effectiveness of socio-economic development" as the basis for classification. Vestnik TGU. Gumanitarnye nauki. Ekonomika=Vestnik TSU. Humanities. Economics, 2012, no. 4 (108), pp. 54-63..
- Bocharova A.K. Mekhanizm otsenki effektivnosti deyatel'nosti organov ispolnitel'noi vlasti sub"ektov Rossiiskoi Federatsii: preprint WP14/2012/05 . Moscw: Izd. dom Vysshei shkoly ekonomiki, 2012. 68 p.
- Petrova E.A., Shevandrin A.V., Kalinina V.V. Formation of efficiency assessment system for territorial administration. Gosudarstvennoe upravlenie. Elektronnyi vestnik=Public Administration. E-Journal, 2016, no. 54. Available at: http://e-journal.spa.msu.ru/uploads/vestnik/2016/vipusk 54._fevral_2016_g./problemi_upravlenija_teorija_i_praktika/petrova_shevandrin_kalinina.pdf (accessed 08.06.2018)..
- Voronov Yu.P. Ratings of RF units: methodical issues of their assessment. Region: Ekonomika i Sotsiologiya=Region: Economics and Sociology, 2008, no. 3, pp. 46-66..
- Suspitsyn S.A. Barometers of the general situation in regions. Problemy prognozirovaniya=Studies on Russian Economic Development, 2005, no. 2, pp. 97-111..
- Malkina M.Yu. On the issue of weighting in interregional studies (in response to K.P. Gluschenko). Prostranstvennaya ekonomika=Spatial Economics, 2016, no. 1, pp. 163-184. DOI: 10.14530/se.2016.1.163-184
- Ilyin V.A., Povarova A.I. Problems of regional development as the reflection of the effectiveness of public administration. Ekonomika regiona=Economy of Region, 2014, no. 3 (39), pp. 48-63..
- Mau V. Human capital: challenges for Russia. Social Sciences, 2013, vol. 44, no. 1. pp. 3-19.
- Bukhonova S.M., Doroshenko Yu.A. Main effects from investment in the social sector. Ekonomicheskii analiz: teoriya i praktika= Economic Analysis: Theory and Practice, 2006, no. 11, pp. 10-16..
- Sagar A.D, Najam A. The human development index: a critical review. Ecological Economics, 1998, no. 25, pp. 249-264.
- Grimm M., Harttgen K., Klasen S., Misselhorn M. A human development index by income groups. Discussion papers. Ibero America Institute for Economic Research. 2006. No. 155. Available at: https://www.econstor.eu/bitstream/10419/27445/1/52523781X.PDF (accessed 08.06.2018).
- Chakravarty S.R. A generalized Human Development Index. Review of Development Economics, 2003, vol. 7, pp. 99-114.
- Aivazyan S.A. Bukhshtaber V.M., Enyukov I.S., Meshalkin L.D. Prikladnaya statistika: Klassifikatsiya i snizhenie razmernosti . Moscow: Finansyistatistika, 1989. 607 p.
- Pena D., Rodriguez J. Descriptive measures of multivariate scatter and linear dependence. Journal of Multivariate Analysis, 2003, vol. 85, no. 2, pp. 361-374.
- Tyrsin A.N. A measure of joint correlation dependence of multidimensional random variables. Zavodskaya laboratoriya. Diagnostika materialov= Factory Laboratory. Diagnostics of Materials, 2014, vol. 80, no. 1, pp. 76-80..
- Tyrsin A.N. A measure of interdependence between random vectors of arbitrary dimensions. Obozrenie prikladnoi i promyshlennoi matematiki=Review of Applied and Industrial Mathematics, 2018, vol. 25, no. 1, pp. 72-73. Available at: http://www.tvp.ru/conferen/vsppmXIX/repso026.pdf (accessed 29.05.2018)..
- Kuklin A.A., Chistova E.V., Pyhov P.A. Measurement of welfare of the individual and areas of residence. 4th International Multidisciplinary Scientific Conference on Social Sciences and Arts SGEM 2017. 2017. Book 1. Vol. 4. Pp. 479-486 DOI: 10.5593/sgemsocial2017/14/S04.063
- Mau V. Economic policy -2007: achievements and risks. Voprosy ekonomiki=Issues of Economics, 2008, no. 2, pp. 4-25..
- Kanaeva L.P. Effectiveness of implementation of the priority national projects in a region. Regionologiya=Regionology, 2014, no. 3, pp. 14-20..
- Lezhin N.M. The main principles of the program-target approach to the development and implementation of priority national projects. Finansy i kredit=Finance and Credit, 2007, no. 17 (257), pp. 44-46..
- Loginov S.V. Main results of the priority national projects in the Ural Federal District. Ekonomika regiona=Economy of Region, 2008, no. 2, pp. 209-215..
- Yurgens I.Yu. Ekonomicheskii krizis v Rossii: ekspertnyi vzglyad . Moscow: Ekon-Inform, 2009. 112 p.
- Korobitsyn B., Kuklin A. Regional resilience of Russia to economic shocks and crisis. In: 2nd International Multidisciplinary Scientific Conference on Social Sciences and Arts SGEM. 2015. Book 2. Vol. 3. Pp. 707-714 DOI: 10.5593/SGEMSOCIAL2015/B23/S7.090
- Nikulina N.L., Pecherkina M.S. The welfare in individual and area of residence: risk assessment. In: 4th International Multidisciplinary Scientific Conference on Social Sciences and Arts SGEM 2017. Conference Proceedings. 2017. Book 1. Vol. 4. Pp. 937-944. Available at: www.sgemsocial.org DOI: 10.5593/sgemsocial2017/14/S04.121
- Zubarevich N. The way out of the crisis: regional projection. Voprosy ekonomiki=Economic Issues, 2012, no. 4, pp. 67-83.
- Zubarevich N.V. Crises in post-Soviet Russia: Regional projection. Regional Research of Russia, 2016, vol. 6, no. 2, pp. 95-104.
- Aizinova I.M. Anti-crisis measures of social protection of the population. Problemy prognozirovaniya=Studies on Russian Economic Development, 2010, no. 3 (120), pp. 93-114..
- Drobyshevskii S., Sinel'nikov-Murylev S., Sokolov I. Evolution of the budget policy of Russia in the 2000s: in search of financial stability of the national budget system. Voprosy ekonomiki=Economic Issues, 2011, no. 1, pp. 4-25..
- Soboleva G.V., Popova I.N Stimulation of regions economic development by means of budget and tax policy. Vestnik Sankt-Peterburgskogo universiteta. Ekonomika=St Petersburg University Journal of Economic Studies, 2014, no. 1, pp. 5-26..
- Petrov A.V. The gap in the budget capacity of regions and the quality of living in the Russian Federation. Vestnik Tomskogo gosudarstvennogo universiteta. Ekonomika=Tomsk State University Journal of Economics, 2015, no. 3 (31), pp. 141-154..
- Pechenskaya M.A., Povarova A.I. Regional'nye byudzhety: tendentsii, sostoyanie, perspektivy . Vologda: ISERT RAN, 2016. 110 p.
- Sinel'nikov-Murylev S.G., Radygin A.D. (Eds.). Rossiiskaya ekonomika v 2015 godu. Tendentsii i perspektivy. Vyp. 37 . Moscow: Izd-vo In-ta Gaidara, 2016. 472 p.
- Basareva V.G. Result-oriented performance in public administration. In: Babkin A.V. (Ed.). Ekonomika i menedzhment v usloviyakh global'noi konkurentsii: problemy i perspektivy: trudy nauchno-prakticheskoi konferentsii s mezhdunarodnym uchastiem . Saint Petersburg: Izd-vo Politekhn. un-ta, 2016. Pp. 16-29..
- Sinel'nikov-Murylev S.G., Radygin A.D. (Eds.). Rossiiskaya ekonomika v 2016 godu. Tendentsii i perspektivy. Vyp. 38 . Moscow: Izd-vo In-ta Gaidara, 2017. 520 p.
- Malevaya T.M. (Ed.). 2017: sotsial'nye itogi i uroki dlya ekonomicheskoi politiki . Moscow: Izdatel'skii dom "Delo" RANKhiGS, 2018. 122 p.
- Pereverzeva V.V., Yur'eva T.V. Development project in the system of strategic management. ETAP: ekonomicheskaya teoriya, analiz, praktika=ETAP: Economic Theory, Analysis, Practice, 2017, no. 4, pp. 42-52..
- Vilisov M.V. State policy: project approach. Politicheskaya nauka. Spetsvypusk=Political Science. Special Issue, 2016, pp. 110-126..
- Basareva V.G. Regions of Russia: adaptation to measures of state regulation. Region: ekonomika i sotsiologiya=Region: Economics and Sociology, 2015, no. 2 (86), pp. 29-48. DOI: 10.15372/REG20150602
