Гидрохимический анализ и корреляционные взаимосвязи растворенных ионов в пластовых водах нефтяных месторождений Верхнеассамского бассейна

Автор: Гогои Т.Д., Гогои С.Б., Сторчак Т.В., Конвар Д.
Журнал: Вестник Нижневартовского государственного университета @vestnik-nvsu
Рубрика: Экология и природопользование
Статья в выпуске: 4 (72), 2025 года.
Бесплатный доступ
Попутно добываемая вода (ПДВ) из месторождений Верхнеассамского бассейна, образующаяся в процессе разведки и добычи нефти и газа, характеризуется высоким уровнем загрязняющих веществ, включая неорганические элементы и анионы, что создает значительные экологические и медицинские риски. Для решения этих задач в данном исследовании были использованы методы диаграммы рассеяния Пайпера и корреляционного анализа с целью разработки новых корреляционных зависимостей и получения более глубокого понимания сложных взаимосвязей между указанными загрязнителями. Проведенный анализ выявил повышенные концентрации Na, Li, Sr, Pb и F, превышающие допустимые пределы, установленные Центральным советом по контролю за загрязнением Индии (CPCB), что подчеркивает их потенциальное негативное воздействие на окружающую среду и здоровье человека. В противоположность этому, элементы Cr, Cu, Mo и Ni обнаружены не были, что отражает варьирующее геохимическое влияние. В работе также исследованы роль Ca и Mg в формировании жесткости воды и образовании отложений (скейлинга), а также серьезные экологические риски, связанные с высокими уровнями Zn и Pb. Примечательно, что анализ с использованием диаграммы Пайпера позволил идентифицировать бикарбонат кальция (Ca(HCO₃)₂) в качестве преобладающего обеспечивает более четкое компонента, представление что о химическом составе воды. Корреляционный анализ, подтвержденный эмпирическими данными, указал на наличие положительной корреляции между Na и другими неорганическими параметрами с коэффициентом пропорциональности, равным 2,1 e-5. Полученные результаты подчеркивают необходимость применения advanced методов очистки для снижения чрезмерной концентрации загрязняющих веществ и повышения эффективности практик устойчивого природопользования. Проведенное environment; relationships. proportionality constant; исследование демонстрирует важность использования sophisticated аналитических методик для совершенствования экологического менеджмента и эффективности в нефтегазовой отрасли.
Загрязняющие корреляция, вещества, окружающая среда, коэффициент пропорциональности, взаимосвязи
Короткий адрес: https://sciup.org/14134405
IDR: 14134405 | УДК: 622.276.5.001.4:543 | DOI: 10.36906/2311-4444/25-4/08
Correlation Analysis and Hydrochemical Facies of Contaminant Ions in Oilfield Produced Water of the Upper Assam Basin
The oil field produced water from the Upper Assam Basin, generated during oil and gas exploration and production, contains high levels of contaminants, including inorganic elements and anions, which pose significant environment and health risks. To address these challenges, we employed the Piper class scatter plot and correlation analysis methods to develop new correlations and gain a deeper understanding of the complex relationships among these contaminants. Our analysis revealed elevated concentrations of Na, Li, Sr, Pb and F exceeding the permissible limits set by India’s Central Pollution Control Board, highlighting their potential environmental and health impacts. In contrast, Cr, Cu, Mo and Ni were absent, reflecting varying geochemical influences. The study also examined the roles of Ca and Mg in water hardness and scaling, as well as the severe environmental risks associated with high levels of Zn and Pb. Notably, the Piper class scatter plot analysis identified calcium bicarbonate Ca(HCO3)2 as the predominant component, providing a clearer view of the water’s chemical composition. Correlation analysis, supported by empirical data, indicated that Na is positively correlated with other inorganic parameters, with a proportionality constant of 2.1 e-5. These findings underscore the need for advanced treatment methods to mitigate excessive contaminants and enhance sustainable management practices. The study highlights the importance of employing sophisticated analytical techniques to improve environmental stewardship and operational efficiency in the oil and gas industry.
Текст научной статьи Гидрохимический анализ и корреляционные взаимосвязи растворенных ионов в пластовых водах нефтяных месторождений Верхнеассамского бассейна
Oil-field produced water (OFPW) constitutes the predominant volume of fluid generated during oil and gas exploration and production (E&P) operations, representing both a critical environmental challenge and a significant operational management concern [11; 17; 36; 54]. This study focuses on the Upper Assam Basin (UAB), in northeastern India, located approximately between 26° 54′ N–26° 58′ N latitude and 94° 35′ E–94° 58′ E longitude, one of India’s major onshore petroleum provinces. The UAB features a complex geological structure with productive horizons spanning the Paleocene through Miocene strata, including formations such as the Barail Main Sand (BMS), Barail Coal Shale (BCS) and Tipam Sand (TS-IV) [5; 34; 55]. These formations overlie basement rocks and are interbedded with sandstones, siltstones and mudstones, creating multiple productive pay zones with varying pressure and temperature regimes. In the studied Rudrasagar oil field, depths of 3000–3300 m, pressure gradients of 2800–4000 psi and temperature gradients of 80–110 °C are reported. With production from these mature fields having reached its peak, the volume of OFPW is rising markedly. The basin’s geological complexity, together with water-to-oil ratios exceeding 90% in certain Barail horizon wells, contributes to the generation of large quantities of OFPW [14; 16; 20; 45].

The contamination observed in these waters originates from both natural geochemical processes, including mineral dissolution from carbonate and silicate lithologies, ion exchange reactions, and subsurface brine concentration, and operational sources such as corrosion of infrastructure, chemical additives used in drilling and well-treatment, and mixing with formation (connate) waters [3; 18; 31; 38]. Understanding the specific geochemical fingerprint of UAB OFPW is essential for developing basin-specific treatment and management strategies that satisfy regulatory compliance under India’s Central Pollution Control Board (CPCB) standards, as well as for promoting sustainable environmental stewardship.
The American petroleum institute (API) estimated that approximately 18 billion barrels of OFPW were generated by the US onshore operations in 1995 [3; 26; 52]. Khatib Z. and Verbeek P. [38], indicated that the global estimates suggested an average of 77 billion barrels annually. It is estimated that onshore oil and gas wells in the United States generated approximately 21, 18, and 14 billion barrels of OFPW annually in the years 1985, 1995, and 2001, respectively [8; 25; 49]. Recent data from major oil industries of UAB further illustrate this trend, with substantial volumes reported in their sustainability reports [1; 10; 16; 55; 56].
The chemical composition of untreated OFPW is complex and influenced by factors such as geographical location, geological formation, reservoir life, and hydrocarbon type [5; 15; 22]. This complexity includes a range of inorganic elements and anions (IEA), such as sodium (Na), calcium (Ca), magnesium (Mg), arsenic (As), fluoride (F), chloride (Cl - ), sulfate (SO4 2- ), bicarbonate (HCO3 - ), and others. Understanding these constituents is essential for developing effective treatment strategies and managing environmental impacts [2; 9; 20; 23; 53].
High concentrations of both soluble and insoluble salts in OFPW can cause scaling and corrosion in pipes, as well as equipment fouling, leading to increased maintenance costs and potential equipment failure. Moreover, heavy metals present in OFPW are highly toxic to aquatic life, even at low concentrations. These metals do not readily break down and can persist in the environment for extended periods. They can also co-precipitate with other substances, complicating their separation and removal during treatment [4; 14; 19; 43]. Additionally, the Piper class scatter plot serves as a powerful tool for visualizing the ionic composition of OFPW. By plotting elements and anions on a Piper diagram, researchers can categorize water types, reveal patterns, and develop new correlations that enhance our understanding of water chemistry. This plot offers valuable insights into the interrelationship between different ionic constituents and assist to identify distinctive chemical signatures associated with various oil fields [15; 21; 29; 34].
This study aims to conduct a comprehensive analysis of the IEA present in untreated OFPW, utilizing advanced analytical techniques and Piper class scatter plots. Our objective is to develop new correlations and gain deeper insights into the chemical behaviour of OFPW. These insights will support the development of more effective treatment processes and sustainable environmental management strategies. In the subsequent sections, we will outline the methodology used for sample collection and analysis, present our findings, and discuss their implications. Through this research, we seek to enhance our understanding of OFPW chemistry and contribute to improved management practices in the oil and gas industry.
Geological setting and origin of contaminants in upper Assam basin produced water
The UAB is an intracontinental rift basin characterised by a complex stratigraphic succession that records multiple phases of marine transgression and regression. The productive intervals contain highly saline formation waters (paleowaters) that have undergone prolonged diagenesis and extensive ion-exchange processes [20; 38; 49]. The elevated concentrations of dissolved inorganic elements and anions observed in the present study are consistent with a combination of geochemical and operational processes:
-
(a) Natural dissolution processes : Interaction of subsurface waters with carbonate lithologies (limestone and dolomite) and evaporitic minerals leads to enrichment in Na⁺, Ca²⁺ and HCO3 - . The identification of Ca(HCO₃)₂ facies through Piper diagram interpretation supports a carbonate-dominated geochemical signature in these reservoirs [51; 56].
-
(b) Ion-exchange and mineral weathering : Clay water reactions and weathering of silicate minerals such as feldspar and mica contribute K, Sr and trace elements to the aqueous phase. The presence of Sr and Li is consistent with progressive mineral alteration and long residence times of formation waters in the subsurface [27; 46].
-
( c) Anthropogenic contributions: Corrosion of steel well casings, tubing and surface equipment can introduce Fe, Pb and Zn, while chemical treatment fluids used during drilling, stimulation and well maintenance may contribute F and other anions [19; 35; 53].
-
(d) Redox controlled species : The detection of low but measurable concentrations of As and Mn indicates reducing subsurface conditions in which these species occur predominantly as As³⁺ (arsenite) and Mn²⁺. The absence or near-absence of oxidised species such as chromate and molybdate further corroborates the reducing redox environment typical of petroleum reservoirs [8; 24; 49].
Materials and Methods
Sampling of OFPW. Five crude oil (CO) samples were collected from five distinct wellheads (S1, S2, S3, S4, S5) within the Rudrasagar oil field having depth, pressure gradient and temperature gradient of 3000–3300 m, 2800–4000 psi and 80–110 oC respectively. Additionally, five OFPW samples (S6, S7, S8, S9, S10) were obtained from the central dehydration system (CDS) at Digboi. Sampling was conducted monthly over a six-month period. Both CO and OFPW samples were collected using one litre polyethylene bottles that had been pre-cleaned with deionized water. For each wellhead sample, CO was pumped directly in the bottle at a controlled flow rate to ensure representative sampling. After collection, the samples were promptly transported to the laboratory within 24 hours for gravity separation. The OFPW samples were then thoroughly mixed with diethyl ether ((C 2 H 5 ) 2 O) in a separating funnel. This process resulted in a distinct separation into two layers, with the lower layer being collected for the determination of IEA [18; 39].
Subsequent analytical studies included the use of flame photometer (FP), atomic absorption spectrophotometer (AAS), inductively coupled plasma optical emission spectrophotometer (ICP-OES), and a multi parameter kit (MPK) to analyse various elements. Anion analysis was performed using titration methods (ASTM D 4458 – 15, ASTM D 3875 – 15) and gravimetric methods [22; 41]. The OFPW samples from the wellheads and CDS Digboi were analyzed within 48 hours of collection.
Analytical measurements of inorganic elements. In the FP, OFPW samples are atomized into a flame, which emits characteristic colours based on the inorganic elements (Na, K, Ca and Li) present. A photo detector, with a narrow-band filter for specific wavelengths, measures these emissions and provides a digital readout of element concentrations. Chromium (Cr), manganese (Mn), iron (Fe), copper (Cu), and As were analysed using AAS, which determines inorganic element concentrations based on their ability to absorb light at specific wavelengths [13; 20]. Before sample measurement, the AAS instrument was calibrated using a 2% HNO 3 blank solution to establish a baseline. Further, a series of standard solutions containing 1, 2, 3, and 4 ppm of As, Cr, Cu, Fe, and Mn were used to establish calibration for each metal.
ICP-OES was utilized to quantify the concentrations of magnesium (Mg), molybdenum (Mo), nickel (Ni), lead (Pb), strontium (Sr), and zinc (Zn), in OFPW by measuring the light emitted by atoms excited in an argon (Ar) plasma, where the high temperature excites the atoms and ions of the elements present. The intensity of the emitted light, which is directly proportional to the elemental concentration, was measured following calibration with standard solutions of known concentrations. Fluoride (F⁻) concentrations were determined using a MPK system equipped with an ion-selective electrode. To maintain a constant ionic strength and pH, 0.5 mL of total ionic strength adjustment buffer (TISAB) was added, and calibration was carried out using fluoride standard solutions of 0.1 ppm, 1 ppm, and 10 ppm prepared in equal proportions with the buffer [13; 20].
Analytical measurements of inorganic anions. The concentration of Cl - ions in the OFPW was determined in accordance with ASTM D 4458 – 15. The method involves the precipitation of silver chloride (AgCl) by titration with 0.01N silver nitrate (AgNO 3 ). A few drops of 2N potassium chromate (K 2 CrO 3 ) were used as an endpoint indicator. The chemical reaction at the endpoint is represented by equation 1:
AgNO 3 + NaCl → AgCl 2 + NaNO 3 (1)
HCO3- and CO32- concentrations in the OFPW sample were determined following the ASTM D 3875 – 15 standard method, using titration with 0.05N H2SO4 and employing phenolphthalein and methyl orange as indicators. SO42- was measured by titrating a 50 ml OFPW sample containing 3 drops of methyl red indicator, with H2SO4 until an orange-red color appeared. BaCl4 was then added to precipitate BaSO4, which was digested at 80–90°C. The precipitate was screened through warm distilled water until free of Cl- ions, dried in a humidifier-controlled oven at 103°C, and then cooled in a desiccator before weighing [20; 40]. The SO42- concentration was then determined using the equation 2 as follows:
SO4 2- in ppm =
Amount of BaSO4 ×411.5
Amount of OFPW sample
Results and Discussion
The concentrations of 20 IEAs obtained from 10 OFPW samples are summarized in Table 1-3. Analysing these IEAs is crucial for understanding their presence and impact on OFPW. Na concentrations in the OFPW samples ranged from 81.3 to 178.5 ppm, which are notably lower than the 3165 to 4480 ppm reported by Konwar D. et al. for the UAB oil field [40]. Potassium (K) levels were observed between 4.9 to 15.5 ppm, which also fall below the range of 39.1 to 275 ppm reported by the same study. In comparison, Li H. and Harati H.M. reported K concentrations of
-
5.8 to 8 ppm at the Wattenberg field and 59 to 64 ppm at the Al Hamada field, respectively [24; 43]. Ca concentrations in the present study ranged from 120 to 198 ppm, which is below the range of 344 to 982 ppm reported by Konwar D. et. al., but higher than the 24.2 to 34.8 ppm and 60 to 64 ppm ranges reported by Li H. and Harati H.M. for the Wattenberg and Al Hamada fields, respectively [24; 40; 43]. Mg concentrations were found to vary between 4.56 and 10.23 ppm.
Na+ and Cl - were the principal contributors to salinity and total dissolved solids (TDS), while Mg, Ca, and K contributed to a lesser extent [7; 17]. Lithium (Li) concentrations ranged from 0.54 to 1.28 ppm, Sr from 2.97 to 4.89 ppm, Fe from 0.21 to 0.48 ppm, and Zn from 0.52 to 1.29 ppm. Previous studies have reported Zn concentrations of 0.9 ppm at the Wattenberg field, and between 0.001 and 2.22 ppm at the Vafiflar field [6, 43]. Pb concentrations in the present study ranged from 0.44 to 0.78 ppm, Mn from 0.034 to 0.132 ppm, As from 0.0017 to 0.0054 ppm, and F from 4.5 to 8.7 ppm. No detectable concentrations of Cr, Mo, Cu, and Ni were observed in the OFPW samples.
Cl - concentrations in the OFPW samples ranged from 64 to 115 ppm. HCO3 - levels varied between 104 to 185 ppm, while CO3 2- concentrations ranged from 50 to 90 ppm. SO4 2- concentrations were observed within the range of 27 to 48 ppm. In comparison, Konwar D. et al. reported Cl - concentrations ranging from 0.728 to 7.158 ppm in the UAB oil field, whereas Harati H.M. and Cakmakce et al. documented higher values, ranging from 442 to 479 ppm and 3199 to 4004 ppm, in the Al Hamada oil field and Vakiflar field respectively [6; 24; 40]. The experimental values for Ca, K, Zn and Cl - were consistent with those of other researchers, but the Na values were notably lower than those reported in previous studies.
Equation 3, derived from the correlations presented in Table 2, indicates that Na is positively correlated with As, Ca, F, Fe, K, Li, Mg, Mn, Pb, Sr, Zn, Cl - , HCO3 - , SO4 2- and CO3 2- . The validity of equation 3 was confirmed through the results illustrated in Figure 1.
Na ∝ (As)(Ca)(F)(Fe)(K)(Li)(Mg)(Mn)(Pb)(Sr)(Zn)(Cl - )(HCO 3 - )(SO 4 2- )(CO 3 2- ) (3)
From equation 3, the relationship can be formulated as follows,
Na = K IEA (As)(Ca)(F)(Fe)(K)(Li)(Mg)(Mn)(Pb)(Sr)(Zn)(Cl - )(HCO 3 - )(SO 4 2- )(CO 3 2- ) (4) where,
K IEA = proportionality constant of IEA.
By applying the experimental values obtained during this research, we determined the K IEA values to be 3 e-9, 7 e-9, 1 e-7, 1 e-7, 6 e-8, 1 e-6, 1 e-6, 3 e-6, 1 e-4 and 8e-5 for samples S1 through S10, respectively. The average K IEA value from equation 4 is 2.1 e-5 which represents the proportionality constant for the IEA.
Table 1
|
Parameter |
Units |
CPCB limit |
S1 |
S2 |
S3 |
S4 |
S5 |
S6 |
S7 |
S8 |
S9 |
S10 |
|
Na |
ppm |
100 (max) |
152.8 |
178.5 |
102.5 |
148.7 |
130.6 |
95.8 |
115 |
90.2 |
84.7 |
81.3 |
|
K |
20 (max) |
15.5 |
12.3 |
9.5 |
10.8 |
8.7 |
7.7 |
8.3 |
6.5 |
5.2 |
4.9 |
|
|
Ca |
200 (max) |
198 |
185 |
148 |
157 |
168 |
146 |
149 |
131 |
120 |
126 |
|
|
Li |
0.7 (max) |
1.21 |
1.28 |
1.15 |
1.03 |
1.19 |
0.86 |
0.95 |
0.72 |
0.54 |
0.6 |
|
|
Mg |
100 (max) |
9.57 |
10.23 |
7.85 |
8.23 |
8.92 |
6.21 |
6.56 |
5.72 |
4.56 |
4.98 |
|
|
Sr |
0.1 (max) |
4.89 |
4.79 |
4.15 |
4.21 |
4.45 |
3.56 |
3.8 |
3.72 |
3.05 |
2.97 |
|
|
Fe |
1 (max) |
0.45 |
0.48 |
0.37 |
0.41 |
0.35 |
0.29 |
0.38 |
0.28 |
0.23 |
0.21 |
|
|
Zn |
2 (max) |
1.29 |
1.22 |
0.95 |
1.09 |
0.89 |
0.63 |
0.67 |
0.61 |
0.52 |
0.55 |
|
|
Pb |
0.1 (max) |
0.78 |
0.76 |
0.65 |
0.58 |
0.56 |
0.61 |
0.52 |
0.53 |
0.44 |
0.47 |
|
|
Mn |
2 (max) |
0.132 |
0.127 |
0.075 |
0.092 |
0.081 |
0.056 |
0.066 |
0.064 |
0.034 |
0.037 |
|
|
As |
0.05 (max) |
0.0054 |
0.0051 |
0.0042 |
0.0046 |
0.0048 |
0.0039 |
0.0035 |
0.0029 |
0.0017 |
0.002 |
|
|
F |
1.5 (max) |
8.7 |
8.4 |
7.2 |
7.9 |
7.5 |
5.3 |
6.2 |
6.5 |
4.5 |
4.9 |
|
|
Cr |
1 (max) |
– |
– |
– |
– |
– |
– |
– |
– |
– |
– |
|
|
Cu |
0.2 (max) |
— |
— |
— |
— |
— |
— |
— |
— |
— |
— |
|
|
Mo |
0.1 (max) |
— |
— |
— |
— |
— |
— |
— |
— |
— |
— |
|
|
Ni |
3 (max) |
– |
– |
– |
– |
– |
– |
– |
– |
– |
– |
|
|
Cl - |
1000 (max) |
115 |
113 |
91 |
77 |
108 |
88 |
74 |
79 |
69 |
64 |
|
|
HCO 3- |
200 (max) |
185 |
177 |
147 |
128 |
172 |
137 |
120 |
130 |
112 |
104 |
|
|
CO 32- |
200 (max) |
90 |
90 |
70 |
60 |
80 |
70 |
60 |
60 |
50 |
50 |
|
|
SO 42- |
100 (max) |
48 |
42 |
38 |
35 |
39 |
35 |
34 |
33 |
27 |
29 |
Correlation analysis of 16 IEAs in 10 OFPW samples
Table 2
|
Na |
K |
Ca |
Li |
Mg |
Sr |
Fe |
Zn |
Pb |
Mn |
As |
F |
Cl- |
HCO 3 - |
SO 4 2- |
CO 3 2- |
|
|
Na |
1 |
|||||||||||||||
|
K |
0.865348 |
1 |
||||||||||||||
|
Ca |
0.899404 |
0.947626 |
1 |
|||||||||||||
|
Li |
0.83613 |
0.85056 |
0.898746 |
1 |
||||||||||||
|
Mg |
0.925836 |
0.894478 |
0.945606 |
0.967548 |
1 |
Concentrations of 20 IEAs in 10 OFPW samples

|
Sr |
0.889526 |
0.919751 |
0.94386 |
0.951444 |
0.97499 |
1 |
||||||||||
|
Fe |
0.928678 |
0.919408 |
0.895594 |
0.913172 |
0.924744 |
0.931604 |
1 |
|||||||||
|
Zn |
0.912902 |
0.954712 |
0.91547 |
0.880748 |
0.945716 |
0.930975 |
0.917729 |
1 |
||||||||
|
Pb |
0.770944 |
0.915217 |
0.892376 |
0.833139 |
0.859514 |
0.866994 |
0.837289 |
0.881627 |
1 |
|||||||
|
Mn |
0.929273 |
0.962026 |
0.955089 |
0.87138 |
0.941599 |
0.959228 |
0.937024 |
0.959581 |
0.913239 |
1 |
||||||
|
As |
0.85267 |
0.898871 |
0.930297 |
0.960215 |
0.955248 |
0.95515 |
0.90136 |
0.896014 |
0.861821 |
0.901017 |
1 |
|||||
|
F |
0.882493 |
0.903071 |
0.888526 |
0.90262 |
0.946198 |
0.97147 |
0.916334 |
0.946683 |
0.817586 |
0.951025 |
0.912397 |
1 |
||||
|
Cl- |
0.743383 |
0.798903 |
0.902136 |
0.860099 |
0.887171 |
0.895044 |
0.738848 |
0.789878 |
0.863186 |
0.845087 |
0.862701 |
0.790884 |
1 |
|||
|
HCO 3 - |
0.755839 |
0.822616 |
0.911715 |
0.870222 |
0.900661 |
0.917783 |
0.757354 |
0.816408 |
0.864004 |
0.866236 |
0.874945 |
0.827332 |
0.996513 |
1 |
||
|
SO42- |
0.777252 |
0.937529 |
0.95975 |
0.893558 |
0.906128 |
0.939449 |
0.845511 |
0.884241 |
0.933485 |
0.928257 |
0.920737 |
0.883291 |
0.923551 |
0.937476 |
1 |
|
|
CO 3 2- |
0.777691 |
0.8371 |
0.930761 |
0.879652 |
0.901616 |
0.905135 |
0.788557 |
0.811785 |
0.91094 |
0.878308 |
0.887629 |
0.803086 |
0.988636 |
0.981658 |
0.946029 |
1 |
Table 3
Comparative analysis of inorganic element and anion concentrations in OFPW reported across different oilfield basins from previous research studies
|
Parameters |
Units |
Present study (n=10) |
Çakmakce et al. (2008) Vakiflar field [6] |
Harati HM (2012) Al Hamada field [24] |
Konwar et al. (2017) UAB field [40] |
Li H (2013) Wattenberg field [43] |
|
Na |
ppm |
81.3–178.5 |
3165–4480 |
— |
277–2794 |
— |
|
K |
4.9–15.5 |
– |
59–64 |
39.1–275 |
5.8–8 |
|
|
Ca |
120–198 |
– |
60–64 |
344–982 |
24.2–34.8 |
|
|
Li |
0.54–1.28 |
— |
— |
15–499.1 |
— |
|
|
Fe |
0.21–0.48 |
1.63–30 |
— |
0.024–2.47 |
— |
|
|
Zn |
0.52–1.29 |
0.001–2.22 |
– |
– |
0.9 |
|
|
Pb |
0.44–0.78 |
0.006–0.52 |
– |
– |
– |
|
|
Cl - |
64–115 |
3199–4004 |
442–479 |
0.728–7.158 |
— |
|
|
SO 42- |
27–48 |
355–390 |
– |
– |
– |
Note: Empty cells (–) indicate data not presented in the referenced study.

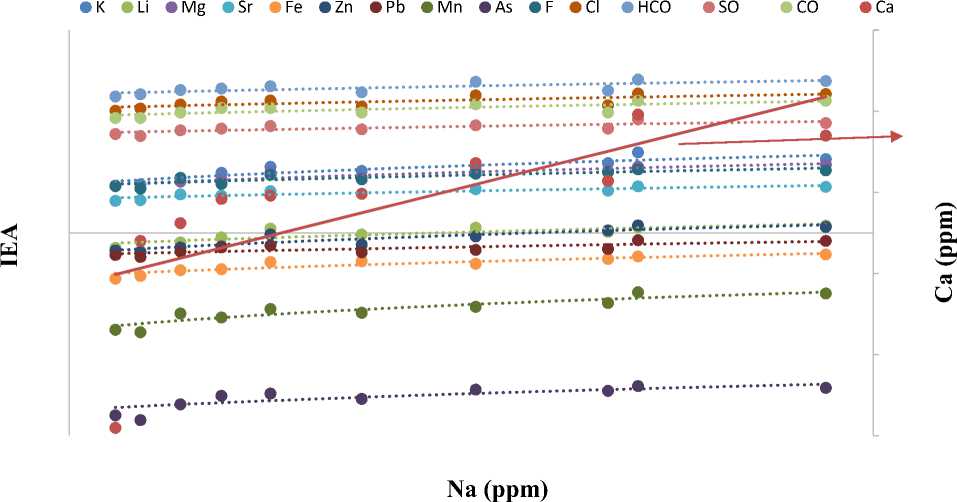
Fig. 1. Variation of 15 IEAs in response to Na concentration (ppm) across 10 OFPW samples
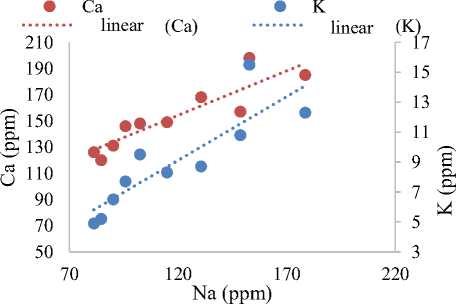
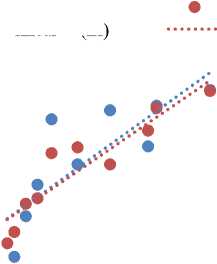
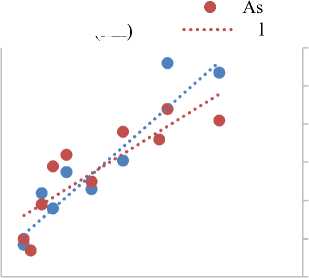
Establishing and Evaluating Relationships Between IEAs. Equation 4 was further validated by the linear trend lines presented in Figure 3 (a) – (h). The analysis revealed that Na is directly proportional to As, Ca, F, Fe, K, Li, Mg, Mn, Pb, Sr, Zn, (Cl - ),(HCO 3 - ),(SO 4 2- ) and (CO 3 2- ).
In Figure 2 (a), the relationship between Ca and K relative to Na was plotted, revealing that both Ca and K increase with Na. This analysis suggests that the concentration of Ca in the OFPW sample originates from rocks such as limestone, calcite, and dolomite is within permissible limits. Ca, a key determinant of water hardness, can affect the toxicity of other compounds and tends to precipitate at higher bicarbonate concentrations [20; 30; 37]. Similarly, the presence of K in OFPW, resulting from natural rock weathering, is consistent with these observations. In Figure 2 (b), the relationship between Sr and Mg relative to Na was plotted, showing that both Sr and Mg increase with Na. This indicates that Sr, a naturally occurring element in rocks and soil, reacts slowly with OFPW to form Sr(OH) 2 and H 2 gas. Exposure to Sr can cause serious skin reactions, seizures, and interfere with blood clotting. Likewise, Mg, which is carried into OFPW from rocks and through human activities in the E&P industries, is also naturally occurring. It is found in minerals like dolomite {CaMg(CO 3 ) 2 } and magnesite (MgCO 3 ), and contributes to water hardness [32; 42; 53].
In Figure 2 (c), the relationship between Li and Fe relative to Na was examined, showing that both Li and Fe increase with Na. This analysis indicates that the concentration of Li in OFPW is relatively low and less harmful, posing minimal threat to aquatic environments. Similarly, Fe is a critical parameter for assessing the quality of OFPW reinjection. High Fe concentrations can lead to formation plugging, pipeline blockage, corrosion, and increased turbidity of OFPW [1; 31; 35; 47; 57].

сл
£
0,45
£
й
S
0,02
£
(a)
Li linear (Li)
1,45
1,25
1,05
0,85
0,65
Fe linear
|
(Fe) |
1,4 |
|
0,55 |
|
|
1,2 |
|
|
0,45 |
1 |
|
0,35 S о щ |
^ 0,8 0,6 N |
|
0,25 |
0,4 0,2 |
|
0,15 |
Sr linear (Sr)
Mg linear (Mg)
8 £
6 ад
120 170
Na (ppm)
(b)
linear
(Zn)
Zn linear
0,75
0,65
0,55
0,45
(Pb) 0,85
Na (ppm)
£
О к
120 170
Na (ppm)
(c)
(d)
0,35
linear
(Mn)
Mn linear
0,14
0,12
0,1
0,08
0,06
0,04
0,006
0,005
0,004
0,003
0,002
(As) 0,007
120Na (ppm1)70 (e)
0,001 220
£
HCO3-linear
(HCO3-)
CO32-linear
(CO32-1) 00
£
£
120 Na (ppm17)0
о и
(Cl-)
Cl-linear
SO42-linear (SO42-) 50
120 170
Na (ppm)
(f)
40 g
30о сл
120 170
Na (ppm)
Fig. 2. Relationship between IEAs and Na concentration in 10 OFPW samples

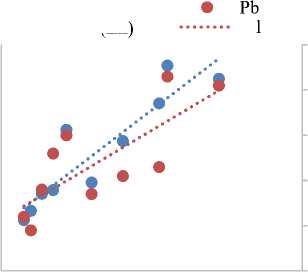
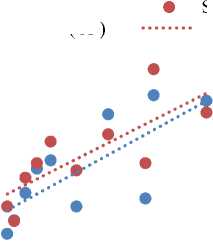
Figure 2(d) illustrates the relationship between Pb and Zn concentrations relative to Na in 10 OFPW samples, revealing a clear positive correlation. Both Pb and Zn concentrations increase proportionally with rising Na levels, suggesting a shared source or geochemical behavior under similar salinity conditions. This trend underscores the environmental risk posed by the discharge of OFPW containing elevated levels of these heavy metals. Pb and Zn are well-documented contaminants in OFPW, often originating from corrosion of galvanized steel infrastructure, well casing materials, or from chemical additives used during drilling and hydraulic fracturing operations [25; 40; 45]. The mobilization of these metals in OFPW presents a significant threat to environmental receptors. If released untreated, such effluents may contaminate surface and groundwater, negatively affecting aquatic ecosystems, altering soil chemistry, and potentially entering the food chain, posing chronic toxicity risks to both wildlife and human populations [20; 43; 56].
In Figure 2(e), the correlation between As and Mn with respect to Na is presented. Both elements exhibit increasing trends with Na concentration, indicating similar solubility or mobilization mechanisms under saline conditions. Notably, a crossover point is observed at Na = 120 ppm, where As and Mn concentrations are approximately equal. This intersection may reflect a shift in geochemical speciation or redox behavior under varying ionic strengths. Mn is known to oxidize readily in the presence of atmospheric oxygen, forming manganese oxyhydroxides that can co-precipitate with other trace metals, potentially influencing the fate and transport of contaminants in receiving environments [8; 37; 54; 57]. As, though typically present at trace levels in OFPW, is of particular concern due to its high toxicity and carcinogenicity. It often exists in multiple oxidation states, with its mobility influenced by redox potential, pH, and the presence of competing ions. The co-occurrence of Mn and As in saline produced water warrants careful monitoring, as their synergistic effects may enhance toxicity and complicate treatment processes [28; 32; 46].
Figure 2 (f), presents the relationship between Cl - and SO4 2- concentrations relative to Na in 10 OFPW samples. Both Cl - and SO4 2- exhibit increasing trends with rising Na levels, indicative of a common salinity driven behavior or shared source within the OFPW. A crossover point is observed at Na = 115 ppm, where Cl - equals SO4 2- concentrations are approximately equal, suggesting a transitional point in ionic dominance that may reflect changes in geochemical conditions or water-rock interaction dynamics. Cl - is one of the most prevalent inorganic anions in OFPW and plays a significant role in determining its overall salinity. It reacts with inorganic elements to form salts, leading to increased salinity due to high NaCl concentrations. Cl - is naturally derived from subsurface formations and, when brought to the surface, readily dissolves in aqueous phases. Under specific thermodynamic conditions, it may volatilize indirectly via aerosol formation, potentially contributing to atmospheric salt loading. SO4 2- , while less abundant than Cl - , is of critical operational and environmental importance [4; 23; 39; 56]. Its concentration in OFPW influences the risk of scale formation, particularly of low-solubility sulfate minerals such as BaSO 4 , SrSO 4 and CaSO 4 . These mineral precipitates can obstruct pipelines, production equipment, and injection wells, leading to significant maintenance and remediation costs. Accurate prediction and mitigation of such scaling tendencies require a thorough understanding of sulfate dynamics in relation to salinity, temperature, pH, and the presence of divalent cations. Moreover,
SO4 2- serves as an electron acceptor for sulfate-reducing bacteria (SRB), a group of anaerobic microorganisms commonly found in OFPW. These bacteria play a role in the biodegradation of organic compounds and the biogeochemical cycling of sulfur [27; 33; 43; 51].
Figure 2 (g) illustrates the relationship between HCO3 - and CO3 2- concentrations relative to Na in OFPW samples. The data reveal a positive correlation, with both HCO3 - and CO3 2- levels increasing alongside Na concentrations. This trend suggests a shared geochemical behavior influenced by salinity and possibly pH, and confirms that these anions are naturally occurring constituents of OFPW. Their presence is not indicative of significant interaction with carbonate rich lithologies, as such conditions would typically result in substantially higher concentrations of carbonate species due to enhanced mineral dissolution [20, 34, 47, 55]. HCO3 - and CO3 2- are key contributors to the alkalinity of OFPW and play a critical role in buffering against acidification. They are also significant due to their involvement in scale formation, where One of the most common and problematic forms is CaCO 3 , which precipitates through reactions such as that shown in equation 5 [22; 35; 44].
Ca(HCO 3 ) 2 → CaCO 3 + CO 2 + H 2 O (5)
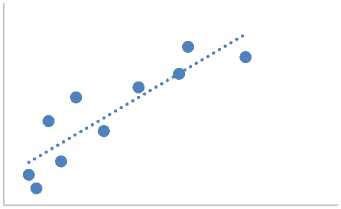
In Figure 2 (h), the relationship between F and Na was plotted, revealing that F increases with Na. This analysis suggests that elevated concentrations of F could cause eye and nose irritation upon contact with humans. Although F typically occurs in low concentrations in natural rocks, high levels of F can be harmful to the environment. It can damage or inhibit the growth of aquatic flora and fauna [48; 50; 51].
Modelling IEAs using piper class scatter plot. In figure 3, the normalized data from the three different axes of the two equilateral triangles at the bottom were projected onto the diamond plot at the top, which was divided into five classes based on Ca concentration.
-
a. In the first class, with Ca ranging from 120 to <131, two data points, (63, 42, 37, 58) and (63, 40, 37, 60), are represented by purple plus symbols.
-
b. In the second class, with Ca ranging from 131 to <148, two data points, (62, 40, 38, 60) and (64, 39, 36, 61), are shown by light blue diamond symbols.
-
c. In the third class, with Ca ranging from 148 to <157, two data points, (63, 45, 37, 55) and (62, 42, 38, 58), are marked with dark blue square symbols.
-
d. In the fourth class, with Ca ranging from 157 to <185, two data points, (63, 50, 37, 50) and (62, 45, 38, 55), are denoted by yellow circle symbols.
-
e. In the fifth class, with Ca ranging from 185 to <198.1, two data points, (64, 50, 36, 50) and (64, 45, 36, 55), are represented by red triangle symbols.
The diamond plot analysis reveals that all sample points fall within the left quadrant, indicating that Ca(HCO 3 ) 2 is the predominant component in the OFPW samples [15; 20; 29; 34; 49].

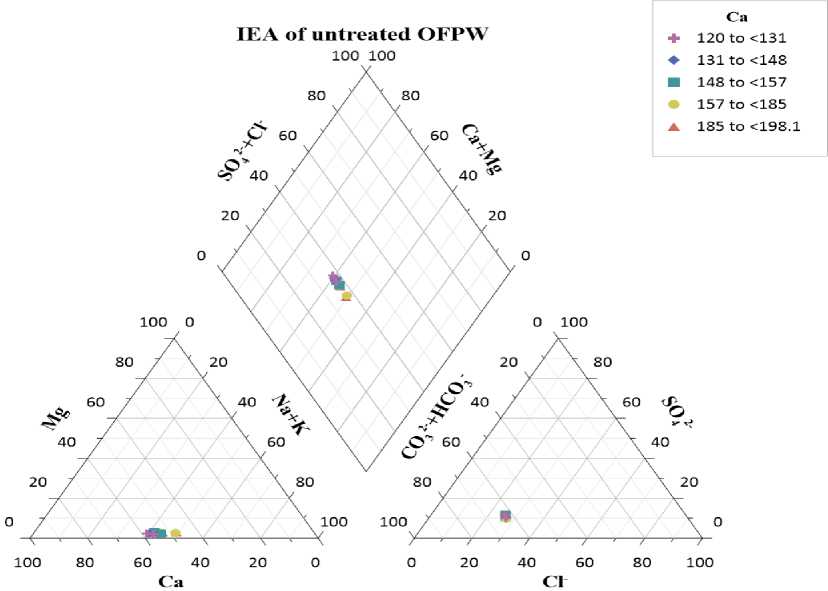
Fig. 3. Design of IEA of S1 - S10 using piper class scatter plot
Implications for water management and regulatory compliance
The elevated concentrations of Na, Li, Sr, Pb, and F observed in this study exceed the CPCB permissible limits for surface water discharge. Nevertheless, the operational water-management strategy in the UAB relies on subsurface reinjection into depleted reservoir intervals, which substantially reduces the likelihood of direct environmental and human exposure. Under these disposal conditions, the aqueous phase containing the dissolved ions remains geologically isolated from freshwater aquifers and surface ecosystems, consistent with established OFPW management practices in India and other petroleum provinces [9; 16; 25; 48].
The hydro-chemical facies classification and correlation analysis presented in this study therefore have direct operational relevance, particularly for:
-
(a) Formation Compatibility Assessment : Knowledge of the ionic composition is critical for predicting scaling potential, especially CaCO₃ and BaSO₄ precipitation, and for assessing corrosion hazards in injection tubing and well casings. The strong correlations between Na and divalent cations (Ca²⁺, Mg²⁺, Sr²⁺) indicate that high-salinity systems face an increased risk of mineral scale deposition during water–rock mixing [18; 45; 56].
-
(b) Injectivity Management : Although Fe levels remain below CPCB discharge limits, oxidation during surface handling or mixing with residual oxygen in injection lines can lead to Fe(OH) 3 precipitation, which may reduce reservoir permeability. The positive correlation between Fe and salinity suggests that periods of elevated Na warrant enhanced monitoring of Fe to minimize injectivity decline [24; 39; 42; 50].
-
( c) Contingency Planning and Emergency Response: In the unlikely event of accidental surface release or emergency discharge, the water quality characterization presented here supports rapid selection of targeted treatment technologies. The observed dominance of the Ca(HCO 3 ) 2 facies indicates that pH adjustment and chemical precipitation would be among the most efficient pretreatment approaches prior to surface disposal [20; 31].
-
(d) Regulatory Documentation and Reporting: The analytical dataset generated in this investigation provides robust and defensible evidence to demonstrate compliance with subsurface
reinjection authorization requirements under India’s Petroleum Rules and the environmental standards mandated by state pollution control boards [6; 24; 40; 53].
Conclusion
This study presents a comprehensive hydro-chemical assessment of untreated OFPW from the UAB, providing new insights into its chemical composition, hydro-chemical facies, and geochemical controls in a mature, high-salinity petroleum system. The predominance of the Ca(HCO 3 ) 2 facies confirms extensive water–rock interaction in carbonate and silicate rich lithologies, while exceedances of CPCB permissible limits for Na, Li, Sr, Pb, and F indicate the potential environmental risk associated with uncontrolled surface discharge. Notably, the correlation analysis revealed statistically robust positive relationships (r = 0.75–0.99) between Na and 15 inorganic parameters, with a proportionality constant (K IEA ) averaging 2.1 e-5. These correlations are not merely numerical artifacts but reflect fundamental geochemical controls, ion exchange on clay minerals, common ion effects, and shared source materials. The resulting linear relationships between Na and constituent ions offer a predictive capability for estimating overall water composition from salinity measurements alone, providing a practical tool for rapid field assessment.
The presence of Pb, Zn, and trace As presents credible environmental and ecological concerns under surface discharge scenarios, reinforcing the suitability of subsurface reinjection as the primary disposal practice in UAB operations. Conversely, Li and Sr, though detected at elevated levels, pose minimal toxicological risk and instead represent natural signatures of prolonged subsurface fluid–rock interaction. By integrating classical hydro-chemical techniques such as Piper trilinear diagrams with modern multivariate statistical approaches, including correlation matrices and empirical proportionality constants, this research demonstrates an effective framework for understanding and predicting OFPW behaviour in complex reservoir systems. The findings enhance operational decision making for scaling mitigation, injectivity management, and regulatory compliance, while contributing to the broader scientific knowledge base supporting environmentally responsible petroleum development in geologically mature hydrocarbon provinces.
Acknowledgements: The authors would like to thank the management of Dibrugarh University for their guidance and support to publish this paper.
Funding: This work was supported by the DST under grant (no. DST/INT/CAN/P-02/2019) and (no. DST/INT/TUNISIA/P-02/2017).
Data Availability: All the data underlying this research is original and available.
Conflict of Interest: Not applicable. and Tipam Sand (TS-IV)
Abbreviation
AAS – Atomic Absorption Spectrophotometer
BCS – Barail Coal Shale
CDS – Central Dehydration System CPCB – Central Pollution Control Board
FP – Flame Photometer
IEA – Inorganic anions and elements
MPK – Multi Parameter Kit
TDS – Total Dissolved Solid
TS-IV – Tipam Sand
WOR – Water-to-oil Ratio
API – American Petroleum Institute BMS – Barial Main Sand
CO – Crude Oil
E&P – Exploration and Production ICP-OES – Inductively Coupled Plasma Optical Emission Spectrophotometer K IEA – Proportionality constant of IEA OFPW – Oil Field Produced Water TISAB – Total Ionic Strength Adjustment Buffer
UAB – Upper Assam Basin
