GLCM based Improved Mammogram Classification using Associative Classifier

Author: Jyoti Deshmukh, Udhav Bhosle
Journal: International Journal of Image, Graphics and Signal Processing(IJIGSP) @ijigsp
Article in issue: 7 vol.9, 2017.
Free access
Among women, 12% possibility of developing a breast cancer and 3.5% possibility of mortality due to this cause is reported [1]. Nowadays early detection of breast cancer became very important. Mammogram - a breast X-ray is used to investigate and diagnose breast cancer. In this paper, authors propose GLCM (Grey Level Co-occurrence Matrix) feature based improved mammogram classification using an associative classifier. Mining of association rules from mammogram dataset discovers frequently occurring patterns. It depends on user specified minimum confidence and support value. This dependency causes an increase in search space. The authors propose two-phase optimization procedure to overcome these limitations. The initial phase comprises feature optimization by adopting proposed PreARM (Pre-processing step for Association Rule Mining) method. The next phase comprises association rule optimization by adopting proposed ESAR (Extraction of Strong Association Rules) method to generate efficient, highly correlated and robust rules. Proposed associative classification method is substantiated by adapting authentic MIAS and DDSM mammogram database. The experimentation concedes 91% and 90% trimming of GLCM features and association rules by adopting PreARM and ESAR algorithms respectively. Using optimized association rules, the classification accuracies procured for MIAS and DDSM datasets are 92% and 94% respectively. Area under Receiver Operating Characteristic (ROC) curves obtained by proposed system for MIAS and DDSM datasets are 0.9656 and 0.9285 respectively. Results of GLCM based associative classifier are compared with GLCM based Random Forest (RF), an ensemble learning method. The experimental result shows that GLCM based associative classifier outperforms RF method with respect to accuracy and AUC, and it is a promising method for mammogram classification.
Mammogram, ROI, GLCM, PreARM, Apriori algorithm, ESAR
Short address: https://sciup.org/15014206
IDR: 15014206
Text of the scientific article GLCM based Improved Mammogram Classification using Associative Classifier
Published Online July 2017 in MECS DOI: 10.5815/ijigsp.2017.07.07
Globally the numbers of woman’s carcinoma cases are gradually increasing. As the cause of the breast cancer is still not clearly identified, so its early prevention is not possible. Hence there is a need of early identification of
Input Region of Interest (ROI)
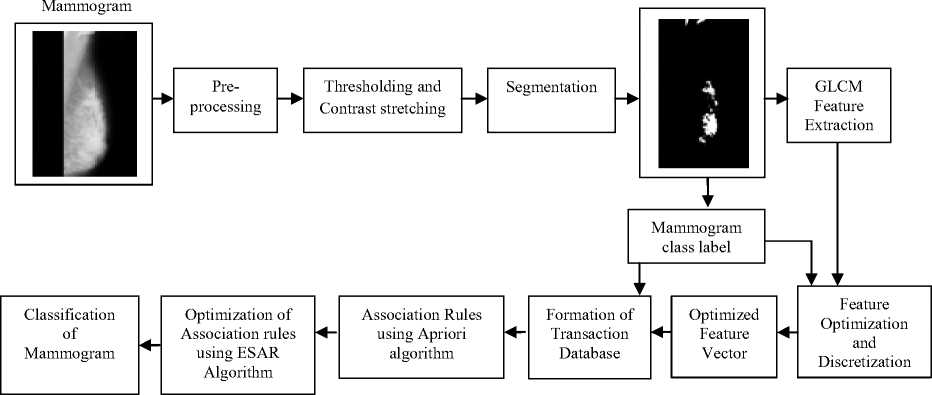
Fig.1. Proposed associative classification scheme flow diagram
the classification accuracy of mammograms. Low-level mammogram texture features and radiologist’s viewpoint is used for frequent pattern searching. In [11], [12] and [13] authors present association rule based, effective diagnosis of mammograms. Authors used association rule mining approach for data-mining and Neural Networks as a classifier. A composition of association rules along with a rough set theory is used for computer aided diagnosis of mammogram images by Yun et al. [14]. In [15], authors conferred a classification method, build on weighted association rules.
In this paper, authors propose an algorithm to obtain significant and frequent patterns from mammogram dataset which are used for mammogram classification. Apriori algorithm is used to obtain association rules. However, all obtained rules are not useful. Many rules are redundant, and resulted in exponential search space. Authors propose two phase optimization scheme for obtaining strong and eminently correlated association rules. It comprises feature optimization using proposed PreARM algorithm followed by association rule optimization by applying ESAR algorithm.
The presented scheme is verified using authentic MIAS and DDSM mammogram dataset. Presented scheme works in four steps. The step one includes image segmentation, GLCM texture feature extraction and optimization of features using the PreARM algorithm. The second step is generation of transaction database, which is an input for Apriori algorithm to produce rules. In the third step, optimization of association rules to acquire robust rules using EASR algorithm. Classification of mammogram is carried out using strong and optimized rules in fourth step. Results are reported in terms of accuracy, specificity, sensitivity, recall, precision, and area under ROC.
The paper outline is described as below. Proposed scheme is explained in Section II followed by experimental results in Section III. Lastly, section IV describes conclusion and future work.
-
II. Proposed Method
Fig. 1 explains the proposed associative classification scheme’s flow diagram. Here the modernity is in optimization of feature space and corresponding association rules. Optimization step gives most discriminating features and strong rules, which helps to curtail search space and consequently enhances the classification accuracy. Pre-processing using histogram equalization, thresholding and contrast stretching is carried out on mammograms, and segmentation is performed to acquire region of interest of mammograms.
-
A. Mammogram feature extraction
GLCM method is used to extract the features from the segmented mammograms and they are organized in feature vectors. Relative frequency of occurrences of i and j pixels with distance d pixels, and θ orientation is stated by a co-occurrence matrix M (d, θ). For 00, 450, 900, and 1350 directions, and 1, 2, 3, 4 and 5 distances cooccurrence matrices are determined. For each matrix seven features are determined. Each mammogram is presented with feature vector of size [140 x1] T [9]. Texture feature used are as follow
Step = ’Ll!, j P(i,j) (1)
Variance = ^t^ j P^i - j) P(i,j) (2)
Entropy = ^Z-P^j) log(P(ij))(3)
Energy = T.i^jP(i-j)2(4)
Homogeneity = ^Z, В(ПГ i+|;-j|
3rd Moment= Z; Zj P(i — 7)3 P(t,D(6)
Inverse Variance =Z; Z/ Р(М')(7)
‘ j (l-j)2
-
B. Feature optimization
Optimization of GLCM features is performed using PreARM algorithm [16]. Keyword of mammogram image (benign or malignant) and the feature vector are given as input to PreARM algorithm. Optimization and discretization of continuous GLCM features are carried out in this step. Exact number of intervals and features are chosen depending upon inconsistency in features.
Reduction in the number of feature value interval reduces the inconsistency in the features [10]. PreARM aims to have the most discriminative features to present the smallest class variation [16].
-
C. Transaction database and Association rule generation
Transaction database is prepared using optimized feature vectors and respective class labels of training mammogram images. Apriori algorithm produces association rules using transaction database. Consider T is the set of objects and R is set of data cases. Association rule is presented as U ^ V; U, V c T and U Л V = ф. Where U and V are antecedent and consequent part of association rule. Association rule is evaluated using its confidence and support value. These are defined as,
Support, S (U ^ V) = P(U U V) (8)
Confidence, C (U ^ V) = P(V|U) (9)
-
D. Association Rules optimization
Apriori algorithm generates all association rules which meet specified minimum criteria of support and confidence. More often, rules with high value of confidence and support give redundant information, which makes it weak rule. Values of confidence and support are inadequate to filter uninteresting rules. Likewise confidence and support, correlation measures are chosen to determine association rules as stated in [17]. Association rule is represented as
U → V [support, confidence, correlation measures](10)
Here, lift, certainty factor and completeness correlation measures are preferred to obtain strong rules. These measures are presented as
Lift (A, B) = P(A U B)(11)
v ’ ’ P(A)P(B)
Completeness (A, B) = P^AUB)
P( B )-P(B) P( A )-P(A)
Certainty factor (A, B) = max ( A ^^^ , 3^д) ) (13)
ESAR algorithm [18] is adopted to obtain optimized and strong rules. For individual rule confidence, support, lift, completeness and certainty factor values are calculated. The minimum threshold value of RCM (resultant correlation measure) is decided empirically. The rules satisfying RCM threshold are considered to be robust rules. Algorithm 1 presents ESAR algorithm.
Algorithm 1: EASR algorithm
Input : n: count of all association rules, value of Confidence, Support, Lift, Completeness and Certainty factor of every rule and minimum RCM threshold.
Output : Optimized association rules
-
1. Initialize S = 0
-
2. For every rule r i , and i ≤ n
-
3. Compute supp(ri), Conf(ri), C1(ri), C2(ri)
-
4. If Lift (r i ) > 1
-
5. Then RCM(r i ) = [supp(r i ) * Conf(r i ) * C 1 (r i ) * C 2 (r i )]
-
6. If RCM(r i ) > RCM threshold
-
7. S + +
-
8. End
-
9. Else RCM(r i )= [supp(r i ) * Conf(r i ) * C 1 (r i ) * C 2 (r i )] / 4
-
10. If RCM (r i ) > RCM threshold
-
11. S + +
-
12. End
-
13. End
-
14. End For
-
E. Classification of mammograms using Associative classifier
Algorithm 2 presents Associative classification algorithm [16]. The GLCM feature vector of the test image is derived by using feature extraction method and given to the classification step. In this step, test image is classified into cancerous or non cancerous class with the help of strong rules. Class labels present at the consequent portion of the rule are saved by associative classification algorithm. Test image feature vector is matched with the antecedent portion of all optimized rules. When GLCM feature value of the test image is present in the feature value interval of benign or malignant mammogram, count of benign (or malignant) class is increased respectively. Input test mammogram is classified to the class, which has the highest matches.
Algorithm 2: Associative classification algorithm
Input: All optimized rules, test mammogram’s feature vector
Output : Test mammogram class (benign or malignant)
-
1. Compare test mammogram’s feature vector with the antecedent portion of each rule (antecedent → consequent), where each class belongs to consequent portion.
-
2. If feature vector matches antecedent, and if consequent belongs to benign class (or malignant class), count of benign class (or malignant class) increases respectively.
-
3. Compare count of benign and malignant class.
-
4. Classify test image to the class having the highest count.
-
F. Classification of mammograms using Random Forest (RF) method
To improve the classification performance, different ensemble classification methods are used. In ensemble classification method, training of many classifiers is performed and their results are added along with voting, for getting output of the ensemble classifier. RF is [19], [20] a composite classifier, constructed using a collection of tree classifiers. It is a meta learner, built using many individual trees. It works very fast on large databases. Trees used in RF are obtained using random samples; Training of individual tree in the forest is independent of other trees in the forest. So, RF is a good example of parallelization.
Bagging or boosting is used in RF classifier for developing ensemble of classifier with classification tree CART (Classification And Regression Tree). Majority vote of tree determine the output of the classifier. RF runs effectively on bigger datasets. In the proposed work, RF is used to classify mammograms and compared the results with associative classifier. Algorithm 3 presents classification of mammograms using RF method.
Algorithm 3: Classification using Random Forest method Input: Optimized features of the training images with class
Output: Test image class (benign or malignant)
-
1. Consider N: Count of training images; M: Count of variables in the classifier; m: Count of input variables utilized for decision making at a node of tree and m is less than M
-
2. Randomly select m variables and use it for decision making at each node of tree.
-
3. Determine the superior split with the help of m variables during the training of mammogram data set.
-
4. Construct a forest for i=1 to N using a tree classifier (CART).
-
5. Select the training data set by random sampling with replacement.
-
6. Utilize the remaining data sets to validate the performance of the tree.
Tree Construction: Tree is completely grown without pruning.
-
III. Experimental Results and Discussions
To corroborate the proposed method, the experiment is carried out in MATLAB environment. Mammograms from Mammography Image Analysis Society (MIAS) database [21] and Digital Data-base for Screening Mammography (DDSM) [22] are considered to verify proposed scheme. Experiments are carried out on 64 bit I5, 2.50 GHZ processor with 4 GB RAM. The count of abnormal mammograms used is listed in Table 1.
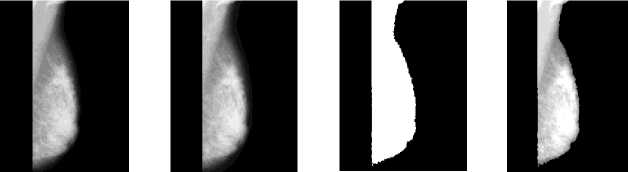
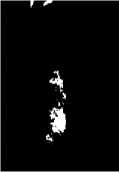
Fig. 2(a-e) shows outputs of segmentation process. Digitization noise induced in the course of mammogram acquisition is eliminated by applying median filtering during pre-processing step. Fig. 2(a) present input mammogram, fig. 2(b) shows median filtered mammogram. Empirically, a global threshold value is set to 100 to convert the input mammogram image into binary mammogram. Fig. 2(c) present output of thresholding process. To eliminate artifacts, wedges and labels morphological operations are performed on binary mammograms, followed by contrast enhancement technique. Fig. 2(d) present output mammogram of contrast enhancement technique. Region growing algorithm is applied to segment pectoral muscles of input mammogram, in which seed is located inside the pectoral muscles [7]. Fig. 2(e) present output of mammogram segmentation process with area of interest. Feature vector is generated using GLCM method for mammograms from MIAS and DDSM database. Out of 140 original features, 10 and 12 most discriminative features are obtained after optimization for every mammogram from DDSM and MIAS database respectively to form optimized feature vector.
In transaction database, a class of the image is listed in the column one and optimized feature value interval labels are listed in the rest of the columns. Apriori algorithm accepts transaction database as input to generate association rules. The parameters availed and the number of association rules generated for both the datasets by Apriori algorithm is presented in Table 2. Table 3 lists the sample association rules mined. Table 4, 5 and 6 lists the sample feature vector, optimized feature vector and transaction database for MIAS database. Optimized rules are obtained using EASR algorithm. Empirically, value of RCM is set to 0.02. All rules, accomplishing the RCM threshold criteria are determined as robust rules. Two phase optimization result i.e. feature and association rule optimization using PreARM and ESAR algorithm and result of mammogram classification obtained by proposed scheme are listed in Table 7.
Table 1. Number of mammogram images used for classification from DDSM and MIAS database
|
Database |
Total Images |
Training Images |
Testing Images |
|
DDSM |
320 |
288 |
32 |
|
MIAS |
114 |
89 |
25 |
Table 2. Parameters used and result of Apriori algorithm
|
Parameter |
Number of rules |
||
|
Min-supp threshold |
Min-conf threshold |
MIAS |
DDSM |
|
0.01 |
0.50 |
14232 |
10289 |
Table 3. Sample association rules
|
Association rule |
Description |
|
R1: 35, 144 → 101 |
Mammogram with optimized feature value interval label 35 and 144 is benign. |
|
R2: 3,24,86 → 102 |
Mammogram with optimized feature value interval label 3, 24 and 86 is malignant. |
Figure 3 represents sample result of classification, figure 3(a) is test image classified as benign and figure 3(b) is test image classified as malignant. Accuracy measures used for the mammogram classification scheme are sensitivity, specificity, recall and precision. Table 8 presents performance measures values of the associative classifier for MIAS and DDSM database. The confusion matrix for MIAS and DDSM database is listed in Table 9. Performance of proposed GLCM based associative classifier is compared with RF method [19]. ROC curves of associative classifier and RF method for MIAS and DDSM database are shown in Fig. 4 and 5 respectively.
Original Image
Segmented Image
(a)
(b)
(c) (d) (e)
Fig.2. Results of segmentation process; (a) input mammogram; (b) mammogram after noise elimination; (c) thresholded mammogram; (d) mammogram after contrast enhancement; (e) segmented mammogram
Table 4. Feature vector
|
Image Number (1-89) |
Features (1-140) |
|||||||||||
|
1 |
2 |
3 |
4 |
… |
134 |
135 |
136 |
137 |
138 |
139 |
140 |
|
|
1 |
657 |
655 |
652 |
650 |
… |
2.91 |
3.07 |
3.05 |
3.08 |
3.13 |
3.16 |
3.13 |
|
2 |
657 |
655 |
652 |
650 |
… |
0.59 |
0.71 |
0.82 |
0.44 |
0.54 |
0.62 |
0.66 |
|
3 |
657 |
655 |
652 |
650 |
… |
0.93 |
1.07 |
1.15 |
0.74 |
1.13 |
1.5 |
1.89 |
|
4 |
657 |
655 |
652 |
650 |
… |
3.66 |
3.8 |
3.89 |
3.88 |
4.01 |
3.94 |
3.73 |
|
5 |
657 |
655 |
652 |
650 |
… |
5.73 |
6.27 |
6.67 |
4.16 |
5.25 |
6.02 |
6.54 |
|
6 |
650 |
647 |
645 |
642 |
… |
3.84 |
4.16 |
4.34 |
3.63 |
3.68 |
3.81 |
4.07 |
|
7 |
657 |
655 |
652 |
650 |
… |
5.27 |
5.89 |
6.35 |
3.56 |
4.74 |
5.43 |
6.09 |
|
8 |
657 |
655 |
652 |
650 |
… |
2.43 |
2.57 |
0 |
0 |
0 |
0 |
0 |
|
9 |
657 |
655 |
652 |
650 |
… |
2.96 |
3.28 |
1.19 |
0.48 |
0.6 |
0.64 |
0.65 |
|
10 |
657 |
655 |
652 |
650 |
… |
3.07 |
3.05 |
0 |
0 |
0 |
0 |
0 |
|
. |
. |
. |
. |
. |
. |
. |
. |
. |
. |
. |
. |
. |
|
. |
. |
. |
. |
. |
. |
. |
. |
. |
. |
. |
. |
. |
|
. |
. |
. |
. |
. |
. |
. |
. |
. |
. |
. |
. |
. |
|
89 |
657 |
655 |
652 |
650 |
4.88 |
5.35 |
3.32 |
4.49 |
5.08 |
5.28 |
4.37 |
|
Table 5. Optimized feature vector
|
Image Number (1-89) |
12 Optimized Features (21-139) |
|||||||||||
|
21 |
27 |
29 |
39 |
70 |
87 |
89 |
121 |
126 |
127 |
129 |
139 |
|
|
1 |
0.36 |
0.64 |
1.21 |
0.52 |
0.96 |
0.99 |
0.99 |
0.47 |
0.55 |
0.83 |
1.53 |
3.16 |
|
2 |
0.42 |
0.68 |
0.93 |
1.5 |
0.97 |
0.99 |
0.99 |
0.55 |
0.59 |
0.87 |
1.17 |
0.62 |
|
3 |
2.97 |
3.29 |
2.85 |
2.95 |
0.97 |
0.98 |
0.98 |
3.86 |
3.94 |
4.23 |
3.6 |
1.5 |
|
4 |
2.66 |
4.06 |
5.22 |
5.17 |
0.94 |
0.98 |
0.97 |
3.46 |
4.03 |
5.22 |
6.6 |
3.94 |
|
5 |
2.67 |
3.42 |
3.99 |
3.25 |
0.94 |
0.98 |
0.98 |
3.44 |
3.99 |
4.34 |
4.98 |
6.02 |
|
6 |
2.26 |
3.64 |
4.36 |
4.81 |
0.94 |
0.98 |
0.98 |
2.94 |
3.64 |
4.68 |
5.52 |
3.81 |
|
7 |
0.37 |
0.45 |
0.56 |
1.3 |
0.97 |
0.99 |
0.99 |
0.48 |
0.44 |
0.58 |
0.71 |
5.43 |
|
8 |
0.37 |
0.67 |
1.18 |
0.52 |
0.96 |
0.99 |
0.99 |
0.48 |
0.61 |
0.86 |
1.5 |
0 |
|
9 |
1.1 |
1.61 |
2.15 |
2.45 |
0.96 |
0.99 |
0.99 |
1.44 |
1.67 |
2.07 |
2.72 |
0.64 |
|
10 |
1.46 |
2.23 |
2.74 |
2.79 |
0.96 |
0.99 |
0.98 |
1.9 |
2.17 |
2.87 |
3.46 |
0 |
|
. |
. |
. |
. |
. |
. |
. |
. |
. |
. |
. |
. |
. |
|
. |
. |
. |
. |
. |
. |
. |
. |
. |
. |
. |
. |
. |
|
. |
. |
. |
. |
. |
. |
. |
. |
. |
. |
. |
. |
. |
|
89 |
2.06 |
2.94 |
3.83 |
4.17 |
0.95 |
0.98 |
0.98 |
2.68 |
3.03 |
3.78 |
4.84 |
5.28 |
Table 6. Transaction database
|
Image Class 101-Benign 102 -Malignant |
Optimized feature value interval label |
|||||||||||
|
101 |
2 |
26 |
50 |
74 |
120 |
144 |
168 |
170 |
194 |
218 |
242 |
266 |
|
101 |
7 |
31 |
56 |
75 |
107 |
137 |
160 |
176 |
200 |
223 |
248 |
267 |
|
101 |
11 |
31 |
56 |
85 |
112 |
137 |
160 |
179 |
202 |
223 |
248 |
277 |
|
101 |
21 |
43 |
64 |
91 |
117 |
125 |
152 |
189 |
211 |
235 |
256 |
283 |
|
101 |
20 |
45 |
70 |
95 |
99 |
123 |
147 |
188 |
211 |
237 |
262 |
287 |
|
101 |
20 |
43 |
67 |
92 |
97 |
125 |
149 |
188 |
211 |
235 |
259 |
284 |
|
101 |
19 |
43 |
67 |
94 |
100 |
125 |
149 |
187 |
211 |
235 |
259 |
286 |
|
. |
. |
. |
. |
. |
. |
. |
. |
. |
. |
. |
. |
. |
|
. |
. |
. |
. |
. |
. |
. |
. |
. |
. |
. |
. |
. |
|
. |
. |
. |
. |
. |
. |
. |
. |
. |
. |
. |
. |
. |
|
102 |
13 |
34 |
59 |
88 |
111 |
134 |
157 |
181 |
205 |
226 |
251 |
280 |
Table 7. Result of two phase optimization and mammogram classification
|
Mammogram Database |
GLCM features |
Optimized features |
Apriori algorithm Rules |
Optimized rules |
Accuracy |
|
|
Benign |
Malignant |
|||||
|
MIAS |
140 |
12 |
14232 |
1010 |
90.90% |
92.85% |
|
DDSM |
140 |
10 |
10280 |
1162 |
100% |
87.5% |
Table 8. Performance measures of the associative classifier for MIAS and DDSM database
|
Mammogram Database |
Performance measure (%) |
||||
|
Sensitivity |
Specificity |
Precision |
Recall |
Accuracy |
|
|
MIAS |
92.85 |
90.90 |
92.85 |
92.85 |
92 |
|
DDSM |
87.5 |
100 |
100 |
87.5 |
94 |
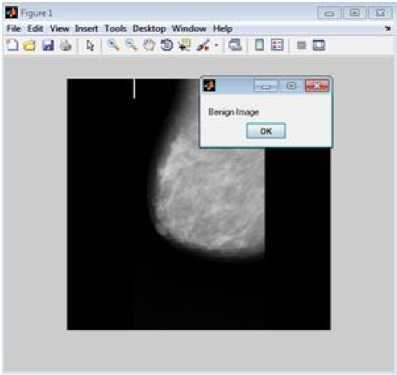
(a)Test image classified as benign
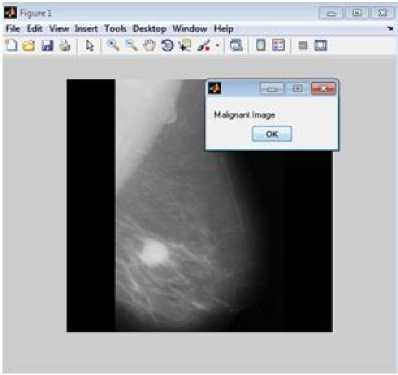
(b) Test image classified as malignant
Fig.3. Classification result
FPR (false positive rate) represents horizontal axis, TPR (true positive rate) represents vertical axis of ROC curve respectively.
TP
TPR = — p
„FP
FPR = —
N
If TP is obtained (i.e. a malignant mammogram classified as malignant), both TP and TPR increases. In ROC plot, moved up and plotted the point. FP is obtained (i.e. a benign mammogram classified as malignant), both FP and FPR increases. In ROC plot, moved right and plotted the point. Similar task is performed for every test mammogram, i.e. moved up direction for TP and towards the right for a FP [17]. If FN is obtained then TP decreases, so TPR decreases and hence it results in decrease in AUC value.
The maximum area under ROC curve values obtained by the proposed classifier and random forest method for MIAS database are 0.9656 and 0.8398, and for DDSM database are 0.9285 and 0.9270 respectively. The proposed classifier and random forest method got 92% and 70% accuracy for MIAS database, and 94% and 88 % accuracy for DDSM database respectively. Table 10 presents the comparative result of proposed ESAR based associative classifier and RF method. It reveals, associative classifier result succeeds RF method’s result.
Table 9. Confusion Matrix for MIAS and DDSM database
|
Actual Class |
Predicted Class (MIAS) |
Predicted Class (DDSM) |
||
|
Malignant |
Benign |
Malignant |
Benign |
|
|
Malignant |
13 |
1 |
14 |
2 |
|
Benign |
1 |
10 |
0 |
16 |
Table 10. Comparison between ESAR based associative classifier and RF method
|
DataBase |
Associative classifier |
RF method |
||
|
Accuracy |
AUC |
Accuracy |
AUC |
|
|
MIAS |
92% |
0.9656 |
70% |
0.8398 |
|
DDSM |
94% |
0.9285 |
88% |
0.9270 |
AUC and accuracy are two statistics measures and gives different qualities of the classifier. So AUC and accuracy of a classifier may not be consistent. Results are compared with the other associative classification techniques in terms of accuracy. For MIAS data set, result of BPNN (Back Propagation Neural Network) method is 81.25% [11], ARC-AC (Association Rule
Based Classification with All Categories) method is 69.11% [12][13], ARC-BC (Association Rule Based
Classification By Categories) method is 80.33% [12][13], JAC (Joining Associative Classifier) method is 77.49 [14], WAR-BC(Weighted Association Rule Based Classifier) method is 89.69% [15], and proposed associative classification method is 92% for MIAS and 94% for DDSM data set. It shows that, proposed approach of classification gives better accuracy compared with other methods reported in literature.
-
IV. Conclusions
Mammograms are low-dose X-ray images, used to investigate human breast. For radiologist, most challenging job is to find correct information from the mammograms, which is used for diagnosis process. The authors propose the GLCM feature based improved mammogram classification using an associative classifier.
Optimization of GLCM features and association rules is achieved using PreARM and ESAR algorithm respectively. Presented scheme is validated on MIAS and DDSM mammogram datasets.
Further the classification of mammogram images is carried out with the help of optimized association rules. Proposed technique gives better classification accuracy around 92% for MIAS and 94% for DDSM database as compared with the other associative classification techniques. Area under ROC curve value obtained by the proposed scheme for MIAS and DDSM database are 0.9656 and 0.9285 respectively. For comparative analysis, results of proposed GLCM based associative classifier are compared with GLCM based RF method. Experimental results reveal that suggested scheme gives better performance over RF method. Proposed method is validated as a critical approach for the elimination of redundant and weak rules. Moreover, computation cost of mammogram analysis can be reduced, and it can be used for other image classification applications.
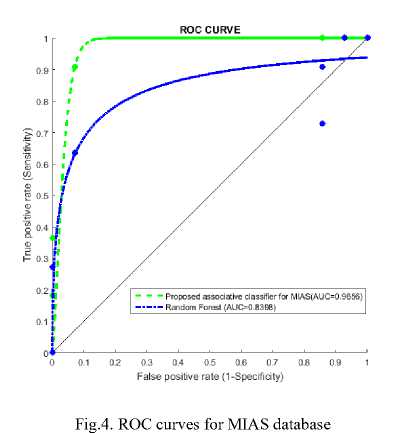
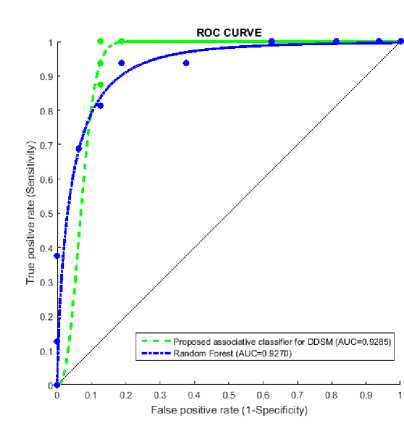
Fig.5. ROC curves for DDSM database
Fig.5.
Acknowledgment
The authors wish to express sincere gratitude to Dr. Thomas Deserno, Dr. J. Suckling and co-authors for permitting the use of dataset, “IRMA VERSION OF DDSM LJPEG DATA” and “Mammographic Image Analysis Society (MIAS)” respectively.
References GLCM based Improved Mammogram Classification using Associative Classifier
- J. Tang, R.M. Rangayyan, J. Xu, I. El Naqa and Y. Yang, “Computer-aided detection and diagnosis of breast cancer with mammography: recent advances”, IEEE Transactions on Information Technology in Biomedicine, vol. 13.2, pp.236-251, 2009.
- H.D. Nelson, K. Tyne, A. Naik, C. Bougatsos, B.K. Chan and L. Humphrey, “Screening for breast cancer: an update for the US Preventive Services Task Force”, Annals of internal medicine, vol. 151.10, pp.727-737, 2009.
- H.P. Chan, B. Sahiner, M.A. Helvie, N. Petrick, M.A. Roubidoux, T.E. Wilson, et al., “Improvement of Radiologists' Characterization of Mammographic Masses by Using Computer-aided Diagnosis: An ROC Study 1”, Radiology, vol. 212.3, pp.817-827, 1999.
- C. Ordonez and E. Omiecinski, “Discovering association rules based on image content”, In Research and Technology Advances in Digital Libraries, 1999. Proceedings. IEEE Forum on, pp. 38-49, IEEE, 1999.
- R. Agrawal, T. Imieliński, and A. Swami, "Mining association rules between sets of items in large databases", ACM SIGMOD Record, vol. 22.2, pp. 207-216, 1993.
- R. Ramani, N.Suthanthira Vanitha, S. Valarmathy, "The Pre-Processing Techniques for Breast Cancer Detection in Mammography Images", IJIGSP, vol.5, no.5, pp.47-54, 2013.DOI: 10.5815/ijigsp.2013.05.06.
- J. Nagi, S.A. Kareem, F. Nagi and S.K. Ahmed, “Automated breast profile segmentation for ROI detection using digital mammograms”, In Biomedical Engineering and Sciences (IECBES), 2010 IEEE EMBS Conference on, pp. 87-92, IEEE, November 2010.
- K. Beyer, J. Goldstein, R. Ramakrishnan, U. Shaft, "When is ‘nearest neighbor’ meaningful?”, In Database theory—ICDT’99, Springer Berlin Heidelberg, pp. 217-235, 1999.
- R.M. Haralick and K. Shanmugam, “Textural features for image classification”, IEEE Transactions on systems, man, and cybernetics, vol. 3.6, pp.610-621, 1973.
- M. X. Ribeiro, C. Traina, and P. M. Azevedo-Marques, "An association rule-based method to support medical image diagnosis with efficiency", IEEE Transactions on Multimedia, vol. 10.2, pp. 277-285, 2008.
- M. L.Antonie, O. R. Zaiane, and A. Coman, "Application of data mining techniques for medical image classification", MDM/KDD2001, pp. 94-101, 2001.
- M. L. Antonie, O. R. Zaiane, and A. Coman, "Associative classifiers for medical images", Mining Multimedia and Complex Data, Springer Berlin Heidelberg, pp. 68-83, 2002.
- O. R. Zaıane, M. L. Antonie, and A. Coman, "Mammography classification by an association rule-based classifier", MDM/KDD, pp. 62-69, 2002.
- J. Yun, L. Zhanhuai, W. Yong, Z. Longbo, "Joining associative classifier for medical images", In Fifth International Conference on Hybrid Intelligent Systems (HIS'05), IEEE, 2005.
- S. Dua, H. Singh, and H. W. Thompson, "Associative classification of mammograms using weighted rules", Expert systems with applications, vol. 36.5, pp. 9250-9259, 2009.
- J. Deshmukh and U. Bhosle, "SIFT with associative classifier for mammogram classification", In Signal and Information Processing (ICONSIP), International Conference on, pages 1-5, IEEE, 2016
- J. Han, J. Pei, and M. Kamber, Data mining: concepts and techniques, Elsevier, 2011.
- J. Deshmukh and U. Bhosle, "Image mining using association rule for medical image dataset", Procedia Computer Science, vol. 85, pp. 117-124, 2016.
- L. Breiman, "Random forests", Machine learning, vol. 45.1, pp. 5-32, 2001.
- R. Ramani, N. Suthanthira Vanitha, "Computer Aided Detection of Tumours in Mammograms", IJIGSP, vol.6, no.4, pp.54-59, 2014.DOI: 10.5815/ijigsp.2014.04.07
- J. Suckling et al., "The mammographic image analysis society digital mammogram database", Exerpta Medica. International Congress Series, Vol. 1069, pp. 375-378, 1994.
- T. M. Deserno, M. Soiron, and J. E. de Oliveir, "Texture patterns extracted from digitizes mammograms of different BI-RADS classes", Image Retrieval in Medical Applications Project, release, 1, 2012.
