Graphic representations and frequency parameters of heart sound signals

Author: Božo Tomas, Darko Zelenika, Željko Rončević
Journal: International Journal of Image, Graphics and Signal Processing @ijigsp
Article in issue: 7 vol.10, 2018.
Free access
Sounds produced by acoustic activity of the heart are series (sequences) of quasi-periodic events which are repeated throughout life, one period (cycle) of these events lasts less than one second. The advancements in technology have enabled us to create various tools for audio and graphic representations of these events. Physicians, by using such tools, can more accurately determine diagnosis by interpretation of heart sound and/or by visual interpretation of graphic displays of heart sounds. This paper presents frequency parameters and graphic illustrations of heart sound signals for two groups of heart murmurs: innocent Still’s murmur and pathologic heart murmur of Ventricular Septal Defect (VSD). Also, on behalf of the frequency analysis of acoustic cardiac signals with Still’s murmur was given a medical explanation of cause and origin of Still’s murmur.
Heart Sound Frequency Parameters, Heart Sound Graphic Representation, Haert Sound Spectrogram, Phonocardiogram (PCG), Still’s Murmur, Ventricular Septal Defect (VSD)
Short address: https://sciup.org/15015978
IDR: 15015978 | DOI: 10.5815/ijigsp.2018.07.04
Text of the scientific article Graphic representations and frequency parameters of heart sound signals
Published Online July 2018 in MECS DOI: 10.5815/ijigsp.2018.07.04
-
I. Introduction
Our body transmits sound messages and „speaks“ about the state of our vital organs (heart, lungs,..). Physicians listen and interpret these sounds. Auscultation is a medical term for listening of internal body sounds and the procedure of listening is mainly done with a stetoscope. That term originates from the Latin word auscultare, which means to listen. The beginning of auscultation started back in 1816 when French physician René Théophile Hyacinthe Laennec
(1781-1826) invented the stethoscope and introduced the term auscultation into medicine [1].
Heart auscultation is very subjective because diagnosis of heart sounds could be interpreted in several ways depending on how a physician interprets the sound. Due to limited opportunities of heart auscultation, it is necessary to help the human ear and make a graphic display of the heart sound. Visual representations of heart sound signals can help physicians to better understand, determine and evaluate heart sound cycle events .
Despite numerous heart sound graphic representations, vast majority physicians do not really use them. One of the most common graphic representations of heart sound signals is phonocardiogram (PCG) (the time display of heart sound amplitudes). Other display of heart sound signals is the heart sound spectrogram which allows better heart sound interpretation, but it is hardly percepted or used by physicians.
With this purpose, authors in [2] introduced a solution for graphic display of heart sounds called HSLs (Heart Sound Lines). Authors believe that graphic display of heart sound signals like this could be a useful tool for the heart sounds interpretation and can assist physicians for a more precise diagnosis of innocent and pathologic murmurs (auscultation-visual diagnosis). The advantage of HSLs graphical display over other methods is in its easier interpretation by their parameters: murmurs color line, numerical value of murmurs index and lines shape.
The paper is organised as follows. In Section II recordings of heart sound signals and Goertzel algorithm are shortly presented. In Section III are shown the spectral compositions (spectral energy distributions) of Still’s and VSD’s murmur and their frequency parameters. Graphic representations of heart sounds are in Section IV. Section V concludes the paper with final remarks.
-
II. Materials and Methods
While examining the children in an outpatient clinic by pediatric cardiologists, their heart sounds were recorded with an electronic stethoscope. All children were additionally examined with ultrasound for an accurate diagnosis of congenital heart disease. The recorded heart sounds were classified into three groups: heart sounds without heart murmur – Normal (10 records), heart sounds with physiological Still´s innocent murmur – Still (20 records) and heart sounds with pathological murmur associated with congenital heart disease – VSD (20 records).
Heart sounds were recorded with the sampling frequency of f s =8000 Hz and resolution of quantization of 16 bits. Further more, in a process of determination of frequency parameters of the murmurs, the complete systolic duration was isolated (by hand using software tool Audacity) from the heart audio files. An energy spectrum of the heart sound data was obtained by applying Goertzel algorithm.
-
A. Basic Goertzel algorithm
The algorithm was introduced by Gerald Goertzel (1920-2002) in 1958 [3]. Equation (1) describes the signal flow for the basic Goertzel algorithm as each sample is processed [4]. The signal flow of the algorithm produces an output y 0 for each processed sample.
_ _ (2лт\
У о = % о + У 1 X 2cos (—) - у2 (1)
In the equation (1), y 0 denotes the current output, x 0 denotes the current input sample, y 1 denotes the output that is previously processed, y 2 denotes the second previously processed output, N denotes the size of input block, while m denotes bin number in the frequency domain. Each sample of the input block (of size N ) is processed accrding to the equation (1) and at the end of each block the spectral energy of each frequency bin is computed by the equation (2). This process continues over the next block (of size N ) until the last block is processed.
Е = у1 + У 22 - 2y i y 2 COS ( 2^ ) (2)
In equation (2) y 1 is the last processed output (iteration N ) equation (1) and y 2 second-last processed output (iteration N-1 ).
The advantage of the Goertzel algorithm is that it can process the input data as it arrives. The output value is only needed for the last sample in the block unlike the Fast Fourier Transform (FFT). The FFT has to wait until the entire sample block has arrived. If the number of frequency bins is a lot smaller than N, the Goertzel algorithm reduces the data memory which is required significantly. The Goertzel algorithm is more efficient than FFT only when a small number of frequency bins M need to be calculated (M< log2N). The motivation for using Goertzel algorithm is in possibility of selection of parameters m by which we can easily change and adjust frequency resolution and frequency band of analysed signal.
-
III. Spectral Composition and Frequency Parameters of Heart Murmurs
The basic events of a heart sound cycle are first heart sound ( S1 ), second heart sound (S2) and time periods between them. A time between S1 and S2 is called a systole and a time period between S2 and S1 is called a diastole. If there is a sound (noise) which is heard through the systole or diastole, that phenomenon is respectively called systolic heart murmur and diastolic heart murmur.
When murmurs appear, they can last only a small part or entire systole i.e. diastole. The time interval of murmur appearance is very short. At children age, a systolic time interval is around 200 ms and diastolic time interval is little longer.
Spectral composition of heart sound signals is very useful in detection and heart murmur diagnosis. Majority of authors in their studies mostly used FFT and/or Wavelet Transform for a spectral anlysis of the heart sounds [5-7]. Heart sound spectral analysis with Goertzel algorithm is proposed in [8-9].
In this analysis Goertzel algorithm was applied with the sample block size of 160 samples. When using a sampling frequency of 8 kHz, 160 samples ( N =160) in discrete time represent the time frame of 20 ms in realtime. The bin bandwidth frequency is determined by sampling frequency and sample block size ( B=fs/N) . The overlapping of bins (frequency resolution) is adjusted by the selection of coefficient m in equations (1) and (2). Figures 1 and 2 illustrate the results calculated by the frequency resolution of 5 Hz.
Frequency parameters of heart murmurs carry information about the health status of patient’s heart and these parameters are determined and evaluated in heart sound computational diagnosis. Analysed frequency parameters of heart murmurs (in this article) are:
-
- Frequency of spectral extremes i.e. frequency on which murmur spectrum has the highest energy (peaks);
-
- Frequency bandwidth;
-
- Intensity of spectral energy on resonant frequency (spectral energy of peaks).
-
A. The spectral compositions of Still’s and VSD murmur
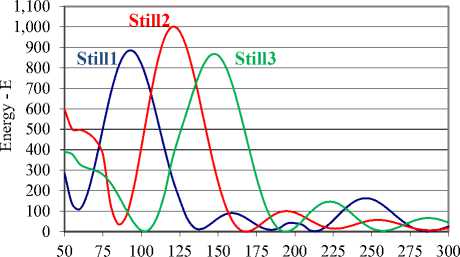
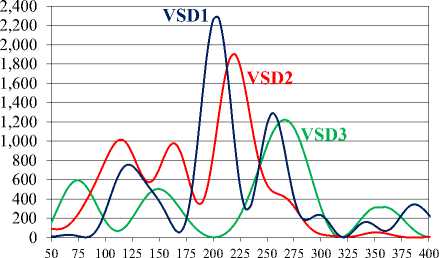
The heart sound graphic images represent heart sound intensity in time and/or frequency besides that time display of heart sound amplitudes does not give information about heart sound frequency and heart sound energy. Display of heart sound spectral energy is a usefull for determination and evaluation of heart murmur. Fig. 1 and Fig. 2 illustrate the distribution of spectral energies of isolated systoles for three typical Still’s murmurs (Fig. 1) and for three typical VSD murmurs (Fig. 2). Fig. 1 represents three Still’s murmurs (low frequency - Still1, high frequency - Still3 and common - Still2) and Fig. 2 represents three VSD-s (high energy – VSD1, medium energy VSD2 and low energy – VSD3).
Frequency (Hz)
Fig.1. Three typical Still’s murmurs
Frequency (Hz)
Fig.2. Three typical VSD murmurs
It is clearly visible in Fig. 1 that the information about Still’s murmur occurs in a lower frequency bandwith (80170 Hz). It is obvious that the frequency of Still’s peak is lower than 200 Hz while the highest VSD peak has the frequency above 200 Hz.
If we compare spectral compositions of Still’s and VSD murmur, information about VSD murmur is in a wider frequency bandwidth and in most cases VSD murmur has a distribution of the spectrum energy in bandwith (90-300 Hz).
-
B. Frequency parameters of Still’s murmur
Innocent murmurs are common in children and the most frequent is Still’s murmur [10], which occurs and is audible at the beginning of the systole. For every prerecorded heart sound signal, every systole is manually located and secluded for spectral analysis. In Fig. 3 secluded time interval is represented (red rectangles-three heart sound cycles). Also Fig. 3 shows a PCG display of one Still’s murmur before processing (top picture) and after processing by 3M Littmann sound analysis software (bottom picture).
Signal after processing (Low pass filter) has more emphasized murmur and better visual impression. 3M Littmann sound analysis software has three heart sound signal processing option filters (Low pass, High pass and Band pass). Low pass filter is suitable for Still’s murmur emphasing and a high pass or band pass filter for VSD murmur.
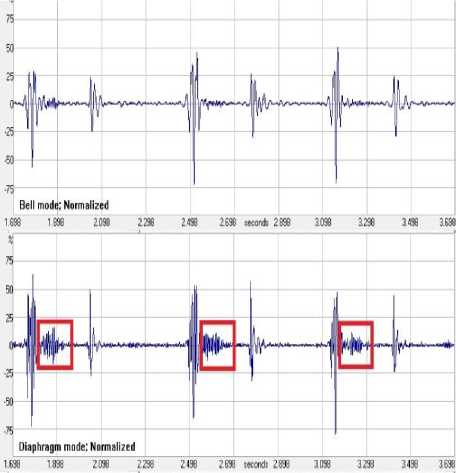
Fig.3 . Time interval of Still’s murmur
Spectral energy is calculated for the secluded time interval that lasts cca. 100 ms with frequency resolution of 5 Hz in time frames (intervals) of 20 ms. The point where Still’s murmur has the maximal spectral energy in time interval of 20ms is selected as the final position of Still’s murmur. That time frame represents the location of Still’s murmur and the frequency and the bandwith of Still’s murmur are calculated in this time frame. The final position of Still’s murmur i.e. the frequency at which it has maximal spectral energy (the peak) is usually in the bandwidth ( B ) between 110 and 130 Hz. The frequency bandwidth ( B ) ( B = fmax-fmin ) is obtained in a way that the frequency of the final Still’s position (the peak) falls in half of strength f min (left of the top of curve) and f max (right of the top of curve) [9].
Fig. 4 illustrates the graphic representation of frequency parameters of Still’s murmur. It shows that peak of the murmur’s spectral energy is at the frequency of 147,5 Hz on 880 units (values obtained by Goertzel algorithm), f min is at the frequency around 124 Hz and f max is at the frequency around 168 Hz. Therefore, the frequency of this Still’s murmur is 147,5 Hz, the bandwidth is cca. 44 Hz and the spectral energy is 880.
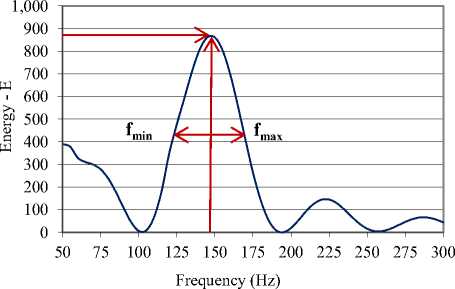
Fig.4. Frequency parameters of Still’s murmur
-
C. Frequency parameters of VSD murmur
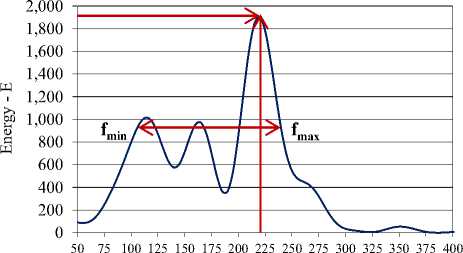
VSD murmur is audible in the whole systole. VSD can have a couple of peaks (mostly two or three) which have a slightly lower energy than the uppermost peak. For the VSD with two or more peaks, fmin is to the left of the uppermost peak and fmax is to the right of the uppermost peak. Fig. 5 shows one VSD murmur in the final position (maximal energy of uppermost peak).
Frequency (Hz)
Fig.5. Frequency parameters of VSD murmur
The Fig. 5 shows that the spectral energy of this VSD murmur is at the frequency of 220 Hz and its energy is 1902,4 units, fmin is at the frequency around 107 Hz and fmax is at the frequency around 239 Hz. Therefore, the frequency of this murmur is 220 Hz, the frequency bandwidth is 132 Hz and the spectral energy is 1902,4.
-
IV. Graphic Representation of Heart Sound
The author [11] tested 126 medical students and 20 pediatricians and found that those participants who could play musical instrument or sing in a chorus identified more murmurs correctly than those who had no practical musical skills. A graphic representation of heart sound signal provides a visual image of the heart sound. The PCG shows a change in amplitude of heart sound in time. It is a considerable source of information that can lead by its analysis, to the detection and the identification of several heart abnormalities [12]. Each event in the heart sound cycle (sounds and murmurs) changes the amplitude of PCG base line and physicians can see that change. However, by PCG we can only detect heart sounds and murmurs and show their position and shape in time. A heart sound spectrogram shows the frequency components of heart sound signals and the distribution of spectral energy of heart signals in time. Each event in the heart sound cycle ( S1, S2 as well as murmur if it exists in systole or diastole) has its own spectral energy distribution. The spectral energy of first S1 and second S2 heart sound is mostly distributed in bandwidth under 100 Hz. Heart sounds S1 and S2 are the loudest events (the highest energy) in cardiac cycle. That is the reason why they have the highest amplitude in PCG representation of heart sounds cycle. Likewise, if a murmur appears in heart sound cycle then each murmur has a unique PCG and spectrogram shape.
Different heart murmurs have different time amplitudes and spectral energy distributions. In this article we graphicly presented only two murmur types (Still and VSD). The spectrogram was created using Matlab. Fig. 6 illustrates graphic representations (PCG and spectrogram) of Still’s murmur and Fig. 7 illustrates graphic representations (PCG and spectrogram) of one cardiac signal with VSD murmur.
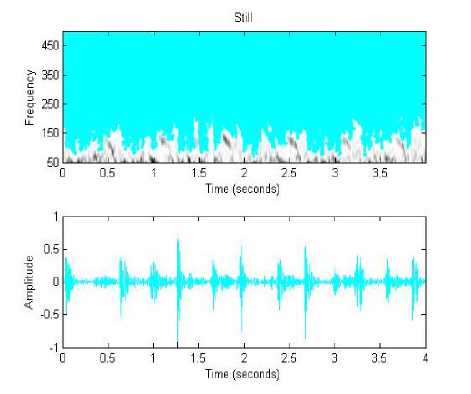
Fig.6 . PCG and spectrogram representation of Still’s heart murmur
Heart sound signals are mainly unsteady signals in time span. Spectral energy of Still’s murmur in Fig. 6 is distributed in bandwidth 100-150 Hz. On PCG representation Still’s murmur has a diamond (crescendo-decrescendo) shape. That shape is a result of increasing and decreasing of the sound generated by Still’s murmur. Cresscendo and decrescendo are expressions taken from music art. Still’s murmur is silent at the beginning then it becomes louder in the middle and then declines and stops.
There are no common views on the occurrence of the Still's murmur. The doctors (physicians) haven't yet established reliable genesis of the occurrence of that murmur, answering which heart structures and during which heart developments for the duration of systole that tone is created. Authors’ opinion, based on the acoustic analogy, is that this sound can be generated by some string (thread) which vibrates in the appropriate resonator. The hypothesis that the Still’s murmur appears during vibrations of cords in the heart is also stated by other authors (physicians) in [13-14]. Cords are thin structures (like threads) within the heart and during the contraction of heart muscles with which they are connected, the cords are vibrating, and at the same time (systole) the ventricles are emptying creating resonator box in which the cords are vibrating and generate sound which we can hear as the Still’s murmur. Therefore, alike live instrument, the heart, or more precisely vibrating cord in the heart, starts to play silently, then louder and after maximal loudness starts to appease and stops playing. During diastole, there is no contraction of the heart muscle and no actuation (vibration) of cords. Since cords are not vibrating during diastole, the Still’s murmur in diastole is not generated.
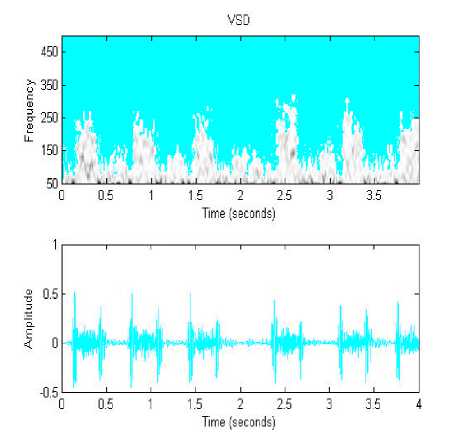
Fig.7 . PCG and spectrogram representation of VSD heart murmur
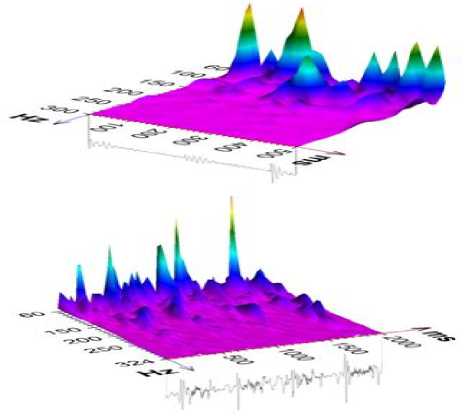
Fig.8 . 3D spectrogram with time domain representation of Still’s (top picture) and VSD heart murmur (bottom picture)
Still murmur is vibratory, musical sound without any evidence of turbulent flow. VSD is harsh systolic murmur of ventricular septal defect (VSD) caused by turbulent blood flow through a defect („a hole”) in ventricular septum. Ventricular septum separates right and left ventricle. In healthy children and adults septum is intact [8].
In PCG and spectrogram it can be noted that Still and VSD are located in the systole. Heart sounds S1 and S2 have higher amplitudes in PCG display than the amplitudes of Still’s and VSD murmur. The spectral energy of Still’s murmur is distributed in a narrow frequency bandwidth, which is very close to heart sound bandwidth where the energy of tones S1 and S2 is expressed. In many cases these two bandwidths are overlapping. Therefore, this makes the detection of Still’s murmur difficult. This is also the reason and explanation why physicians mostly give a wrong diagnosis by auscultation alone when it comes to Still’s murmur.
It is obvious that there is a masking of frequency in Still’s murmur and therefore many physicians can’t even hear it. The spectral energy of VSD is distributed in a wider frequency bandwidth 80-300 Hz and it lasts throughout the whole systole. Band of VSD is separated from band of tones S1 and S2 . VSD murmur is not masked by tones S1 and S2 so physicians mostly do not have difficulties in recognition of VSD murmur by auscultation technique.
Frequency distribution of heart sounds (S1 and S2) bandwits and heart murmur bandwidth have the best representations on 3D heart sound spectrogram. Fig. 8 illustrates a 3D graphic spectrogram together with PCG for one cardiac signal with Still’s murmur and one with VSD murmur.
The top picture shows 0,5 seconds of a spectrogram of one-half cardiac cycle of one heart sound signal with Still’s murmur (S1 – Still’s murmur in systole – S2). The frequency bandwidth of heart sounds (S1 and S2) is shown by hills above base-plane in bandwidth 60-100 Hz while Still’s murmur is shown by one hill of a smaller amplitude than heart sounds in frequency bandwith 100150 Hz. On 3D representation is visible a small distance between heart sounds and Still’s murmur bandwidths. The bottom picture shows 2 seconds of spectrogram of almost four heart sound cycles of one heart sound signal with VSD murmur. Heart sounds bandwidth and VSD murmur bandwidth have a large enough distance.
Generally, by spectral analysis of heart sound signal we can recognize and classify heart murmurs by comparing spectral energy in the defined frequency bandwidth. The graphic displays of Still’s and VSD murmur are clearly different, and that is what enables their visual classification. They have different acoustic and frequency parameters and their graphics are different. However, in real medical practice there are many types of murmurs and there are some types of murmurs which have similar frequency parameters with similar graphic displays.
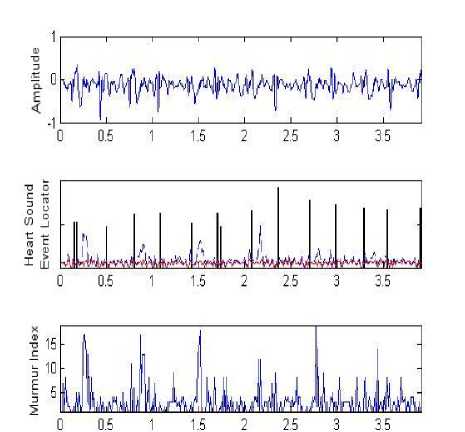
With HSLs graphic representation physicians can easily make murmur classifications (innocent or pathologic) by comparing different lines i.e. their color and value, by comparing values of index murmur and estimating duration of the murmur. HSLs graphic representation shows three pictures: PCG signal on top, heart sounds locations (black line) and murmur evaulation (blue and red lines) on midle and murmur index lines and values on the bottom picture. Fig. 9 illustrates HSLs of one innocent Still heart murmur and Fig. 10 illustrates HSLs of one VSD murmur.
Seconds
Fig.9 . HSLs of Still’s heart murmur
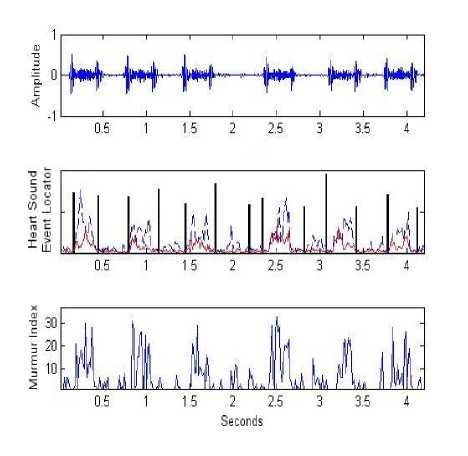
Fig.10. HSLs of VSD heart murmur
References Graphic representations and frequency parameters of heart sound signals
- Laennec, R. T. H.; De l’Auscultation Médiate ou Traité du Diagnostic des Maladies des Poumons et du Coeur, Paris: Brosson & Chaudé. The complete title of this book, often referred to as the "Treatise" is: De l’Auscultation Médiate ou Traité du Diagnostic des Maladies des Poumons et du Coeur (On Mediate Auscultation or Treatise on the Diagnosis of the Diseases of the Lungs and Heart, 1819.
- Tomas B. and Zelenika D.; Heart Sound Lines – Proposal of a Novel Heart Auscultation Assistant Diagnosis Tool, International Journal of Latest Trends in Engineering and Technology (IJLTET) Vol. 5 Issue 2 March 2015, http://ijltet.org/wp-content/uploads/2015/03/3.pdf
- G. Goertzel; An algorithm for the evaluation of finite trigonometric series, American Mathematics Monthly, vol. 65, January 1958, pp. 34-35
- Kiser E.; Digital Decoding Simplified Sequential Exact-Frequency Goertzel Algorithm, CIRCUIT CELLAR, Issue 182, September 2005, pp. 22-26
- Atbi A., Meziani F., Omari T. and Debbal S.M.; Segmentation of Phonocardiograms Signals using the Denoising by Wavelet Transform (DWT), Acad. J. Sci. Res., 1(3): 39-55, 2013.
- Djebbari A. and Reguig B.; Short-time Fourier transform analysis of the phonocardiogram signal, The 7th IEEE International Conference on Electronics, Circuits and Systems, pp.844-847, 2002
- Debbal S.M. and Bereksi-Reguig F.; Filtering and classification of phonocardiogram signals using wavelet transform, Journal of Medical Engineering & Technology,vol. 32, no. 1, pp. 53-65, January/February 2008.
- Tomas B. and Rončević Ž.; Spectral Analysis of Heart Murmurs in Children by Goertzel Algorithm, The First International Conference on Creative Content Technologies CONTENT 2009, November 15-20, 2009 - Athens/Glyfada, Greece, http://circ.ahajournals.org/cgi/reprint/116/14/F79.pdf
- Tomas B., Zelenika D., Rončević Ž. and Krtalić A.; Classification of Pathologic and Innocent Heart Murmur Based on Multimedia Presentations of Acoustic Heart Signals, The Third International Conference on Creative Content Technologies CONTENT 2011, September 25-30, 2011 - Rome, Italy ISBN: 978-1-61208-157-1, Pages: 34 to 37, Archived in the free access ThinkMindTM Digital Library
- Still G.F.; Common disorders and diseases of chilhood, 1st ed. London: Frowde, Hodder & Stoughton, 1909.
- Rončević Ž.; Music from the heart-in praise of auscultation, Interview by Keith Barnard, Circulation 2007; 116: 81-2.
- A.Choklati, K. Sabri, M. Lahlimi.; Cyclic Analysis of Phonocardiogram Signals, International Journal of Image, Graphics and Signal Processing(IJIGSP), Vol.9, No.10, pp.1-11, 2017.DOI: 10.5815/ijigsp.2017.10.01
- Malouf J., Gharzuddine W. and Kutayli F.; A reappraisal of the prevalence and clinical importance of left ventricular false tendons in children and adults, Br Heart J. 1986;55 (6):587-91.
- Kenchaiah S., Benjamin E. J., Evans J. C., Aragam J. and Vasan R. S.; Epidemiology of Left Ventricular False Tendons: Clinical Correlates in the Framingham Heart Study, J Am Soc Echocardiogr. 2009; 22(6): 739–745.
- Noponen AL, Lukkarinen S, Angerla A, et al.; Phono- spectrografic analysis of heart murmur in children, BMC Pediatrics2007;11:7–23.
- Vladimir Kudriavtsev, Kaelber D, Lazbin M, Polyshchuk VV, Roy DL.; New tool to identify Still's murmurs. Pediatric Academic Societies Annual Meeting [http://www.bsignetics.com/papers/PASStillsMurmur.pdf]. 2006 April 29–May 2
- Vladimir Kudriavtsev, Vladimir Polyshchuk and Douglas L Roy.; Heart energy signature spectrogram for cardiovascular diagnosis, BioMedical Engineering OnLine 2007, 6:16 doi:10.1186/1475-925X-6-16
- Van Oort A, Hopman J, De Boo T, Van Der Werf T, Rohmer J, Daniels O.; The vibratory innocent heart murmur in schoolchildren: A case-control doppler echocardiographic study, Pediatric Cardiol. 1994;15:275–281. doi: 10.1007/BF00798120.
- Donnerstein RL, Thomssen VS.; Hemodynamic and anatomic factors affecting the frequency content of Still's innocent murmur, Am J Cardiol. 1994;74:508–510. doi: 10.1016/0002-9149(94)90917-2.
- Noponen AL, Lukkarinen S, Sikiö K, Angerla A, Sepponen R.; How to recognize the innocent vibratory murmur, Comput Cardiol. 2000;27:561–564.
- Sayed Tanvir Alam, Md. Moin Hossain, Mohammad Dehan Rahman, Md. Kafiul Islam, Towards Development of a Low Cost and Portable ECG Monitoring System for Rural/Remote Areas of Bangladesh, International Journal of Image, Graphics and Signal Processing (IJIGSP), Vol.10, No.5, pp. 24-32, 2018.DOI: 10.5815/ijigsp.2018.05.03
- A. Choklati, K. Sabri,; Cyclic Analysis of Extra Heart Sounds: Gauss Kernel based Model, International Journal of Image, Graphics and Signal Processing (IJIGSP), Vol.10, No.5, pp. 1-14, 2018.DOI: 10.5815/ijigsp.2018.05.01
