Growth dynamics of Fusarium pathogens causing head blight and Cochliobolus sativus causing spot blotch and common root rot under diverse pH values

Free access
Fusarium head blight (FHB) caused by several Fusarium pathogens, spot blotch (SB) and common root rot (CRR) caused by Cochliobolus sativus are well-studied diseases of wheat and barley, leading to significant yield and quality losses globally. One study has analyzed the growth dynamics of one FHB species; however, no reports are available concerning SB and CRR diseases. To end this, the effect of diverse pH values on the mycelial growth of 16 FHB isolates of four pathogens ( F. culmorum , F. verticillioides , F. solani and F. equiseti ) and 54 C. sativus cultures (32 SB isolates + 22 CRR isolates) was investigated under in vitro conditions. The daily measurement findings of the mycelial growth zone in the control and fungal pathogen treatments were adjusted to the logistic model and Gompzert model to characterize the development of mycelium for each isolate under the same conditions. In the medium containing growing values of pH, FHB, SB and CRR pathogens grew at slower rates, inversely proportional to the value level. Logistic model and Gompzert model exhibited mean variance more than 97%, and the Gompzert model found to be more applicable because of better fit to the experimental data. Therefore, this model was selected to evaluate the impacts of the diverse pH concentrations on the kinetic parameters of FHB, SB and CRR fungal growth. Wide diversity among Fusarium and Cochliobolus isolates was detected, yet such differences did not distinguish among the five tested fungal species. To our best knowledge, this is the first report showing the significance of the Gompertz model to analyze the growth dynamics of several Fusarium and Cochliobolus pathogens under changeable pH conditions.
Growth kinetics, in vitro, phenotypic variability
Short address: https://sciup.org/143184714
IDR: 143184714
Text of the scientific article Growth dynamics of Fusarium pathogens causing head blight and Cochliobolus sativus causing spot blotch and common root rot under diverse pH values
Wheat (Triticum aestivum) and barley (Hordeum vulgare) are the second and fourth most important cereal crops around the world, respectively (FAO, 2022). Wheat is planted over a wide range of climates globally (Larson, 2015). It provides a main source of dietary fiber, protein, and energy in human nutrition (Van Buul and Brouns, 2014). Barley is one of the important feed grains and most ancient in the world. It is one of the most dependable Poaceae cereal crops where there is an alkaline soil, drought, or summer/winter frost (Gous et al., 2015). Wheat and barley are cultivated in several parts of the world, with Triticum aestivum production being concentrated in USA, India and China, while Hordeum vulgare production is highest in France, Russia, and Germany (FAO, 2022). Triticum and Hordeum production is restricted by several biotic constraints, with diseases being a main limiting factor to wheat and barley production worldwide. he overall number of Triticum and Hordeum diseases exceeds 200, but 50 diseases are largely distributed and cause economic losses (Sharma et al., 2018). Fusarium head blight (FHB) caused by several Fusarium pathogens and spot blotch (SB) and common root rot (CRR) caused by Cochliobolus sativus are noxious diseases of Triticum and Hordeum which lead to significant yield and quality losses globally (Kumar et al., 2020; Sakr, 2023). However, little is known regarding developmental characters that reflect phenotypic variance and lifehistory strategies in these fungal pathogens (Kumar et al., 2020; Sakr, 2022). In addition, studies of phenotypic plasticity performed with only a few FHB species (Pagnussatt et al., 2013) are not sufficiently representative of head blight population diversity.
One possibility to analyze in more detail the growth dynamics of Fusarium and Cochliobolus fungal structures is via the application of a mathematical function to fungal growth curves. his technique can be employed to quantify growth parameters and validate biological observations. Several primary tools characterize either sporulation/germination or mycelium growth kinetics of different fungal species on food products ( remarin et al., 2015). he Gompertz function is a suitable predictive model applied in nonlinear fungal growth curves that analyze quantitative criteria such as lag phase, growth and fungal growth rate (Nevarez et al., 2009). he mathematical equation of Gompertz reparameterized by Zwiertering et al., (1990) first was utilized by Declerck et al., (2001) for modeling sporulation kinetics of three Glomeraceae pathogens under monoxenic cultures. Declerck et al., (2004) employed the identical equation for analyzing the growth kinetics of extraradical structures of a Gigasporaceae pathogen. A Gompertz model was utilized to describe the development of spores and mycelium for 14 Rhizophagus strains under the monoxenic conditions, leading to asses the spore formation and growth dynamics of extraradical mycelium (Silvani et al., 2014). Regarding FHB-small grain cereal, Spirulina LEB-18 phenolic extract was evaluated by using a Gompertz model for its antifungal activity on 12 toxigenic isolates of F. graminearum sampled from Triticum and Hordeum (Pagnussatt et al., 2013).
Physical and physicochemical characters such as pH, aeration, water potential, temperature, and agitation speed have a main influence on fungus. hese parameters not only modify fungal growth levels, but they can also play as developmental pathway triggers. he impact of environmental variables impacts fungal development as well as their capacity to adapt to environmental conditions (Mensah-Attipoe and oyinbo, 2019). Other researches examine the impacts of the environmental conditions on fungal growth directly, by assessing modifications in the mycelium (Pasanen et al., 1991). Fungal growth can start in as little as an hour under particular conditions of pH (Miller, 2001). he pH has an influence on saprophytic and pathogenic fungal sporulation and growth. It is widely understood that some fungi have optimal pH, as well as maximum and minimum growth conditions. he pH is one of the most significant variables affecting the microbial flora. Some biotic parameters like carbon availability are highly influenced by pH (Rousk et al., 2009). More recently, several growth circumstances, i.e., diverse pH levels, had an effect on biomass growth in several pathogens of fungi and optimal growth was highlighted by F. begonia, Cladosporium spp., and Mucor spp. (Mustafa et al., 2023). Our earlier findings provide conclusive evidence that inhibition of fungal growth of FHB, SB and CRR diseases was principally due to the alkaline pH effect of NaOH (Sakr, 2021). However, no reports are available in the phytopathological literature regarding the use of Gompzert model to characterize the development of mycelium for head blight, spot blotch and common root rot isolates under changeable pH conditions. In addition, the extent and rapidity at which the external mycelia develop in plant tissues could be related to the capacity of FHB, SB and CRR fungi to survive under diverse environmental variables. We hypothesize that phenotypic diversity in such ecologically important lifehistory features may contribute to the colonization and propagation of head blight, spot blotch and common root rot fungal isolates in heterogeneous environments.
he aim of this study was to investigate the growth dynamics of mycelium among F. culmorum, F. verticillioides, F. solani, F. equiseti and C. sativus in media containing growing values of pH. Characterizing fungal development under environmentally-controlled conditions may aid to better understand the growth dynamics of mycelium of important fungal species causing destructive diseases on wheat and barley worldwide.
MATERIALS AND METHODS
Isolation and growth of FHB, SB and CRR fungi
All fungal cultures were isolated from Triticum and Hordeum fields in 2015 growing season. he sixteen single-spore derived Fusarium cultures utilized in this work were sampled from wheat spikes displayed typical FHB disease symptoms. Fusarium fungi were identified based on observations of structures such as the spores and mycelia under an optical microscope comparing them with literature observations and were found to belong to four FHB species, i.e., F. culmorum, F. solani, F. verticillioides (synonym F. moniliforme) and F. equiseti. he 16 Fusarium isolates causing head blight disease were recently analyzed using random amplified polymorphic DNA markers (Sakr, 2023). Fifty four C. sativus isolates were sampled from both naturally infected Hordeum leaves presenting SB symptoms (32 isolates) and Hordeum sub-crown internodes exhibiting CRR symptoms (22 isolates) in different regions of Syria. Isolation and morphology-based characterization of the fifty four C. sativus isolates were carried out under an optical microscope comparing them with literature reports. Cultures of FHB, SB and CRR fungi were grown on potato dextrose agar (PDA) at 22±1 ºC under continuous darkness to sporulation and maintained in sterile distilled water at 4°C and by freezing at -16°C until used (Sakr, 2020) and then recovered by subculture on PDA.
Determination of optimum growth rate o obtain the optimum growth rate on PDA medium, seventy fungal isolates of F. culmorum, F. verticillioides, F. solani, F. equiseti and C. sativus were cultivated in PDA in the dark at 22 ± 1 for three continuous days. he mean pH concentration of all PDA dishes was equivalent to 6.56. he concentrations of fungal growth under normal conditions for all analyzed Fusarium and Cochliobolus pathogens were presented previously by Sakr (2021).
Effect of pH on fungal growth he fungal isolates of the five analyzed pathogens were cultured on PDA medium with diverse pH values (8.79, 9.57, 10.19 and 10.59) to detect the impact of changeable pH levels on fungal development. he pH was maintained utilizing 4 M NaOH (Avonchem, SK 116PJ) in which the pH value of 4 M NaOH was equivalent to 14. he pH of each solution was evaluated with a pH meter (Hanna Ins., HI 8521). he pH of the amended PDA medium could not be assessed directly because it was solid; however, measurements of pH levels amended potato dextrose broth (PDB) were carried out before the addition of agar. he values of fungal growth under changeable pH conditions for all tested Fusarium and Cochliobolus pathogens were presented previously by Sakr (2021).
Experiment design and measurements of growth dynamics he daily measurement observations for three consecutive days of the mycelial growth zone in the control and FHB, SB and CRR pathogens treatments were adjusted to the logistic model and Gompzert model in order to detected the maximum growth rate and lag phase length ( able 1) as described by Hamidi-Esfahani et al., (2007). Comparison of the models was carried out utilizing the correlation coefficient (R2) to assess the goodness of fit between the model applied and the data observed.
Statistical analyses he experimental data were analyzed using DSAAS A add-in version 2011. Conventional statistical methods were utilized to calculate means and standard deviations. Data were analyzed statistically by ANOVA for significant differences (p<0.05). o ascertain significant differences between the levels of the main factor, Fisher’s LSD test was applied between means.
RESULTS AND DISCUSSION
In microbiology, growth rates have long been utilized to quantify phenotypic characteristics. Experimental evolution researches have often utilized growth rates as a measure of fitness (Dykhuizen and Dean, 1990). For self-limiting cell population growth, the Gompertz model is one of the most popular non-linear equations (Hamidi-Esfahani et al., 2007). In spite of FHB, SB and CRR are well-studied diseases of Poaceae cereal-crops due to their destructive impacts of wheat and barley quality and quantity, rare observations are available only for one FHB species (Pagnussatt et al., 2013) and no reports exist for Cochliobolus sativus . o fill this gap, we characterizes in the present work new insights into the growth kinetics of several fungal isolates showing diverse morphological and pathological characteristics belonging to Fusarium and Cochliobolus genera (Sakr, 2023, unpublished data) under diverse pH levels . he alkaline pH has been found to have a crucial influence on fungal growth dynamics (Rousk et al., 2009). he essential part of fungal physiology understands the impact of pH on fungal growth. Modeling fungal disease development in building components requires a thorough understanding of how pH influences Fusarium and Cochliobolus pathogens. A similar approach to model sporulation dynamics utilizing the modified Gompertz model was applied in three Glomeraceae pathogens grown under monoxenic conditions (Declerck et al., 2001), a Gigasporaceae species (Declerck et al., 2004) and 14 Rhizophagus isolates (Silvani et al., 2014). Our work expanded this analysis to include 70 FHB, SB and CRR isolates, demonstrating its utility for modeling mycelial growth of Fusarium and Cochliobolus isolates.
Utilizing the observations of the multiplication of the 70 fungi analyzed in the absence of higher pH concentrations under normal conditions, diverse primary equations were adjusted to obtain the growth variables ( able 2): maximum exponential growth rate (μ max ) and lag phase length (t l ). Both equations, i.e., logistic model and Gompzert model, showed mean variance greater than 97%, and the Gompzert equation found more applicable due to better fit to the experimental findings. herefore, this equation was selected to evaluate the impacts of the changeable pH values on the dynamic variables of FHB, SB and CRR microbial growth ( able 3). he seventy fungi analyzed exhibited a growth latent period that varied from 0.8 to 15.5 hours for the tested Fusarium and Cochliobolus isolates in the control media. Under the same conditions, the exponential growth level varied from 0.011 to 0.026 h–1 ( able 3). In accordance with the present results, Pagnussatt et al., (2013) reported that growth latent period varied from 1.0 to 14.7 hours and the exponential growth level changed from 0.014 to 0.024 h–1. In the medium containing growing values of pH, Fusarium and Cochliobolus pathogens grew at slower rates, inversely proportional to the value level. herefore, the higher pH concentrations decreased the growth rate of head blight, spot blotch and common root rot pathogens studied ( able 3). When the culture medium with 10.59 pH value was utilized, a slower lag phase was observed since, on average, the FHB, SB and CRR fungal development first became apparent 24 hours after incubation, showing the fungistatic effect of the pH (Miller, 2011), especially for several Fusarium and Cochliobolus pathogens ( able 3) as reported by Sakr (2021). However, when the pH rate reached 10.59 in the culture medium, its mycelial growth levels decreased ( able 3).
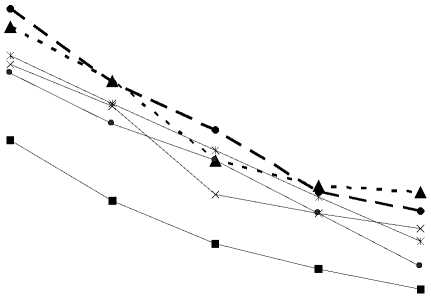
Growth curves of sporulation and development for each FHB, SB and CRR species grown under similar conditions are illustrated (Figure 1). In general, all Fusarium and Cochliobolus pathogens followed a typical sigmoid curve for the development of mycelium, and three main phases could be identified: lag, exponential and stationary. Large diversity among FHB, SB and CRR isolates was identified in the present investigation ( ables 2 and 3), yet such differences did not distinguish among the five tested species (Figure 1). All analyzed fungal pathogens had the idenical growth behavior on PDA medium with diverse pH values. he groups could be distinguished as either slow or fast colonizers or those with an intermediate pattern of growth. In accordance with our data, Silvani et al., (2014) reported significant differences in 14 Rhizophagus strains, such differences did not conclusively correspond to phylogenetic links among closely related strains based on partial SSU nrDNA sequences.
It has widely reported that pH is crucial variable for comprehending the ecology of fungi, especially mycotoxigenic pathogens. Fungal pathogens have a wide range of alkaline/acid requisites for development, changing from pH 3.0 to more than pH 8.0, with an ideal pH of approximately pH 5.0, assuming nutritional needs are met (Elzwai et al., 2018). Bousset et al., (2018) reported that fungal development is influenced by pH of the growth medium. Fungi can develop and grow in a variable range of pH environments in contrast to other microorganisms [16]. According to Cao et al., (2007), yeast hyphae and cells both thrived best in pH changes of 4.1–10.1, which is comparable to that of other dimorphic fungi such as Paracoccidioides brasiliensis and Sporothrix schenckii. Rousk et al., (2009) analyzed the impacts of soil pH on fungal and bacterial biomass and growth, and their work reported that fungal development data were substantially more sensitive than biomass-based observations for detecting the relevance of decomposer groups. Yamanaka (2003) analyzed how pH influences the capacity of saprotrophic fungi to proliferate. he in vitro growth of these fungi was linked with the pH of the forest soil where they were first found (Yamanaka, 2003).
he inhibition data of changeable pH degrees generated in this study are in harmony with those observed by other authors who have analyzed F. begonia, Cladosporium spp., and Mucor spp. (Mustafa et al., 2023). he inhibition of mycelial growth in all of the pathogens analyzed can be attributed to the fact that the pH is acting on the mycelium hyphae leading to integrity of the hypha, loss of rigidity, and discharge of cytoplasmic components resulting in the death and collapse of the mycelium, in accordance to that reported by Rousk et al., (2009).
—■— F. culmorum
e 45
£
8 35
■S
Я
3 25
w
-
— •— F. solani
-
■ ■ ^в ■ F. verticillioides
--X F. equiseti
-
— ж Cochliobolus sativus
9.57 10.19 10.59
causing spot blotch
--•--- C. sativus causing common root rot
normal pH 8.79
value: 5 .5 6
Changeable pH values
Figure 1. Fungal growth curves representing the average values of 5 isolates of F. culmorum , 6 isolates of F. solani , 4 isolates of F. verticillioides , one isolate of F. equiseti , 32 isolates for Cochliobolus sativus causing spot blotch and 22 isolates for C. sativus causing common root rot grown on potato-dextrose agar medium added with changeable pH values. hese curves were fitted with the Gompertz model. he values of fungal growth under changeable pH conditions for all tested Fusarium and Cochliobolus pathogens were presented previously by Sakr (2021); these values were treated by Gompertz model in the present work to present the growth dynamics of all tested fungi
Table 1: Variables of the Logistic and Gompzert models linked to the maximum cellular growth rate (μ max ) and lag phase length (t 1 )
|
Logistic |
Gompzert |
|
μ max =(A A *B)/4 |
μ max = (A A *B)/е |
|
t 1 = (D – 2)/B |
t 1 = M – (1/B) |
A: variable that characterizes logarithmic growth of the population, D: variable linked to cell growth and B: dimensionless variable.
Table 2: Logistic and Gompzert models of Fusarium head blight, spot blotch and common root rot growth curves in the absence of growing pH levels
|
Fungal isolates (identification) |
Logistic model |
Gompzert model |
||||
|
μ max |
t 1 |
R2 |
μ max |
t 1 |
R2 |
|
|
F1 ( F. culmorum ) |
0.017 |
7.1 |
98.3 |
0.015 |
1.3 |
99.3 |
|
F2 ( F. culmorum ) |
0.016 |
19.5 |
97.3 |
0.011 |
2.5 |
99.6 |
|
F3 ( F. culmorum ) |
0.020 |
14.5 |
99.4 |
0.020 |
3.1 |
99.5 |
|
F7 ( F. solani ) |
0.017 |
7.3 |
99.2 |
0.021 |
2.6 |
99.5 |
|
F15 ( F. verticillioides ) |
0.018 |
6.8 |
98.6 |
0.023 |
8.0 |
99.4 |
|
F16 ( F. verticillioides ) |
0.016 |
6.9 |
99.1 |
0.024 |
4.5 |
99.3 |
|
F20 ( F. solani ) |
0.025 |
18.7 |
98.7 |
0.018 |
12.3 |
99.4 |
|
F21 ( F. verticillioides ) |
0.022 |
7.3 |
97.5 |
0.016 |
4.4 |
99.4 |
|
F26 ( F. solani ) |
0.018 |
19.6 |
99.2 |
0.014 |
13.2 |
99.6 |
|
F27 ( F. verticillioides ) |
0.019 |
3.9 |
98.5 |
0.020 |
14.5 |
99.7 |
|
F28 ( F. culmorum ) |
0.019 |
7.1 |
98.6 |
0.021 |
11.5 |
99.5 |
|
F30 ( F. culmorum ) |
0.016 |
7.3 |
98.4 |
0.023 |
0.8 |
99.6 |
|
F29 ( F. solani ) |
0.017 |
19.5 |
98.1 |
0.022 |
13.3 |
99.5 |
|
F31 ( F. solani ) |
0.018 |
16.5 |
99.5 |
0.024 |
14.5 |
99.5 |
|
F35 ( F. solani ) |
0.019 |
14.8 |
99.1 |
0.018 |
8.9 |
99.2 |
|
F43 ( F. equiesti ) |
0.016 |
19.7 |
99.5 |
0.016 |
12.6 |
99.3 |
|
C.S. 2 (SB) |
0.020 |
15.4 |
98.1 |
0.018 |
6.8 |
99.2 |
|
C.S. 7 (SB) |
0.021 |
7.9 |
99.4 |
0.015 |
11.1 |
99.3 |
|
C.S. 9 (SB) |
0.021 |
8.9 |
97.2 |
0.021 |
10.2 |
99.1 |
|
C.S. 11 (SB) |
0.025 |
7.0 |
99.5 |
0.015 |
1.0 |
99.5 |
|
C.S. 12 (SB) |
0.016 |
4.5 |
99.2 |
0.018 |
11.2 |
99.4 |
|
C.S. 14 (SB) |
0.019 |
3.8 |
97.5 |
0.016 |
3.6 |
99.5 |
|
C.S. 15 (SB) |
0.018 |
6.5 |
99.8 |
0.017 |
13.5 |
99.5 |
|
C.S. 16 (SB) |
0.018 |
4.1 |
98.8 |
0.016 |
14.7 |
99.4 |
|
C.S. 17 (SB) |
0.016 |
6.8 |
97.6 |
0.015 |
12.5 |
99.3 |
|
C.S. 18 (SB) |
0.017 |
4.3 |
97.2 |
0.016 |
6.8 |
99.2 |
|
C.S. 19 (SB) |
0.018 |
11.2 |
97.6 |
0.015 |
8.5 |
99.3 |
|
C.S. 20 (SB) |
0.020 |
19.4 |
98.6 |
0.016 |
9.7 |
99.7 |
|
C.S. 21(SB) |
0.022 |
12.5 |
99.5 |
0.020 |
10.6 |
99.8 |
|
C.S. 26 (SB) |
0.021 |
14.6 |
98.1 |
0.021 |
12.5 |
99.7 |
|
C.S. 27 (SB) |
0.015 |
15.6 |
99.1 |
0.023 |
9.6 |
99.6 |
|
C.S. 30 (SB) |
0.016 |
17.4 |
99.0 |
0.018 |
12.0 |
99.6 |
|
C.S. 32 (SB) |
0.020 |
7.0 |
99.5 |
0.016 |
15.5 |
99.5 |
|
C.S. 34 (SB) |
0.021 |
7.1 |
98.4 |
0.017 |
11.3 |
99.4 |
|
C.S. 45 (SB) |
0.025 |
14.5 |
98.4 |
0.018 |
12.8 |
99.6 |
|
C.S. 49 (SB) |
0.022 |
17.8 |
97.2 |
0.016 |
14.2 |
99.4 |
|
C.S. 53 (SB) |
0.016 |
7.1 |
99.8 |
0.017 |
9.6 |
99.3 |
|
C.S. 55 (SB) |
0.018 |
15.1 |
98.6 |
0.018 |
10.2 |
99.3 |
|
C.S. 59 (SB) |
0.015 |
17.9 |
99.1 |
0.017 |
1.1 |
99.6 |
|
C.S. 63 (SB) |
0.018 |
17.1 |
98.2 |
0.023 |
1.9 |
99.6 |
|
C.S. 74 (SB) |
0.016 |
11.0 |
98.0 |
0.025 |
2.6 |
99.2 |
|
C.S. 80 (SB) |
0.015 |
10.9 |
98.7 |
0.015 |
3.7 |
99.8 |
|
C.S. 83 (SB) |
0.019 |
19.5 |
97.1 |
0.019 |
5.6 |
99.5 |
|
C.S. 86 (SB) |
0.020 |
7.8 |
99.1 |
0.017 |
13.6 |
99.6 |
|
C.S. 87 (SB) |
0.021 |
19.7 |
97.4 |
0.021 |
12.5 |
99.4 |
|
C.S. 89 (SB) |
0.021 |
6.8 |
98.2 |
0.023 |
11.0 |
99.5 |
|
C.S. 92 (SB) |
0.022 |
7.1 |
97.5 |
0.014 |
10.9 |
99.6 |
|
C.S. 89 (SB) |
0.021 |
9.8 |
98.8 |
0.015 |
9.1 |
99.6 |
|
C.S. 1 (CRR) |
0.018 |
11.1 |
99.0 |
0.020 |
2.5 |
99.5 |
|
C.S. 5 (CRR) |
0.016 |
12.8 |
99.1 |
0.021 |
6.5 |
99.5 |
|
C.S. 6 (CRR) |
0.018 |
7.8 |
99.2 |
0.025 |
4.8 |
99.4 |
|
C.S. 8 (CRR) |
0.023 |
11.5 |
98.5 |
0.019 |
6.1 |
99.6 |
|
C.S. 10 (CRR) |
0.025 |
6.8 |
97.7 |
0.015 |
8.0 |
99.4 |
|
C.S. 13 (CRR) |
0.015 |
12.8 |
98.0 |
0.021 |
11.2 |
99.4 |
|
C.S. 23 (CRR) |
0.015 |
15.9 |
99.2 |
0.018 |
12.5 |
99.5 |
|
C.S. 24 (CRR) |
0.016 |
3.9 |
99.3 |
0.016 |
10.6 |
99.5 |
|
C.S. 25 (CRR) |
0.016 |
12.5 |
98.9 |
0.024 |
11.6 |
99.5 |
|
C.S. 28 (CRR) |
0.018 |
3.1 |
98.5 |
0.017 |
10.9 |
99.6 |
|
C.S. 36 (CRR) |
0.021 |
19.5 |
97.1 |
0.021 |
12.3 |
99.8 |
|
C.S. 37 (CRR) |
0.023 |
7.1 |
99.1 |
0.018 |
9.8 |
99.7 |
|
C.S. 38 (CRR) |
0.016 |
7.9 |
99.6 |
0.016 |
6.5 |
99.5 |
|
C.S. 40 (CRR) |
0.018 |
13.4 |
97.1 |
0.018 |
4.7 |
99.2 |
|
C.S. 41 (CRR) |
0.018 |
6.8 |
98.5 |
0.016 |
8.5 |
99.3 |
|
C.S. 44 (CRR) |
0.017 |
12.9 |
99.1 |
0.016 |
11.2 |
99.5 |
|
C.S. 46 (CRR) |
0.018 |
12.0 |
99.5 |
0.018 |
12.1 |
99.4 |
|
C.S. 47 (CRR) |
0.018 |
12.7 |
99.1 |
0.021 |
11.0 |
99.5 |
|
C.S. 48 (CRR) |
0.019 |
7.1 |
99.2 |
0.017 |
10.6 |
99.5 |
|
C.S. 50 (CRR) |
0.017 |
7.3 |
98.7 |
0.026 |
9.3 |
99.5 |
|
C.S. 51 (CRR) |
0.018 |
6.8 |
97.8 |
0.014 |
8.1 |
99.4 |
|
C.S. 52 (CRR) |
0.018 |
15.4 |
97.6 |
0.021 |
6.1 |
99.5 |
|
P significance |
p<0.001 |
p<0.001 |
p<0.001 |
p<0.001 |
Abbreviations: μ max : maximum cellular growth rate; t 1 : lag phase length; R2: correlation coefficient. he values of fungal growth under normal conditions for all tested Fusarium and Cochliobolus pathogens were presented previously by Sakr (2021).
Table 3: Maximum growth rate of Fusarium head blight, spot blotch and common root rot fungi treated with variable pH values
|
Fungal isolates (identification) |
μ max (h -1 ) |
|||
|
pH values |
||||
|
8.79 |
9.57 |
10.19 |
10.59 |
|
|
F1 ( F. culmorum ) |
0.013 (84.6) |
0.008 (99.1) |
0.011 (91.1) |
0.014 (82.8) |
|
F2 ( F. culmorum ) |
0.004 (99.3) |
0.006 (98.2) |
0.010 (95.2) |
0.008 (88.8) |
|
F3 ( F. culmorum ) |
0.009 (94.6) |
0.010 (84.5) |
0.014 (99.2) |
0.014 (91.9) |
|
F7 ( F. solani ) |
0.014 (87.6) |
0.007 (88.2) |
0.008 (99.1) |
0.008 (88.5) |
|
F15 ( F. verticillioides ) |
0.008 (91.9) |
0.010 (89.5) |
0.014 (89.5) |
0.004 (91.5) |
|
F16 ( F. verticillioides ) |
0.004 (87.6) |
0.014 (91.2) |
0.008 (88.4) |
0.011 (96.3) |
|
F20 ( F. solani ) |
0.007 (99.3) |
0.008 (93.2) |
0.004 (81.4) |
0.010 (96.5) |
|
F21 ( F. verticillioides ) |
0.011 (99.2) |
0.014 (84.2) |
0.008 (89.5) |
0.014 (84.5) |
|
F26 ( F. solani ) |
0.008 (94.6) |
0.008 (89.5) |
0.004 (91.1) |
0.008 (95.6) |
|
F27 ( F. verticillioides ) |
0.006 (96.5) |
0.004 (91.1) |
0.011 (95.6) |
0.010 (99.1) |
|
F28 ( F. culmorum ) |
0.004 (98.1) |
0.011 (92.3) |
0.010 (88.4) |
0.006 (88.8) |
|
F30 ( F. culmorum ) |
0.013 (99.1) |
0.010 (91.1) |
0.014 (81.4) |
0.010 (96.5) |
|
F29 ( F. solani ) |
0.005 (96.5) |
0.014 (88.4) |
0.008 (88.2) |
0.007 (88.5) |
|
F31 ( F. solani ) |
0.004 (95.6) |
0.008 (87.8) |
0.010 (89.6) |
0.011 (84.5) |
|
F35 ( F. solani ) |
0.010 (94.5) |
0.014 (89.6) |
0.006 (88.5) |
0.010 (88.8) |
|
F43 ( F. equiesti ) |
0.006 (90.2) |
0.008 (84.5) |
0.010 (90.2) |
0.004 (95.6) |
|
C.S. 2 (SB) |
0.012 (85.2) |
0.004 (88.4) |
0.007 (92.1) |
0.010 (95.6) |
|
C.S. 7 (SB) |
0.011 (88.7) |
0.011 (99.2) |
0.011 (93.5) |
0.009 (82.8) |
|
C.S. 9 (SB) |
0.009 (88.4) |
0.010 (94.5) |
0.010 (88.5) |
0.008 (94.7) |
|
C.S. 11 (SB) |
0.013 (96.5) |
0.014 (90.2) |
0.014 (89.5) |
0.010 (91.5) |
|
C.S. 12 (SB) |
0.005 (94.5) |
0.008 (89.5) |
0.008 (87.4) |
0.008 (96.3) |
|
C.S. 14 (SB) |
0.004 (94.5) |
0.014 (94.7) |
0.004 (87.4) |
0.004 (94.5) |
|
C.S. 15 (SB) |
0.008 (99.1) |
0.008 (88.4) |
0.011 (92.1) |
0.011 (91.9) |
|
C.S. 16 (SB) |
0.006 (98.4) |
0.004 (88.5) |
0.008 (96.5) |
0.010 (96.5) |
|
C.S. 17 (SB) |
0.010 (96.5) |
0.011 (97.4) |
0.004 (98.4) |
0.014 (94.7) |
|
C.S. 18 (SB) |
0.007 (94.7) |
0.010 (99.1) |
0.004 (84.7) |
0.008 (88.4) |
|
C.S. 19 (SB) |
0.010 (93.5) |
0.014 (99.2) |
0.010 (88.4) |
0.010 (95.6) |
|
C.S. 20 (SB) |
0.014 (99.2) |
0.006 (89.5) |
0.006 (86.5) |
0.006 (88.5) |
|
C.S. 21(SB) |
0.008 (89.5) |
0.010 (99.5) |
0.010 (84.7) |
0.010 (96.5) |
|
C.S. 26 (SB) |
0.004 (88.5) |
0.007 (99.2) |
0.007 (84.5) |
0.007 (95.6) |
|
C.S. 27 (SB) |
0.011 (88.4) |
0.011 (88.5) |
0.014 (88.1) |
0.011 (90.2) |
|
C.S. 30 (SB) |
0.007 (84.5) |
0.010 (81.4) |
0.008 (98.5) |
0.010 (82.8) |
|
C.S. 32 (SB) |
0.008 (99.5) |
0.004 (88.2) |
0.010 (95.1) |
0.010 (92.6) |
|
C.S. 34 (SB) |
0.011 (95.6) |
0.010 (91.1) |
0.006 (99.1) |
0.014 (88.8) |
|
C.S. 45 (SB) |
0.011 (99.1) |
0.014 (92.5) |
0.008 (95.6) |
0.008 (95.5) |
|
C.S. 49 (SB) |
0.008 (94.5) |
0.008 (91.1) |
0.010 (85.4) |
0.004 (99.2) |
|
C.S. 53 (SB) |
0.006 (95.5) |
0.004 (92.5) |
0.006 (88.4) |
0.014 (91.9) |
|
C.S. 55 (SB) |
0.008 (96.3) |
0.011 (94.5) |
0.010 (91.5) |
0.008 (81.4) |
|
C.S. 59 (SB) |
0.011 (95.5) |
0.010 (99.2) |
0.007 (95.6) |
0.004 (88.5) |
|
C.S. 63 (SB) |
0.004 (99.2) |
0.014 (99.2) |
0.011 (99.1) |
0.011 (96.5) |
|
C.S. 74 (SB) |
0.010 (99.5) |
0.010 (88.4) |
0.010 (99.4) |
0.010 (82.8) |
|
C.S. 80 (SB) |
0.006 (98.6) |
0.007 (81.4) |
0.010 (81.4) |
0.007 (99.2) |
|
C.S. 83 (SB) |
0.010 (94.7) |
0.011 (88.2) |
0.014 (89.5) |
0.010 (96.3) |
|
C.S. 86 (SB) |
0.007 (99.2) |
0.010 (89.5) |
0.008 (88.5) |
0.005 (99.1) |
|
C.S. 87 (SB) |
0.011 (99.2) |
0.004 (84.5) |
0.008 (89.6) |
0.010 (91.9) |
|
C.S. 89 (SB) |
0.010 (91.4) |
0.010 (99.1) |
0.004 (91.1) |
0.008 (96.5) |
|
C.S. 92 (SB) |
0.004 (92.5) |
0.009 (88.5) |
0.010 (92.5) |
0.008 (88.4) |
|
C.S. 89 (SB) |
0.010 (99.6) |
0.005 (89.1) |
0.010 (99.3) |
0.004 (82.8) |
|
C.S. 1 (CRR) |
0.009 (98.4) |
0.009 (81.5) |
0.005 (88.4) |
0.004 () |
|
C.S. 5 (CRR) |
0.013 (88.4) |
0.005 (88.4) |
0.008 (88.5) |
0.011 () |
|
C.S. 6 (CRR) |
0.013 (82.8) |
0.008 (86.8) |
0.008 (84.5) |
0.010 (81.4) |
|
C.S. 8 (CRR) |
0.005 (84.5) |
0.008 (81.4) |
0.010 (87.5) |
0.013 (88.9) |
|
C.S. 10 (CRR) |
0.010 (88.9) |
0.010 (91.4) |
0.007 (81.4) |
0.013 () |
|
C.S. 13 (CRR) |
0.007 (99.2) |
0.007 (92.2) |
0.010 (88.6) |
0.005 (91.9) |
|
C.S. 23 (CRR) |
0.008 (91.5) |
0.010 (95.5) |
0.013 (88.4) |
0.010 () |
|
C.S. 24 (CRR) |
0.011 (89.4) |
0.005 (99.2) |
0.005 (91.5) |
0.010 (96.5) |
|
C.S. 25 (CRR) |
0.005 (88.7) |
0.008 (99.5) |
0.006 (99.2) |
0.005 () |
|
C.S. 28 (CRR) |
0.004 (91.2) |
0.008 (99.1) |
0.008 (99.7) |
0.013 (82.8) |
|
C.S. 36 (CRR) |
0.005 (95.5) |
0.010 (99.2) |
0.004 (84.7) |
0.008 (88.9) |
|
C.S. 37 (CRR) |
0.004 (95.4) |
0.007 (93.5) |
0.010 (88.4) |
0.010 () |
|
C.S. 38 (CRR) |
0.010 (95.1) |
0.010 (99.5) |
0.014 (90.6) |
0.007 (91.9) |
|
C.S. 40 (CRR) |
0.005 (98.1) |
0.009 (92.5) |
0.008 (90.5) |
0.010 (88.4) |
|
C.S. 41 (CRR) |
0.013 (96.5) |
0.005 (88.8) |
0.004 (95.4) |
0.005 () |
|
C.S. 44 (CRR) |
0.005 (99.2) |
0.008 (84.5) |
0.011 (99.6) |
0.010 (82.8) |
|
C.S. 46 (CRR) |
0.006 (88.7) |
0.008 (84.1) |
0.010 (99.2) |
0.005 (88.9) |
|
C.S. 47 (CRR) |
0.008 (84.4) |
0.010 (94.4) |
0.011 (99.8) |
0.008 (92.7) |
|
C.S. 48 (CRR) |
0.004 (87.4) |
0.010 (99.1) |
0.013 (88.5) |
0.008 (88.9) |
|
C.S. 50 (CRR) |
0.010 (99.1) |
0.010 (92.7) |
0.005 (88.6) |
0.010 (91.9) |
|
C.S. 51 (CRR) |
0.011 (92.5) |
0.007 (92.1) |
0.006 (88.4) |
0.007 (92.7) |
|
C.S. 52 (CRR) |
0.009 (98.5) |
0.010 (99.1) |
0.010 (88.5) |
0.008 (88.9) |
|
P significance |
p<0.001 |
p<0.001 |
p<0.001 |
p<0.001 |
Results relative to μmax were estimated according to Gompzert model in which P significance was added. Values are expressed as means (R2). he values of fungal growth under changeable pH conditions for all tested Fusarium and Cochliobolus pathogens were presented previously by Sakr (2021).
CONCLUSION
Variations in FHB, SB and CRR fungi growth rates were analyzed with a focus on one growth factor, i.e., pH. In spite of high overall variations in the growth patterns among the 70 isolates tested here, it was not possible to distinguish among the five tested Fusarium and Cochliobolus species. o our best knowledge, this is the first report showing the significance of the Gompertz model to analyze the growth dynamics of several Fusarium and Cochliobolus pathogens under changeable pH conditions. Identifying how a fungus population grows enables us to foresee and manage its growth in a given circumstance. Also, understanding the ideal environmental parameters for fungi enables future research works and studies to grow them more efficiently. Additional research should be aimed at elucidating growth kinetics under other physical and chemical parameters.
ACKNOWLEDGMENTS he author would like to thank Director General of the Syrian Atomic Energy Commission (Dr I. Othman) and the Head of the Department of Agriculture (Dr M. Zarkawi) for supporting this project.
CONFLICTS OF INTEREST he authors declare that they have no potential conflicts of interest.
