Growth, nitrogen uptake and carbon isotope discrimination in barley genotypes grown under saline conditions

Author: Kurdali Fawaz, Al-Ain Farid, Al-Chammaa Mohammad
Journal: Журнал стресс-физиологии и биохимии @jspb
Article in issue: 3 т.8, 2012.
Free access
The effect of different salinity levels of irrigation water (ECw range 1-12 dS/m) on dry matter yield, nitrogen uptake, fertilizer nitrogen use efficiency (%NUE), stomatal conductance and carbon isotope discrimination (Δ13C‰) in three barley genotypes originating from different geographic areas (Arabi.Abiad, Syria; Pk-30-136, Pakistan and WI-2291, Australia) was investigated in a pot experiment. An increase in salinity resulted in a decrease in Δ13C in all the genotypes. Increasing salinity reduced leaf stomatal conductance which was less pronounced in WI-2291 comparing to other genotypes. At high salinity level, the reduction in Δ13C corresponded to a considerable decrease in the ratio (Ci/Ca) of intercellular (Ci) and atmospheric (Ca) partial pressures of CO2 in all the genotypes indicating that such a decrease was mainly due to the stomatal closure. Moreover, since the reduction in dry matter yield in all the genotypes grown at 12 dS/m did not exceed 50% in comparison with their controls, the photosynthetic apparatus of all studied genotypes seemed to be quit tolerant to salinity. At the moderate salinity level (8dS/m), the enhancement of leaf dry matter yield in the WI2291 genotype might have been due to positive nutritional effects of the salt as indicated by a significant increase in nitrogen uptake and NUE. Thus, the lower Ci/Ca ratio could result mainly from higher rates of photosynthetic capacity rather than stomatal closure. On the other hand, relationships between dry matter yield or NUE and Δ13C seemed to be depending on plant genotype, plant organ and salinity level. Based on growth, nutritional and Δ13C data, selection of barley genotypes for saline environments was affected by salinity level. Therefore, such a selection must be achieved for each salinity level under which the plants have been grown.
Barley, salinity, δ13c‰, 15n, stomatal conductance
Short address: https://sciup.org/14323658
IDR: 14323658
Text of the scientific article Growth, nitrogen uptake and carbon isotope discrimination in barley genotypes grown under saline conditions
Salinity is one of the most important abiotic stresses limiting crop production in arid and semiarid regions, where soil salt content is naturally high and precipitation can be insufficient for leaching. Salt affected lands are increasingly needed for production in order to meet food demands of the ever increasing human population and urbanization on earth. Saline agriculture could be a promising approach since it meets the abovementioned demands (Qureshi and Barrett-Lennard, 1998). It is profitable since it makes use of genetic resources integration and improves agricultural practices to make better use of saline land and saline irrigation water on a sustainable basis (Qureshi and Barrett-Lennard, 1998).
Barley ( Hordeum vulgare L.) is a salt-tolerant crop (Maas and Hoffman, 1977) with considerable economic importance in salinity-affected arid and semiarid regions of the world. Salt tolerance of barley has been of interest for a long time and has resulted in a considerable body of data from studies using physiological (Cramer et al., 1990; Munns and Rawson, 1999), genetic (Mano and Takeda, 1997; Ellis et al., 2002), and cytogenetic approaches (Forster et al., 1997). Salinity affects many morphological, physiological, and biochemical processes, including seed germination, plant growth, water and nutrient uptake (Zhao et al., 2007; Marschner, 1995).
During photosynthesis, C3 plants discriminate against the heavy isotope of carbon (13C) leading to less 13C in plant dry matter. Many previous studies demonstrate that carbon stable isotope composition can reflect the integrated response of physiological processes to environment. The environmental stress can alter δ13C as a result of effects on the balance between stomatal conductance and carboxilation (Bellaloui, 2011). Since water consumption and its efficient use by crops are related with yield (Tambussi et al., 2007), carbon isotope discrimination ( Δ13 C) could facilitate genotypic selection for yield owing to its negative relationship with water use efficiency in C3 species (Farquhar et al., 1989). Carbon isotope discrimination positively correlates with C i /C a , i.e.
the ratio of internal leaf CO 2 concentration to ambient CO 2 concentration (Farquhar et al., 1982). Measurement of Δ 13C gives an estimation of the assimilation-rate-weighted value of C i /C a . A lower C i /C a ratio may result either from higher rate of photosynthetic activity or from stomata closure induced by stress. Determination of Δ 13C was widely used as an indirect selection criterion for higher yield in cereals such as wheat (Rebetzke et al., 2002), barley (Craufurd et al., 1991; Teulat et al., 2001) and rice (Impa et al., 2005). The work of Condon et al. (1987) suggests that screening for high yielding wheat varieties, based on 13C discrimination, leads to similar results irrespective of whether the plants are grown in pots or in the field. Low Δ 13C values under salinity have been reported for wheat (Ansari et al., 1998, Shaheen and Hood-Nowotny, 2005a, Arslan et al., 1999), barley (Isla et al., 1998) rice (Shaheen and Hood-Nowotny, 2005b) and Kentuky bluegrass (Qian et al., 2004). Isla et al. (1998) reported that the behavior of barley plants grown under salinity stress is different from that under drought stress. Carbon isotope discrimination is a useful indicator for yield potential in barley grown under non-saline conditions; whereas, grain yield remain only reliable means for identifying salt tolerance in barley. The objectives of this study were to (i) compare plant growth (e.g. dry matter production, nitrogen uptake and fertilizer nitrogen use efficiency as determined by the 15N isotope technique) and salinity tolerance of three barley genotypes originated from various countries and (ii) examine variations of carbon isotope discrimination ( Δ 13C‰) and stomatal conductance (gs) values among three barley genotypes over a range of salinity levels of irrigation water (e.g. EC w range 112 dS/m).
MATERIALS AND METHODS
Soil properties
The used soil for this experiment was collected from Der-Alhajar Research Station located in the south-east of Damascus, Syria (33˚ 21΄ N, 36˚ 28΄ E) at 617 m above sea level . The experiment was conducted in pots, each one containing 5 kg of thoroughly mixed soil. The soil is sandy clay loam in texture, water content at field capacity varied from 30.7 to 36.1% by volume, and wilting point from 11.5 to 17.1%. Soil bulk densities ranged from 1.11 to 1.21 g cm-3 throughout the 0.6 m soil profile (Hussein et al., 2011). The main physical and chemical soil properties are: pH 7.7; Ec e 0.83 dS /m; organic matter 0.91%; cations mmol (e) /L (Ca2+ 1.10, Mg2+ 0.47, K+ 0.14, Na+ 1.27); anions mmol (e) /L (SO 4 2- 1.27, HCO 3 - 0.97, Cl- 0.74); available P (Olsen) 6.8 μg/g; total N 0.07%; NO 3 - 42.0μg/g; NH 4 + 26.1μg/g; Cation exchange capacity (CEC) 29.08 meq/100g soil; Exchangeable cations: Na+ 2.99, K+ 1.81 Ca2+ 41.51 and Mg2+ 6.76 meq/100g soil.
Planting procedure
Seeds of three barley genotypes originated from various countries (Arabi Abiad, Syria; Pk-30-136, Pakistan and WI-2291, Australia) were used in the experiment. After germination, plants were thinned to 3 plants per pot. The pots were placed outdoors under natural climatic conditions.
An equivalent fertilizer rate of 50 kg N/ha urea enriched with 2 atom %15N was applied to the soil. The N fertilizer was used in two split applications at one month interval after planting. Soil moisture level in pots was maintained around 70% of field capacity throughout the experimental period.
Salinity treatments
During the first two weeks, pots were irrigated with non-saline water. Thereafter, five saline irrigation treatments (EC1, EC2, EC3, EC4, and EC5) were applied. EC1 is the control which is ordinary non-saline water (ECw 1.1 dS/m). EC2, EC3, and EC4 were obtained by mixing EC1 with a saline ground water (ECw 19 dS/m) obtained from the Euphrates valley until the solutions EC levels were 4, 8, and 12 dS/m, respectively. As for the last treatment (EC5), plants were irrigated with gradually increased levels of water salinity (1, 4, 8 and 12 dS/m) at 15-day intervals throughout the whole experimental period.
Stomatal conductance (gs)
Midday abaxial stomatal conductance measurements were taken with a porometer (Type AP4, England) on the flag leaves of three barley genotypes. The measurements were made in triplicates for each pot in the control and salinity treatments.
Plant harvest and analysis
Plants were harvested 18 weeks after planting. Leaf, spike and root samples were oven dried at 70 °C, weighed and ground to a fine powder. Concentration of total N was measured by Kjeldahl procedure . 15N/14N-isotope ratio was measured using an emission spectrometry (Jasco-150, Japan) to calculate nitrogen fertilizer use efficiency. Concentration of C, and δ13C were determined on sub-samples (2 mg dry weight) of different plant parts using the continuous-flow isotope ratio mass spectrometry (Integra-CN, PDZ Europea Scientific Instrument, UK). Isotopic compositions are expressed using delta notation (δ ) in parts per thousand (‰): δ (‰) = [(R sample /R standard ) -1] 1000 where R is the ratio of 15N/14N or 13C/12C. The nitrogen isotope ratios are expressed relative to atmospheric air as the standard. The carbon isotope ratio in the plant sample is expressed relative to Pee
Dee belemnite (PDB) standard which is a fossil of Belemnita americana from the Pee Dee geologic formation in South Carolina. Carbon isotope discrimination ( ∆ 13C) was calculated according to Farquhar et al. (1982):
∆ 13C = (δ 13 C air - δ 13C sample ) / (1 - δ 13C sample /1000) where δ 13C air is the δ13C value in air (-8‰) and δ 13C sample is the measured value in the plant.
Whole plant Δ 13C (‰) was calculated as an average of leaves (L), spikes (S) and roots (R) Δ 13C weighted by the total C content (mg) of leaves, spikes and roots:
Whole-plant Δ 1 3C = [(L Δ 13C x L C ) + (S Δ 13C x S C ) + (R Δ 13C x R C )]/ (L C + S C +R C )
Statistical analysis
The data were subjected to analysis of variance (ANOVA) test, and means were compared using the Least Significant Difference (Fisher’s PLSD) test at the 0.05 level confidence.
RESULTS
Dry matter and nitrogen yield
Dry matter yield (DM) in different plant parts was affected by barley genotype and salinity levels (Table 1 and Fig. 1). The highest salinity level (12 dS/m) reduced leaf DM by 18, 32 and 18% for A. Abiad, Pk-30-136 and WI-2291, respectively. Irrigation with saline water produced a significant decrease in leaf dry matter yield of PK-30-136 genotype. No significant decrease was observed in A. Abiad at EC w of 4 and 8 dS/m. However, DM in WI-2291 genotype increased as salt level increased to 8 dS/m and decreased with increases salinity to 12 dS/m. Leaf DM in plants irrigated with gradually increased levels of water salinity (EC5) increased by 12% in A. Abiad and decreased by 13% in Pk-30-136, while it was relatively similar to that in the
148 control of WI2291 genotype. For roots, significant decreases in DM were observed in all the genotypes. From a spike production standpoint, although A. Abiad surpassed the other genotypes in maintaining higher spike yields under different salinity treatments, no significant differences were observed between EC1, EC2 and EC4 treatments. However, the Pk-30-136 showed greater spike yield under saline conditions in comparison with its control. The WI-2291 showed a relatively constant spike yield under different salinity treatments (1-12dS/m). In EC5 treatment, significant increases in spike DM were observed in all the genotypes. In the whole plant, only the highest salinity level (12 dS/m) significantly reduced DM. The observed values were 21, 17 and 16% lower than those of the control for A. Abiad, PK-30-136 and WI-2291, respectively.
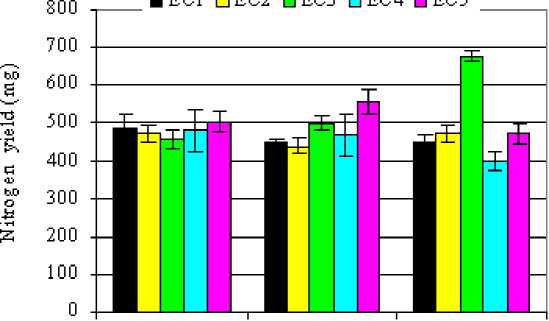
Total N (TN) yield in different plant parts is shown in Table 2. No significant decrease was observed in A. Abiad at various salinity treatments. Irrigation with saline water produced a significant decrease in leaf nitrogen matter yield of Pk-30-136 genotype. However, TN in WI-2291 genotype increased as salt level increased to 8 dS/m and decreased with increases salinity to 12 dS/m. For roots, significant decreases in TN were observed only in A. Abiad and Pk-30-136 genotypes at the highest salinity level (12 dS/m). In spikes, A. Abiad surpassed the other genotypes in maintaining higher spike N yields under different salinity treatments with no significant differences being obtained between the control and 1, 4, 8 and 12dS/m treatments. However, the Pk-30-136 showed greater spike N yield under saline treatments in comparison with its control. The WI-2291 showed a greater N yield in the EC3 treatment (8dS/m) in comparison with EC1, EC2 and EC4
treatments. Moreover, the highest TN in the whole plant was observed in WI-2291 genotype at 8dS/m salinity level where the percent increment was 51% over its control (Fig.2). In EC5 treatment, whole plant nitrogen increased by 24% over the control in the Pk-30-136 genotype; whereas, no significant increases were observed for the other genotypes.
Nitrogen uptake from soil and fertilizer
Data presented in Table 3 shows that nitrogen uptake from soil (Ndfs) and fertilizer (Ndff) were affected by the genotype and salinity levels. The highest Ndfs in the whole plant was observed in WI-2291 genotype at 8dS/m salinity level where the percent increment was 68% over its control. An increase in salinity (1-12dS/m) resulted in a decrease in Ndff in A. Abiad and Pk-30-136 genotypes. However Ndff in WI-2291 genotype increased as salt level increased to 8 dS/m and decreased with increases salinity to 12 dS/m. The highest salinity level reduced Ndff of all genotypes by 19, 22 and 23% for A. Abiad, PK-30-136 and WI-2291, respectively.
Nitrogen fertilizer use efficiency (%NUE) was calculated as fertilizer N recovery in the whole plant using the 15N isotopic data. An increase in salinity resulted in a decrease in %NUE values of A. Abiad and Pk-30-136 genotypes. In contrast, NUE in WI-2291 genotype increased as salt level increased to 8 dS/m (61% over the control) and decreased with increasing salinity to 12 dS/m (Table 3).
Stomatal conductance
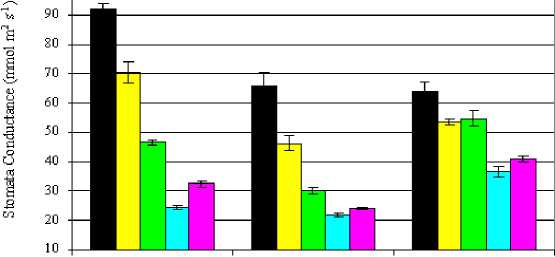
Significant differences in stomatal conductance (gs) were observed in leaves of the genotypes grown under non-stress conditions (control). A. Abiad showed a higher leaf stomatal conductance comparing with Pk-30-136 and WI-2291 genotypes. An increase in salinity resulted in a decrease in stomatal conductance in leaves of all the genotypes (Fig.3). In comparison with the control, the reduction in stomatal conductance of plants grown under salinity was less pronounced in the WI-2291 genotype than those of A. Abiad and Pk-30-136 as compared with their controls. Irrigation of A. Abiad, Pk-30-136 and WI-2291 genotypes with mild saline water showed a decline in stomatal conductance values by 24, 29 and 16% in EC2 and by 50, 54 and 14% in EC3 as compared to their controls. At the highest salinity treatment (EC4), stomatal conductance values of the above mentioned genotypes were 74, 66 and 43% lower than those of the control. Correspondingly, the average stomatal conductance values of the three barley genotypes measured in the high salinity treatment was 62% lower that measured in the control.
Variations in 13C natural abundance
Data presented in Table 4 shows that carbon isotope data, expressed as carbon discrimination (‰∆13C), were different in the various plant parts and were affected by the genotype and salinity levels. Generally, Δ 13C values in leaves were higher than those in roots or spike; whereas, they were somewhat parallel to those of the whole plants. Carbon isotope discrimination values (‰∆13C) ranged from 16.21‰ to 20.33‰ in shoots, from 16.15‰ to 19.25‰ in roots, and from 14.56‰ to 17.27‰ in spikes. Whole plant ‰∆13C ranged from 15.93‰ to 18.85.4‰ (Fig.4). Negative correlations were observed between ∆13C and salinity. An increase in salinity (1-12dS/m) resulted in a decrease in Δ 13C discrimination in different plant parts of the three barley genotypes. The lowest ∆13C values were often obtained in the highest salinity treatment (EC4). The difference in ∆13C between each two salinity levels was approximately 1‰.
Moreover, A. Abiad grown under different salinity treatments generally showed higher ∆13C values than the other genotypes. On the other hand, ∆13C values of the whole plants in the EC5 treatments were approximately similar to those in EC2.
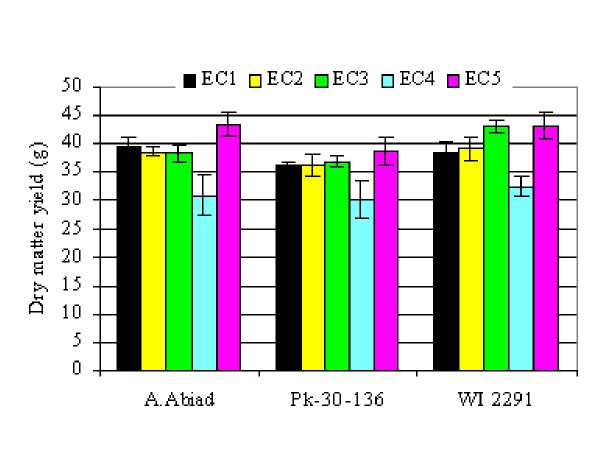
Figure 1: Total dry matter yields (g/pot) of three barley genotypes as affected by increasing levels of salinity in the irrigation water.
A.Abiad Pk-30-136 WI 2291
Figure 2: Total nitrogen yields (mg N/pot) of three barley genotypes as affected by increasing levels of salinity in the irrigation water.
■ ЕС1 пЕС2 пЕСЗ пЕС4 *ЕС5
100 -,
A.Abiad Рк-30-136 WI 2291
Figure 3: Stomata conductance (mmol m2s-1) in leaves of three barley genotypes as affected by increasing levels of salinity in the irrigation water.
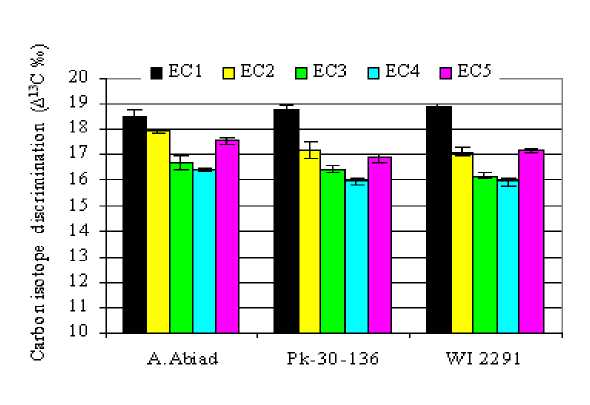
Figure 4: Carbon isotope discrimination (Δ13C ‰) in the whole plant (leaves, spikes and roots) of three barley genotypes as affected by increasing levels of salinity in the irrigation water.
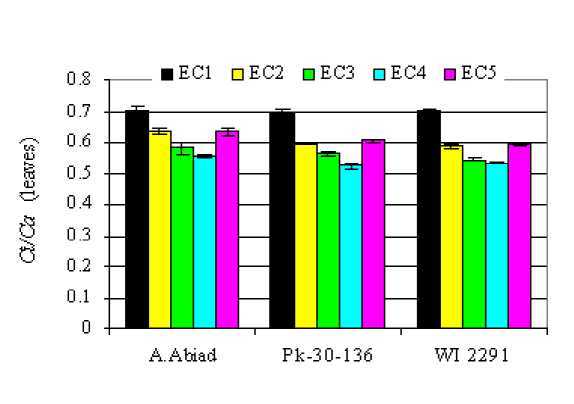
Figure 5: Intercellular CO 2 partial pressure to ambient CO 2 partial pressure (C i /C a ) in leaves of three barley cultivars as affected by increasing levels of salinity in the irrigation water.
Table 1: Dry matter yields (g/pot) in different plant parts of three barley cultivars as affected by increasing levels of salinity in the irrigation water
|
Cultivars |
Salinity levels dS/m |
|||||
|
ECI |
EC2 |
EC3 |
EC4 |
EC5 |
LSD о 05 |
|
|
Leaves |
||||||
|
Arabi Abiad |
16.58B.b |
16.40C.b |
15. IOC .be |
13.63B.C |
18.60B.a |
7.5' |
|
Pk-30-136 |
20.93А.З |
18.93B.b |
19.68Bb |
14.30B.C |
18.25Bb |
7.'6 |
|
WI- 2291 |
21.40A.b |
22.93A,a |
24.18Aa |
17.63A.C |
22.85A,ab |
1.49 |
|
LSD o.o5 |
1.51 |
1.77 |
7.67 |
1.98 |
1.64 |
|
|
Roots |
||||||
|
Arabi Abiad |
7.88B.b |
7.35B.b |
8.00A.a |
4.98A.C |
6.65A.b |
1.47 |
|
Pk-30-136 |
9.58A.3 |
9.08A.3 |
6.23B.bc |
5.90A.C |
7.40A.b |
1.45 |
|
WI- 2291 |
7.40B.a |
6.SOB,a |
7.80A.3 |
5.53A,b |
6.70A.ab |
1.19 |
|
LSD 0 05 |
1.40 |
1.33 |
1.24 |
N.S |
ALS |
|
|
Spi |
ces |
|||||
|
Arabi Abiad |
14.88A.b |
14.70A.b |
15.18A.b |
12.33A.C |
18.03A.a |
2.00 |
|
Pk-30-136 |
5.58C.d |
7.95B,c |
10.80B.b |
9.85B.b |
12.93В.З |
1.22 |
|
WI- 2291 |
9.65B.b |
9.70B,b |
ll.OSB.b |
9.30B,b |
13.38В.З |
1.89 |
|
LSD o.o5 |
1.70 |
2.04 |
1.18 |
2.72 |
2.09 |
|
Means within a column (capital letter) and within a row (small letter) followed by the same letter are not significantly different (P < 0.05).
Table 2: Nitrogen yields (mg N/pot) in different plant parts of three barley cultivars as affected by increasing levels of salinity in the irrigation water
|
Cultivars |
Salinity levels dS/m |
|||||
|
ECI |
EC2 |
EC3 |
EC4 |
EC5 |
LSD о оз |
|
|
Leaves |
||||||
|
Arabi Abiad |
143.13B.a |
149.53C,a |
139.31C,a |
154.52B,a |
144.42C,a |
N.S |
|
Pk-30-136 |
253.07A,a |
198.11B.b |
192.59B.b |
187.83A.b |
193.85B.b |
24.77 |
|
WI- 2291 |
228.73A.bc |
242.3 lA.b |
353.52А.З |
175.66AB.d |
214.28A.C |
21.34 |
|
LSD o o5 |
27.76 |
19.40 |
77.66 |
28.89 |
18.70 |
|
|
Roots |
||||||
|
Arabi Abiad |
96.42A.a |
85.04A.ab |
81.86A.ab |
72.63A.b |
71.30B.b |
19.28 |
|
Pk-30-136 |
101.09A.a |
82.07AB.ab |
89.64A.ab |
80.13A.b |
97.43A.ab |
19.37 |
|
WI- 2291 |
73.16B.b |
69.61B.b |
92.56A.3 |
63.55A.b |
67.10B.b |
13.37 |
|
LSD o.os |
18.32 |
13.97 |
N.S |
N.S |
27.7 |
|
|
Spikes |
||||||
|
Arabi Abiad |
249.35A.b |
235.16A.b |
235.74A.b |
252.90A.ab |
287.49A.a |
3760 |
|
Pk-30-136 |
93.86C.d |
159.24B.C |
216.36A.b |
200.09B.b |
263.68A.a |
28." |
|
WI- 2291 |
145.37B.C |
158.18B.C |
231.10A.a |
158.67B.C |
189.69B.b |
29.43 |
|
LSD o.os |
36.22 |
33.74 |
N.S |
42.66 |
31.96 |
|
Means within a column (capital letter) and within a row (small letter) followed by the same letter are not significantly different (P < 0.05)
Table 3: Amounts of nitrogen derived from soil (Ndfs) and from fertilizer (Ndff), (mg N/pot) and % nitrogen fertilizer use efficiency (NUE) in the whole plant of three barley cultivars as affected by increasing levels of salinity in the irrigation water
|
Cultivars |
Salinity levels dS/nr |
|||||
|
ECI |
EC2 |
EC3 |
EC4 |
EC5 |
LSD 0.05 |
|
|
Ndfs |
||||||
|
Arabi Abiad |
297.94A.a |
306.66A.a |
299.10C.a |
325.10AB,a |
321.57B.a |
N.S |
|
Pk-30-136 |
273.62B.C |
278.79B.C |
338.26B.ab |
331.83A.b |
371.40A,a |
36.86 |
|
WI- 2291 |
282.25AB.bc |
300.14AB.b |
474.64A,a |
270.06B.C |
291.46B.bc |
25.90 |
|
LSD о 05 |
23.46 |
22.62 |
30.83 |
56.64 |
37.30 |
|
|
Ndff |
||||||
|
Arabi Abiad |
190.97A.a |
163.08A.b |
157.81B.C |
154.95A.c |
181.65A,ab |
21.65 |
|
Pk-30-136 |
174.41 AB.ab |
160.63A.b |
160.3 IB.b |
136.22AB.C |
183.56A,a |
17.65 |
|
WI- 2291 |
165.01B.C |
169.96A.bc |
202.54A.a |
127.81B.d |
179.60A.b |
14.44 |
|
LSD o.o5 |
18.29 |
N.S |
11.28 |
26.21 |
AIS |
|
|
%NUE |
||||||
|
Arabi Abiad |
57.69A,a |
49.27A.bc |
47.68B.C |
46.8 lA.c |
54.88A.b |
6.54 |
|
Pk-30-136 |
52.69AB.ab |
48.53A.b |
48.43B,b |
41.16AB.C |
55.46A.a |
5.38 |
|
WI- 2291 |
49.85B,c |
51.35A.bc |
61.19A.a |
38.6 IB.d |
54.26A.b |
4.36 |
|
LSD co |
5.53 |
N.S |
3.41 |
7.92 |
ACS' |
|
Means within a column (capital letter) and within a row (small letter) followed by the same letter are not significantly different (P < 0.05)
Table 4: Carbon isotope discrimination (Δ13C‰) in different plant parts of three barley cultivars as affected by increasing levels of salinity in the irrigation water
|
Cultivars |
Salinity levels dS/ni |
|||||
|
ECI |
EC2 |
EC3 |
EC4 |
EC 5 |
LSD о 05 |
|
|
Leaves |
||||||
|
Arabi Abiad |
20.33A.a |
18.78A.b |
17.53 A.c |
16.96A.d |
18.76 A.b |
0.40 |
|
Pk-30-136 |
20.14A.a |
17.90B.b |
17.13AB.C |
16.21B.d |
18.03B.b |
0.35 |
|
WI- 2291 |
20.29A.a |
L7.65B,b |
16.71B.C |
16.46B.d |
17.78C.b |
0.24 |
|
LSD о Q5 |
ALS |
0.49 |
0.46 |
0.25 |
0.19 |
|
|
Roots |
||||||
|
Arabi Abiad |
17.82A.b |
17.17A.C |
16.36A.d |
19.25A.a |
17.67A.b |
0.20 |
|
Pk-30-136 |
16.70B,b |
15.87C.d |
16.15A.cd |
18.04B.a |
16.43B.bc |
0.30 |
|
WI- 2291 |
16.39C.C |
16.47B.bc |
16.33 A.c |
16.66C.b |
17.41A.a |
0.21 |
|
LSD o.o5 |
0.23 |
0.18 |
Л;5 |
0.23 |
0.38 |
|
|
Spikes |
||||||
|
Arabi Abiad |
16.81A.b |
17.27A.a |
16.08A.d |
14.91A.e |
16.36A.C |
0.29 |
|
Pk-30-136 |
16.27B.a |
16.41B.a |
15.32B.b |
14.56B.C |
15.45C.b |
0.34 |
|
WI- 2291 |
16.91A.a |
16.12B,b |
15.03C.C |
14.73AB.d |
15.98B.b |
0.21 |
|
LSD o o5 |
0.19 |
0.43 |
0.29 |
0.20 |
0.34 |
|
Means within a column (capital letter) and within a row (small letter) followed by the same letter are not significantly different (P < 0.05)
DISCUSSION
depending on plant genotype and plant organ
The effect of salinity on dry matter production seems to vary from negative to positive effects
(Table 2 and Fig.1). However, an increase in salinity (1-12dS/m) resulted in a decrease in Δ13C discrimination in the different plant part of three barley genotype. Such a decrease indicates that imposition of salt stress leads to less discrimination against the heavier isotope. Low Δ13C values under salinity have been reported for wheat (Ansari et al., 1998, Shaheen and Hood-Nowotny, 2005a, Arslan et al., 1999), Barley (Isla et al., 1998), rice (Shaheen and Hood-Nowotny, 2005 b) and Kentuky bluegrass (Qian et al., 2004).
During photosynthesis, C3 plants discriminate against the heavy isotope of carbon (13C) leading to less 13C in plant dry matter. Carbon isotope discrimination positively correlates with C i /C a , i.e. the ratio of internal leaf CO 2 concentration to ambient CO 2 concentration (Farquhar et al., 1982). Higher Δ13C is caused by a higher C i /C a ratio mainly due to a large stomata conductance, which leads to higher photosynthetic rate and hence higher yield, i.e. positive relationship between Д 13 С and yield but if stomatal conductance remains constant and photosynthetic capacity varies, the increasing photosynthetic capacity should lower C i /C a and Δ13C but elevate assimilation rate per unit leaf area. This condition will lead to negative relationship between Δ13C and yield (Condon et al., 1987).
In C3 plants, several researchers have examined the association between Д 13 С and yield. Reported correlations vary from positive (Condon et al., 1987; Kirda et al., 1992) to negative (Condon et al., 2002; Arslan et al., 1999). This contrast could be explained by differences related to growth stage sampling and environmental conditions under which the plants have been grown (Monneveux et al., 2005). The relationship between Д 13 С and yield in barley, and hence its utility as an indicator of yield, has often been found to be positive (Febrero et al., 1994; Romagosa and Araus, 1991), indicating that higher yield is associated with low WUE. In this study, relationships between Δ13C and dry matter yield
154 seemed to be depending on plant genotype and plant organ (data not shown). In A. Abiad genotype, relationship between Д 13 С and dry matter yield was positive in leaves and spikes and negative in roots. On the other hand, only leaves of the Pk-30-136 genotype showed positive relationship between between Д 13 С and dry matter yield. However, no such relations were found in WI-2291. For the whole plant, weak positive correlations were found in A. Abiad and Pk-30-136.
The higher spike yields (Table 1) observed in A. Abiad as compared with the other two genotypes was associated with a high Δ13C (Table 4) and a high carbon yield (data not shown). This observation may indicate that A. Abiad could be a drought tolerant genotype. In this context, Craufurd et al (1991) reported that earlier barley cultivars may have fixed a large proportion of their grain carbon early in the season and therefore giving a high C i /C a and Δ13C. These authors suggested that cultivars with high Δ13C and high grain yield (earlier cultivars) have an advantage under terminal water stress relative to those having low Δ13C (later cultivars). On the other hand, significant differences in stomatal conductance were observed in leaves of the genotypes grown under non-stress conditions (control). A. Abiad showed a higher leaf stomatal conductance (i.e favoring stomatal opening) and greater spike yield comparing with Pk-30-136 and WI-2291 genotypes implying that a maximization of yield may occurs via a maximization of stomatal opening (Isla et al., 1998).
Using the equation of Farquhar et al. (1982), we calculated the average C i /C a in the leaves of the studied genotypes among different salinity treatment (Fig.5). The reduction in Д 13 С as salinity increased from 1 to 12 dS/m corresponded to a decrease in C i /C a from 0.7 (control) to 0.56, 0.53
and 0.52 in A. Abiad, WI-2291 and Pk-30-136, respectively. A lower C i /C a ratio could result either from stomatal closure induced by salt stress or from higher rates of photosynthetic capacity or a combination of both (Condon et al., 2002). However, considering the lower leaf dry matter yield in the EC4 treatment, it was unlikely that a higher photosynthetic capacity occurred at this salinity treatment. Thus, the decrease in C i /C a ratio because of salinity (12 dS/m) was mainly due to the stomatal closure, i. e. decline in stomatal conductance. The average stomatal conductance values of the three barley genotypes measured in the high salinity treatment was 62% lower that measured in the control. Similar results were obtained with barley by Isla et al. (1998) and Shen et al. (1994). Moreover, since the reduction in dry matter yield in all the genotypes grown at 12 dS/m salinity level did not exceed 50% in comparison with the control, the photosynthetic apparatus of all studied genotypes seemed to be quit tolerant to salinity. Thus, the observed decline in C i /C a ratio could mainly be attributed to the decreases in stomatal conductance.
At moderate salinity levels, particularly at 8dS/m, the enhancement of leaf dry matter yield in the WI-2291 genotype reflects a higher photosynthetic capacity. Consequently, the lower Ci/Ca ratio in this genotype could result mainly from higher rates of photosynthetic capacity rather than stomatal closure. Likewise, the rate of stomatal conductance reduction because of salinity was less pronounced in WI2291 comparing to other genotypes (Fig.3). The average stomatal conductance value of this barley genotype measured at 8dS/m salinity level was only 13% lower that measured in the control. Whereas, the corresponding value observed in A. Abiad and Pk-30-136 was about 50%.
Carbon isotope discrimination (Δ13C) in C3 plants has been shown to be negatively correlated with water use efficiency (WUE). Low Δ13C has been proposed as an indicator of high WUE (Farquhar and Richards, 1984). In this study, irrigation of WI-2291 genotype with saline water having EC w of 8dS/m showed a decline in Δ13C (high WUE) with a corresponding increase in dry matter yield. Shaheen and Hood-Nowotny (2005b) reported that the increase in dry mater yield and WUE in salt stressed wheat might have been due to positive nutritional effects of the salt. Yeo (1983) reported that a factor that may increase WUE as a result of salinity is that stomatal conductance may decline without a corresponding fall in assimilation capacity. In this study, WI-2291 genotype grown at mild salinity level (8dS/m) showed such benefits as indicated by a significant increase in the amount of total nitrogen uptake, i.e. from soil and fertilizer (Table 3).
Generally, Δ13C values in leaves were higher than those in roots or spikes; whereas, they were somewhat parallel to those of the whole plants. This indicates differences in chemical composition among plant parts along with different patterns of carbon allocation between leaves and seeds (Hubick et al., 1986; Knight et al., 1995). Similarly, Shaheen and Hood-Nowotny (2005 a,b) reported higher Δ13C in leaves of wheat and rice plants. Numerous studies have reported different ∆13C values depending on the tissues used for analysis (Knight et al., 1995). Declining contents of non-structural carbohydrates which have a less negative δ13C than the remaining biomass (Brugnoli et al., 1988) or raising levels of lipids with a more negative δ13C
(Robinson et al., 1983) may account for higher ∆13C (Shaheen and Hood-Nowotny, 2005b).
Carbon isotope discrimination is suggested to be a potential tool to identify genotypes for high water uses efficiency (WUE) and high nitrogen fertilizer use efficiency (%NUE) in salt affected soil (Arslan et al., 1999). In the present study, an increase in salinity (1-12dS/m) resulted in a decrease in %NUE as well as in Δ13C values of A. Abiad and Pk-30-136 genotypes. In contrast, an increase in salinity (1-8dS/m) resulted in an increase in NUE in the WI-2291 genotype. However, irrigation of this genotype with saline water having EC w of 12 dS/m (EC4 treatment) drastically decreased NUE (Table 3). The highest NUE (61%) observed in WI-2291 at 8dS/m was associated with the lowest Δ13C (16.19‰).
Arslan et al. (1999) reported a high negative correlation between Δ13C and NUE of wheat genotypes grown in salt affected soil. In this study, however, NUE was positively correlated with Δ13C in A. Abiad (r2=0.76) and Pk-30-136 (r2= 0.76) genotypes with no correlation being obtained in WI-2291. But, if EC4 data of the WI-2291 genotype were excluded, a negative correlation (r2= -0.70) could be obtained between NUE and Δ13C. Therefore, it can be concluded that, associations between Δ13C and NUE seemed to be depending on plant genotype and salinity level.
Isla et al. (1998) reported that carbon isotope discrimination is a useful indicator for yield potential in barley grown under non-saline conditions; whereas, grain yield remains only reliable means for identifying salt tolerance in barley. Overall, the present study revealed that, from a productivity standpoint, A. Abiad surpassed the other genotypes in maintaining higher spike yields under different treatments (1-8dS/m). The
Pk-30-136, which is known as a salt tolerant genotype (Charbaji et al., 2003) showed greater spike yield in saline treatments comparing with its control. The WI-2291 showed a relatively constant spike yield under different salinity levels. However, based on growth, nutritional parameters and 13C discrimination, selection of barley genotypes for saline environments was affected by salinity level under which the plants have been grown. Under non-saline conditions, the performance of A. Abiad was higher than the other genotypes owing to its lower Δ13C, greater DM, NY, spike yield and NUE. At low (4ds/m) and high salinity (12ds/m) levels, this genotype also showed greater spike yield and NUE with a more Д 13 С. However, under mild salt stress (8dS/m) WI-2291 seemed to be more salt tolerant than A. Abiad and Pk-30-136 evidenced as it exhibits by a smaller Δ13C (i.e. higher WUE) with higher leaf gs, DM, N-uptake from soil and from fertilizer and greater NUE. In conclusion, the results of this study emphasize the importance of selecting barley genotypes for saline environments using growth, nutritional and 13C discrimination criterions in a particular salinity level under which the plants have been grown.
ACKNOWLEDGMENTS
We would like to thank Professor I. Othman, General Director of the Atomic Energy Commission of Syria (AECS) for his support. The technical assistance of the staff at the AECS Department of Agriculture is greatly acknowledged.
References Growth, nitrogen uptake and carbon isotope discrimination in barley genotypes grown under saline conditions
- Ansari, R., Naqvi, M.S., Khanzada, N.A. and Hubick, K.T. (1998) Carbon isotope discrimination in wheat cultivars under saline conditions. Pak. J. Bot., 30, 87-93.
- Arslan, A., Zapata F. and Kumarasinghe, K.S. (1999) Carbon isotope discrimination as indicator of water use efficiency of spring wheat as affected by salinity and gypsum addition. Communication in soil sci. & Plant Anal., 30, 2681-2693.
- Bellaloui, N. (2011) Effect of water stress and foliar boron application on seed protein, oil, fatty acids, and nitrogen metabolism in soybean. American journal of plant science, 2, 692-701.
- Brugnoli, E., Hubick, K.T., Von Caemmerer, S. and Farquhar, G.D. (1988) Correlation between carbon isotope discrimination and leaf starch and sugars of C3 plants and the ratio of intercellular and atmospheric partial pressures of carbon dioxide, Plant Physiol., 88, 1418-1424.
- Charbaji, T., Khalifa, K. and Al-Ain, F. (2003) The effect of gamma irradiation of seeds on germination, growth, mineral content and yield of two barley varieties grown under saline conditions. Agrochimica XLVII, 5-6, 180-187.
- Condon, A.G., Richards, R.A. and Farquhar, G.D. (1987) Carbon isotope discrimination is positively correlated with grain yield and dry matter production in field grown wheat. Crop Science, 27, 996-1001.
- Condon, A.G., Richards, R.A., Rebetzke, G.J. and Farquhar, G.D. (2002) Improving intrinsic water-use efficiency and crop yield. Crop Science, 42, 122-131.
- Cramer, G.R., Epstein, E. and Läuchli, A. (1990) Effects of sodium potassium and calcium on salt-stressed barley. I. Growth analysis. Physiol. Plant., 80, 83-88.
- Craufurd, P.Q., Austin, R.G., Acevedo, E. and Hall, M.A. (1991) Carbon isotope discrimination and grain yield in baeley. Field Crop Research, 27, 301-313
- Ellis, R.P., Forster, B.P., Gordon, D.C., Handley, L.L., Keith, R.P., Lawrence, P., Meyer, R., Powell, W., Robinson, D., Scrimgeour, C.M., Young, G. and Thomas, W.T.B. (2002) Phenotype/genotype associations for yield and salt tolerance in a barley mapping population segregating for two dwarfing genes. J. Exp. Bot., 53, 1163-1176.
- Farquhar, G.D. and Richards, R.A. (1984) Isotope composition of plant carbon correlates with water use efficiency of wheat genotypes. Aust. J. Plant Physiol., 11, 539-552.
- Farquhar, G.D., Ehleringer, J.R. and Hubick, K.T. (1989) Carbon isotope discrimination and photosynthesis, Annu. Rev. Plant Physiol. Mol. Biol., 40, 503-537.
- Farquhar, G.D., O'Leary, M.H. and Berry, J.A. (1982) On the relationship between carbon isotope discrimination and intercellular carbon dioxide concentration in leaves. Aust. J. Plant Physiol., 9, 121-137.
- Febrero, A., Bort, J., Catala, J., Marzabal, P., Voltas, J. and Araus, J. L. (1994) Grain yield, carbon isotope discrimination and mineral content in mature kernels of barley under irrigated and raifed conditios. Agronomie, 14(2), 127-132.
- Forster, B.P, Russell, J.R., Ellis, R.P., Handley, L.L., Robinson, D., Hackett, C.A., Nevo, E., Waugh, R., Gordon, D.C., Keith, R. and Powell, W., (1997) Locating genotypes and genes for abiotic stress tolerance in barley: a strategy using maps, markers and the wild species. New Phytol, 137, 141-147.
- Hubick, K.T., Farquhar, G.D. and Shorter, R. (1986) Correlation between water use efficiency and carbon isotope discrimination in diverse peanut (Arachis) germplasm, Aust. J. Plant Physiol., 13, 803-816.
- Hussein, F., Janat, M. and Yakoub, A. (2011) Assessment of yield and water use effi ciency of drip-irrigated cotton (Gossypium hirsutum L.) as affected by deficit irrigation. Turk J Agric For., TUBİTAK, 35, 1-11
- Impa, S.M., Nadaradjan, S., Boominathan, P., Shashidhar, G., Bindumadhava, H. and Sheshshayee, M.S. (2005) Carbon isotope discrimination accurately reflects variability in WUE measured at a whole plant level in rice. Crop Sci., 45, 2517-2522.
- Isla, R., Aragüés, R. and Royo, A. (1998) Validity of various physiological traits as screening criteria for salt tolerance in barley. Field Crops Research, 58(2), 97-107.
- Kirda, C., Mohamed, A.R.A.G., Kumarasinghe, K.S., Montenegro, A. and Zapata, F. (1992) Carbon isotope discrimination at vegetative stage as an indicator of yield and water use efficiency of spring wheat (Triticum turgidum L. var. durum). Plant and Soil, 147, 217-223.
- Knight, J.D., Thies, J.E. Singleton, P.W. and Van Kessel, C. (1995) Carbon isotope composition on N2-fixing and N-fertilized legumes along elevational gradient. Plant and Soil, 177, 101-109.
- Maas, E.V. and Hoffman, G. J., (1977): Crop salt tolerance. Current Assessment J. Irrig. Div., ASCS, 103(IR2), 115-134.
- Mano, Y. and Takeda, K, (1997) Mapping quantitative trait loci for salt tolerance at germination and the seedling stage in barley (Hordeum vulgare L.). Euphytica, 94, 263-272.
- Marschner, H., (1995). Mineral nutrient of higher plants. Academic press, London.
- Monneveux, P., Reynold, M.P., Trethowan, R., Gonzalez-Santoyo, H., Pena, R. J. and Zapata, F., (2005): Relation between grain yield and carbon isotope discrimination in bred wheat under four water regimes. Europ. J. Agronomy, 22, 231-242.
- Munns, R. and Rawson, H.M. (1999) Effect of salinity on salt accumulation and reproductive development in the apical meristem of wheat and barley. Aust. J. Plant Physiol., 25, 459-464.
- Qian, Y.L., Follett, R.F., Wilhelm, S., Koski, A.J. and Shahba, M.A. (2004). Carbon isotope discrimination of three Kentucky bluegrass cultivars with contrasting salinity tolerance. Agron. J., 96, 571-575.
- Qureshi, R.H. and Barrett-Lennard, E.G. (1998) Saline agriculture for irrigated land in pakistan: a handbook. Australian Center for International Agricultural Research, Canberra, Australia, pp.142
- Rebetzke, G.J., Condon, A.G., Richards, R.A. and Farquhar, G.D., (2002). Selection for reduced carbon isotope discrimination increases aerial biomass and grain yield of rainfed bread wheat. Crop Sci., 42, 739-745.
- Robinson, S.P., Downton, W.I.S. and Milhouse, J.A. (1983) Photosynthesis and ion content of leaves and isolated chloroplast stressed spinach. Plant phsiol., 73, 238-242.
- Romagosa, I., and Araus, J.L. (1991) Genotype-environment interaction for grain yield and 13C discrimination in barley. Barley Genetics, VI, 563-567.
- Shaheen, R., and Hood-Nowotny, R.C. (2005a) Effect of drought and salinity on carbon isotope discrimination in wheat cultivars. Plant Science, 168, 901-909.
- Shaheen, R., and Hood-Nowotny, R.C. (2005b) Carbon isotope discrimination: potential for screening salinity tolerance in rice at the seedling stage using hydroponics. Plant Breeding, 124, 220-224.
- Shen, Z., Shen, Q., Liang, Y. and Liu, Y. (1994) Effect of nitrogen on the growth and photosynthetic activity of salt stressed barley. J. Plant Nutr., 17, 787-799.
- Tambussi, E.A., Bort, J. and Araus, J.L. (2007) Water use efficiency in C3 cereals under Mediterranean conditions: a review of physiological aspects. Ann. Appl. Biol., 150, 307-321.
- Teulat, B., Merah, O. and This, D. (2001) Carbon isotope discrimination and productivity in field-grown barley genotypes. J. Agron. Crop Sci., 187, 33-39.
- Yeo, A.R., (1983) Salinity resistance physiologies and prices. Physiol. Pantarum, 85, 214-222.
- Zhao, G.Q., Ma, B.L. and Ren, C.Z. (2007) Growth, gas exchange, chlorophyll fluorescence, and ion content of naked oat in response to salinity. Crop Sci., 47, 123-131.
