Heart disease detection using predictive optimization techniques

Author: N. Satyanandam, Ch. Satyanarayana
Journal: International Journal of Image, Graphics and Signal Processing @ijigsp
Article in issue: 9 vol.11, 2019.
Free access
Health care is a major research domain needed instantaneous solutions. Due to the digitalization of data in each and every domain it is becoming tedious to store and analysis. So, the demand of proficient algorithms for health care data analysis is also increasing. Predictive analytics is the major demand from the health care community to the computing researches in order to predict and reduce the potential health catastrophes. Parallel research attempts are made to predict the possibilities of the disease on the different health care domains at various regions. However, those attempts are limited and not remarkable to achieve the desired outcomes. Recently, in the field of data analytics; Machine Learning techniques became popular in generating optimized solutions with effective data processing capabilities. Henceforth, this research work considers the heart disease analysis using machine learning techniques to determine the disease severity levels. Experiments are made on UCI heart disease dataset and our results shows 92% accuracy the heart severity detection.
Heart Disease Analysis, Prediction, Optimised Solutions, Machine Learning Techniques, Severity Detection
Short address: https://sciup.org/15016079
IDR: 15016079 | DOI: 10.5815/ijigsp.2019.09.02
Text of the scientific article Heart disease detection using predictive optimization techniques
Published Online September 2019 in MECS
-
I. Introduction
Heart problems or heart diseases are thought about to be the non-communicable as the signs are rarely or otherwise noticeable externally. Kannan R. et. Al. stated that “Indian Heart Association (IHA) released a report i.e. per every minute four people in between the 30-50 age groups are dying of heart diseases” [1]. It is anticipated by WHO in the report produced in the Global Summit 2005 [2] that the amount of deaths as a result of cardiovascular disease or comparable non-communicable conditions will certainly be 76% of the overall death triggers. One more surprising discovery as well as claims created at Global Burden of Disease Summit at 2010 [3] as by 23 million people will be impacted by cardiac relevant illness. Henceforth stopping as well as
forecasting the health illness is considered to be the highest priority need for the study. A variety of research efforts are made towards clinical information mining, specifically for cardiovascular disease mining, for much better evaluation and also for the prediction of disease severity.
Yanwei Xing et al., have actually demonstrated and by their study that, the most prominent data mining approaches towards the healthcare details as well as knowledge prediction [4]. Taking a look at the relevance of the data processing for analysis and prediction, research study attempts from different sectors is clearly visible. Because of the commercial practicality of those applications or approaches for clinical information analysis, the two most significant industries IBM [5] as well as Microsoft [6] have demonstrated some considerable outcomes in this space of research.
Data mining techniques mostly depend upon statistical methods to solve practical scenarios. The work by Glymour C. et al [7] demonstrated the early works of statistical inferences on data mining problems. Hence, this is natural to understand that, the resent results produced by the research attempts are combination of knowledge from all the dimensions of algorithm and mathematical science. Nevertheless, the recent enhancements have proven that apart from the statistical methods, machine learning and database technologies are also important to extract some hidden parameters or hidden features or the hidden relations between the parameters.
This novel direction made this research study is to concentrate more on the machine learning approaches for mining information and knowledge. Thuraisingham et al., have created all possible basic processes and also provided to understand the extents for improvements [13]. Nonetheless, the demand for higher accuracy as well as lower time complexity is still the need from the healthcare domains specifically.
Considering all major and notable outcomes from various research attempts, this work projects the following facts:
-
• Detailed analysis of the existing mining methods for predicting the heart disease data is to be compared.
-
• Considering the better outcomes from the neural network based algorithms, the possibilities of improvements to be identified.
-
• Further, in terms of enhancing the results towards higher accuracy, the optimization methods using machine learning approaches are considered in order to propose the novel methodology.
-
• Finally, the complexity of the model is to be compared with the existing methods in order to establish a better model.
The rest of the paper is arranged such that in Section – II, the reviews of the parallel researches are presented, Section – III elaborates about the generic neural network approach for mining medical data, in Section – IV the proposed multi-nominal regression model is elaborated based on the machine learning approaches, in Section – V the experimental results are presented and the outcomes are compared with existing traditional approaches in terms of time complexity, norm factor and accuracy. Section – IX presents the conclusion of this paper.
-
II. Related Works
The predictive evaluation of the medical data is not unusual and also variety of data mining methods can be deployed to achieve enhanced amount of accuracy. In this research article, various data mining techniques for existing disease detection and prediction are analysed based on the readily available end results from parallel research study attempts.
Srinivas and Shantha Kumar et. al. stated that, data-mining plays a vital role, in expert-intelligent therapeutic systems [9,10]. Actual problems of the illnesses and its associated disorders, the symptoms of diseases that are impulsively seen in patients can be evaluated by the built-in software easily. The input data is provided by using extendibility interface of the software from huge database collections. The associated symptoms, those haven’t been weighed effectively will be explored and the anonymous symptoms laid among the big-therapeutic databases will be examined from this investigation by considering frequent items using nominee-generation. The side effects of illnesses will be evaluated and reduced by an automatic approach.
Generally, heart attack prediction systems will use major data mining approaches and artificial neural network methods to predict the severity of heart problems. Any framework which is used for heart diseases prediction; need to be pre-processed and clustered by means of any clustering algorithm [12]. Satyanandam et. Al. proposed a “New Multilayer Perceptron Model” for heart disease severity detection. This multi-layered perception uses the back propagation for optimal supervised learning [18].
This paper proposed an “Optimal Multi-Nominal Logistic Regression (OMLR) algorithm and the same is used for training the heart disease data set. The experimental outcomes recognize that proposed OMLR algorithm is outperforming in detecting the severity. The predictive analysis of heart disease detection substantially considers only 15 attributes, using simple data mining techniques like clustering techniques, association rules and soft computing mechanisms etc.
-
III. Neural Network based Approach for Data Mining
One of the most specified tasks of data mining is classification of the data. The procedure of classification to recognize existing patterns in the datasets as well as define in which category the thing or the item collection belongs too. In case of classification, groups are predefined based on existing inferred rules. On the other side, yet an additional popular method is referred to as clustering. The benefit of making use of clustering is that, the classifications or the teams can be figured out during the execution process as well as based on any kind of brand-new guidelines determined, new clusters can be created.
Nevertheless, the widely accepted process in data mining is forecasting or the prediction. Based on the sample data available, any predictive model can be created and further the same model can be deployed to predict any item or item set. The use of neural network can implement some mining operations such as associativity analysis, classifications, clustering analysis and prediction or forecasting. The wide possibilities of applications using neural networks were first presented by Fausett et al. [14]. The recent enhancements as demonstrated in the notable work by Liu X et al., show the benefits and drawbacks of the neural network predictive model for clinical data prediction [15]. The work by Yashpal Singh et al. [16] is a good review on the previously mentioned work. Satyanandam et. Al. [19], discussed the performance improvements by neural network approaches and they used multi-layer perceptron models on different datasets.
In this section of the work, the existing neural network model for medical data prediction is explained. Existing neural network approach is explained in two ways.
-
A. Theoretical Clarification.
-
B. Empirical Explanation
-
C. Theoretical Clarification
Step -1. Provide a small segment of the dataset to the neural network as training or model building information.
Step -2. Build the model
Step -3. Generate and accept the output from the existing model
Step -4. Compare results of proposed model with actual results from the provided dataset
Step -5. If the output matches, goto Step – 1
Step -6. If the output does not match with the expected output, then calculate the difference between the expected output from the dataset and output obtained from the model
Step -7. Once the difference is calculated for each neuron, then calculate the scaling factor
Step -8. Adjust weight of neuron to minimise the difference
Step -9. Repeat Step – 6 to Step – 8
Step -10. Finalise the model
-
D. Empirical Explanation
Random initialization of the Weights
Repeat for each example ‘e’ in the training set do
// Forward pass O=neural_net_output(network,e) pass to forward layer
//Targeted output
T= Expected output for ‘e’
//Compute error rate
Estimate error rate = (T-O)/Input units
//Backward pass
-
• Compute delta_wi for all weights from hidden layer to Output layer
-
• Compute delta_wi for all weights from input layer to hidden layer
Update the weights
End.
The experimental outcome shows that the performance of Decision Tree based classification and Bayesian classifications are having similar accuracy but both the approaches will take larger times for classification. The other side, the neural network based approaches were generated with an ideology that their processing times are low compared to the traditional approaches. Even though, these neural network approaches shown improved accuracy as compared to the traditional methods but the initial time taken to build the model is too high and it results in poor time complexity.
-
IV. Machine Learning Approaches for Predicting Heart Disease Severity
Selection of appropriate classification strategies are an important part of machine learning as well as data mining applications. About 70% of problems in Data Science are related to classification. There are great deals of category problems that are available. However, the logistics regression prevails as well as is a valuable regression technique for solving the binary classification problem. One more group of category is Multinomial classification, which handles few issues where multiple classes exist in the target variable.
Logistic Regression is among the most basic and frequently used Machine Learning formulas for two-class category. It is easy to execute as well as can be used as the baseline for any kind of binary classification problems. Standard and fundamental concepts are additionally helpful in deep learning. Logistic regression estimates the connection as well as describes in between one dependent binary variable and other independent variables.
Logistic regression is a statistical method for forecasting binary classes. The end result or target variable is dichotomous in nature. Dichotomous means, there are only two possible courses. For example, it can be utilized for disease discovery. It calculates the likelihood of an occurrence of disease.
It is a special case of linear regression where the target variable is categorical in nature. It makes use of a log of probabilities as the reliant variable. Logistic Regression forecasts the probability of incident of a binary function making use of a logit function
Linear Regression Equation:
Z = a0 + alxl + a2x2 + — + an. xn, -^ < x < ^
Where, ‘Z’ is dependent variable and {x1, x2 ... and Xn} are explanatory variables.
Apply sigmoid function on linear regression:
* = 1/1+, -, (2)
Logistic regression classifies the data based on an assumption that, the expected target variables from the analysis are categorical.
So, it classifies the target variables into different claases as mentioned below.
Binomial: The expected target variable can be chosen by either “0” or “1” , “pass” vs “fail” and “dead” vs “alive”, etc.
Multinomial : The expected target variables can be chosen among multiple possible types which are need not to be ordered (i.e. disease types have no quantifiable importance)
Example: “disease A” vs “disease B” vs “disease C”.
Ordinal : Here the targeted variables can be chosen between ordered categories.
Example: Any analysis can be categorized as: “very poor”, “poor”, “good”, “very good”. The scores will be like 0, 1, 2, 3 etc.
Algorithm:Optimal Multinominal Logistic Regression
-
# load the heart disease dataset
d = datasets.load_disease()
-
# Dataset feature matrix (D) and severity response
vector (T)
-
# Classifying D and T into training and testing sets model_selection import train_test_split
-
# random sampling for selection of training and test sets
D_train, D_test, T_train, T_test = train_test_split
(D, T, test_size=0.4, random_state=1)
-
# Logistic regression object creation reg = linear_model.LogisticRegression()
-
# train the model using the training sets reg.fit(D_train, T_train)
-
# making predictions on the testing set
T_pred = reg.predict(D_test)
-
# comparing actual response values (T_test) with predicted response values (T_pred)
Calculate ("Logistic Regression model accuracy
(in %):", metrics.accuracy_score(T_test, T_pred)*100)
The complete dataset taken for examination is from the UCI machine learning repository for heart disease detection and prediction is based different datasets available demographically.
The main theme of the above model to predict heart disease probability from the given dataset after the training is completed. The dataset parameters used are furnished below [Table – 1].
Table 1. Input Parameter Analysis
|
Parameter Name |
Minimum |
Maximum |
Mean |
Deviation |
|
age |
29 |
77 |
54.4 |
9.05 |
|
sex |
0 |
1 |
0.677 |
0.468 |
|
cp |
1 |
4 |
3.16 |
0.955 |
|
trestbps |
94 |
200 |
132 |
17.8 |
|
chol |
126 |
564 |
249 |
51.2 |
|
fbs |
0 |
1 |
0.149 |
0.357 |
|
restecg |
0 |
2 |
1.01 |
0.998 |
|
thalach |
71 |
202 |
150 |
22.9 |
|
exang |
0 |
1 |
0.326 |
0.47 |
|
slope |
1 |
3 |
1.59 |
0.61 |
The result parameter as described is considered as ‘num’, which is the nominal parameter and holds the value as 0 or 1 denoting no disease or positive disease respectively.
-
V. Results and Discussions
Henceforth, with the proposed model for predictive analysis of heart disease detection, this work performs the experiments on the highly popular UCI heart disease datasets and compares with the existing models.
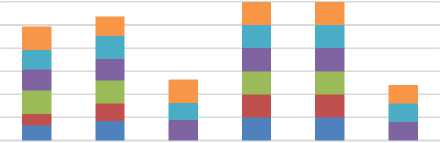
The input selection is measured with precision, recall and F-measure for training and test data sets using different classifiers.
The statistical values obtained by different classifiers are shown in Table-2. Hence, it is observed that the logistic regression model is stable as compared to the traditional models.
Table 2. Comparison of model evaluation metrics
|
Model |
Training |
Testing |
||||
|
F-Mea sure |
Preci sion |
Reca ll |
F-Mea sure |
Preci sion |
Reca ll |
|
|
Decision Stump |
0.66 |
0.5 |
1.0 |
0.92 |
0.85 |
1.0 |
|
KStar |
0.85 |
0.75 |
1.0 |
0.92 |
1.0 |
0.85 |
|
ZeroR |
0 |
0 |
0 |
0.88 |
0.75 |
1.0 |
|
Decision Table |
1.0 |
1.0 |
1.0 |
1.0 |
1.0 |
1.0 |
|
Multilayer Perceptron |
1.0 |
1.0 |
1.0 |
1.0 |
1.0 |
1.0 |
|
Logisitic Regression |
0 |
0 |
0 |
0.8 |
0.8 |
0.8 |
Model Evaluation
-
■ Training ■ Training ■ Training
-
■ Testing ■ Testing ■ Testing
Fig.1. Model Evaluation Metrics Comparison
From the earlier observations of parallel researches, it is clearly visible that the results can be optimised by introducing the machine learning or deep learning approaches.
Any predictive model can be utilized for analysis and predictions. Nevertheless, the accuracy and the complexity of the models are to be identified for evaluation of efficiency. Also the parameter “Norm” is yet another efficient method for verifying model efficiency. Thus, in this part of the work both are considered.
With this predictive optimization, the time complexity is reduced to a greater extent combined with the desired higher accuracy compared with the existing methods.
-
A. Time Complexity Analysis
The time complexity analysis is the fundamental part of the efficiency and effectiveness measure. The proposed model is compared [Table – 3] with the other popular methods for classification and prediction [16].
Table 3. Time Complexity Analysis
|
Method Name |
Time to Build the Model (Sec) |
|
DecisionStump |
0.23 |
|
KStar |
0.28 |
|
ZeroR |
0.32 |
|
DecisionTable |
0.51 |
|
MultilayerPerceptron |
0.45 |
|
Logistic Regression |
0.12 |
Thus it is natural to understand that, the proposed logistic regression model is significantly less time complexity for analysis.
It can be visualised graphically as shown in Fig.2.
Time to Build the Model (Sec)
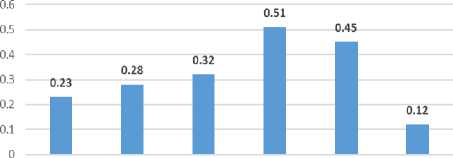
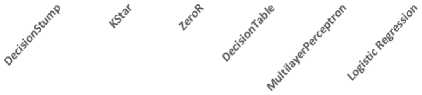
Fig.2. Time Complexity Analysis
-
B. Norm Analysis
Secondly, the novel parameter “Norm” computes the model efficiency of the predictive model. If its final value is small, the model will be smooth. On the other hand, if it is very big, the model will be less efficient and might become unstable. Also note that, norm depends on the number of parameters. The norm of the neural parameters is written below [Table – 4].
Table 4. Norm Analysis
|
Method Name |
Parameters Norm |
|
DecisionStump |
9.23 |
|
KStar |
7.65 |
|
ZeroR |
9.33 |
|
DecisionTable |
6.78 |
|
MultilayerPerceptron |
5.94 |
|
Logistic Regression |
4.82 |
Thus it is natural to understand that, the proposed model is significantly smooth for analysis.
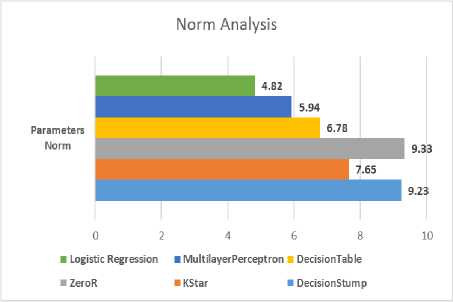
Fig.3. Norm Analysis
-
C. Accuracy Measure
Accuracy is the most important factor to be evaluated by any model. If the accuracy of proposed model is more; then the outcomes from the built model are qualitied and expected.
The accuracy of the existing and the proposed method has been compared here [Table – 5]:
Table 5. Accuracy Measure
|
Model |
Accuracy (%) |
|
DecisionStump |
36.5 |
|
KStar |
51.2 |
|
ZeroR |
39 |
|
DecisionTable |
45.5 |
|
MultilayerPerceptron |
68.2 |
|
Logistic Regression |
93.2 |
The result is also analysed visually [Fig – 4].
Accuracy (%)
Logistic Regression ^^^^^^^^^^^^^^^Z
MultilayerPerceptron
~ DecisionTable ^^^^^Z^^^^^Z^ 43
о
5 ZeroR ^^^=^^^^
KStar ^^^=^^^^^^
DecisionStump ^^^^^^^^^^^
0 20 40 60 80 100
|
DecisionStu |
KStar |
ZeroR |
DecisionTa ble |
Multilayer? erceptron |
Logistic Regression |
|
|
■ Accuracy (%) |
36.5 |
51.2 |
39 |
45.5 |
68.2 |
93.2 |
Accuracy
-
D. Parameter Correlation Matrix Analysis
The absolute correlation values among all inputs to be computed to improve the performance. The correlation is a numerical value between 0 and 1 that articulates the strength of the relationship between two variables. When it is close to 1 it indicates a strong relationship, and a value close to 0 indicates that there is no relationship [Table – 6].
Fig.4. Accuracy Comparisons
Table 6. Correlation Analysis
|
Para meters |
age |
sex |
cp |
tres tb ps |
ch ol |
fbs |
rest ecg |
thal ach |
exa ng |
|
age |
1 |
0.09 81 |
0.0 774 |
0.2 74 |
0.2 18 |
0.1 14 |
0.1 34 |
0.3 93 |
0.0 974 |
|
sex |
1 |
0.0 263 |
0.0 584 |
0.1 91 |
0.0 544 |
0.0 328 |
0.0 58 |
0.1 89 |
|
|
cp |
1 |
0.0 709 |
0.09 89 |
0.0 782 |
0.0 61 |
0.3 19 |
0.3 14 |
||
|
Tres tbps |
1 |
0.1 57 |
0.0 704 |
0.1 29 |
0.0 297 |
0.0 938 |
|||
|
chol |
1 |
0.0 314 |
0.1 66 |
0.0 184 |
0.0 933 |
||||
|
fbs |
1 |
0.0 533 |
0.0 014 |
0.0 276 |
|||||
|
restecg |
1 |
0.0 821 |
0.0 911 |
||||||
|
thalach |
1 |
0.3 77 |
|||||||
|
exang |
1 |
This result demonstrates the absolute input correlations between all inputs. This work identifies the minimal correlation as 0.000545561 between the variables chol and slope. The maximal correlation is 0.393266 between the variables age and thalach. Henceforth, with the detail analysis of the algorithms and the experimental results, this work explains the final conclusion in the next section.
-
VI. Conclusion
Motivated by the demand for health care data analysis, this work undertakes the challenge of producing yet another highly accurate method for detection of heart disease using minimal parameters. This work compares the existing classification, clustering and prediction models and identifies the scope for improvements in this domain. As compared to the other methods, this research acknowledged that the improvements on accuracy can be achieved by using machine learning approaches. Other side, neural network models performing better in handling disease predictions. But, due to the complex activation methods in neural networks lead to higher time complexity. Thus, this work propose another novel predictive optimization technique in order to maintain efficiency during accuracy and time complexity trade off. The proposed OMLR algorithm exhibits 93.2% accuracy with lesser time complexity than the other models.
In future, this research focuses to apply the proposed algorithm on various datasets to detect different diseases like brain tumour, genetical issues and diabetes prediction.
Acknowledgment
We would like to show our gratitude to all the authors and publishes for sharing their pearls of wisdom with us during the course of this research.
References Heart disease detection using predictive optimization techniques
- Kannan R., Vasanthi V., “Machine Learning Algorithms with ROC Curve for Predicting and Diagnosing the Heart Disease”. In: Soft Computing and Medical Bioinformatics (2019). Springer Briefs in Applied Sciences and Technology. Springer, Singapore.
- Preventing Chronic Disease: A Vital Investment. World Health Organization Global Report, 2005
- Global Burden of Disease. 2004 update (2008). World Health Organization.
- Yanwei Xing, “Combination Data Mining Methods with New Medical Data to Predicting Outcome of Coronary Heart Disease”, IEEE Transactions on Convergence Information Technology, pp(868 – 872), 21-23 Nov. 2007
- IBM, Data mining techniques, http://www.ibm.com/devel operworks/opensource/library/ba-data-miningtechniques/index.html?ca=drs-,downloaded on 04 April 2013.
- Microsoft Developer Network (MSDN). http://msdn2.microsoft.com/enus/virtuallabs/aa740409.aspx, 2007.
- Glymour C., D. Madigan, D. Pregidon and P.Smyth, “Statistical inference and data mining”, Communication of the ACM, pp: 35-41, 2006.
- C. Aflori, M. Craus, “Grid implementation of the Apriori algorithm Advances in Engineering Software”, Volume 38, Issue 5, May 2007, pp. 295-300
- Srinivas, K., “Analysis of coronary heart disease and prediction of heart attack in coal mining regions using data mining techniques”, IEEE Transaction on Computer Science and Education (ICCSE), p(1344 - 1349), 2010.
- Shanta kumar, B.Patil,Y.S.Kumaraswamy, “Predictive data mining for medical diagnosis of heart disease prediction” IJCSE Vol .17, 2011
- M. Anbarasi et. al. “Enhanced Prediction of Heart Disease with Feature Subset Selection using Genetic Algorithm”, International Journal of Engineering Science and Technology Vol. 2(10), 5370-5376 ,2010
- Hnin Wint Khaing, “Data Mining based Fragmentation and Prediction of Medical Data”, IEEE, 2011.
- Thuraisingham, B.: “A Primer for Understanding and Applying Data Mining”, IT Professional, 28-31, 2000.
- Fausett, Laurene (1994), Fundamentals of Neural Networks: Architectures, Algorithms and Applications, Prentice-Hall, New Jersey, USA.
- Liu X, Lu R, Ma J, Chen L. Privacy-preserving patient-centric clinical decision support system on naïve bayesian classification. IEEE Journal of Biomedical and Health Informatics. 2016; 20(2):655–88
- Dr. Yashpal Singh, Alok Singh Chauhan, Neural Networks In Data Mining, Journal Of Theoretical And Applied Information Technology, 2016
- Vikas Chaurasia, Saurabh Pal, Early Prediction of Heart Diseases Using Data Mining Techniques, Published under Caribbean Journal of Science and Technology, 2013.
- N Satyanandam, Dr. Ch Satyanarayana, A New Multilayer Perceptron Model to Detect Heart Disease Severity, International Journal of Scientific & Engineering Research, Volume 7, Issue 12, December-2016 ISSN 2229-5518.
- N Satyanandam, Dr. Ch Satyanarayana, Detection of Heart Disease Severity using A Novel Multilayer Perceptron Model: Validation through Major Datasets, Advances in Fuzzy Mathematics. ISSN 0973-533X Volume 12, Number 3 (2017), pp. 333-345 © Research India Publications.
