Heart Disease Prediction Using Frequent Item Set Mining and Classification Technique

Author: Sinkon Nayak, Mahendra Kumar Gourisaria, Manjusha Pandey, Siddharth Swarup Rautaray
Journal: International Journal of Information Engineering and Electronic Business @ijieeb
Article in issue: 6 vol.11, 2019.
Free access
The heart is the most important part of the human body. Any abnormality in heart results heart related illness in which it obstructs blood vessels which causes heart attack, chest pain or stroke. Care and improvement of the health by the help of identification, prevention, and care of any kind of diseases is the main goal. So for this various prediction analysis methods are used which job is to identify the illness at prelim phase so that prevention and care of heart disease is done. This paper emphasizes on the care of heart diseases at a primitive phase so that it will lead to a successful cure. In this paper, diverse data mining classification method like Decision tree classification, Naive Bayes classification, Support Vector Machine classification, and k-NN classification are used for determination and safeguard of the diseases.
Heart Disease, Frequent Itemset, Classification, Performance Measurement Parameter
Short address: https://sciup.org/15017068
IDR: 15017068 | DOI: 10.5815/ijieeb.2019.06.02
Text of the scientific article Heart Disease Prediction Using Frequent Item Set Mining and Classification Technique
Published Online November 2019 in MECS DOI: 10.5815/ijieeb.2019.06.02
Mining is the way used to find the unexplored data from a immense abstraction of data which is not easy to analyze[9]. HealthCare is the field, a large abstraction of data. Maintenance and improvement of the unwellness by diagnosing, hindrance, and care of diseases. Problem is to stipulate healthier care at an inexpensive monetary value. Cardiovascular illness mean the difficulty take place in heart, circulatory system, and blood vessels[3]. Heart sickness relates to anxiety and deformity in the heart itself. It specifically implies the condition of the heart that hinder blood vessels which results misfunction of heart. Care and improvement of the unwellness by the help of identification, hindrance, and care of any kind of illness. Diverse methods are used for the early anticipation of any deformity related to welfare so that one can get prilim aware which leads to prevent or take care of health. Various predictive methods are used for early anticipation and among them mining classification are the one used for this. Diverse classification methods such as Decision tree, Naive Bayes, Support Vector Machine, and k-NN are used to spot and prevent the diseases at an primitive period of time. For the prediction of the heart related illness it uses 14 attributes having 303 instances. Various performance measurement parameters are used like accuracy, sensitivity, specificity, positively predicted value, negatively predicted value and the area under curve.
This paper is organized into section as follows. Section II encapsulates heart disease. Section III provide a brief description of literature survey of heart related disease. The work flow steps are discussed in section IV. Section V is all about the preprocessing of data and VI describes the attribute filtration. Section VII concise discussion of the classification techniques such as Naive Bayes, Decision tree, SVM, k-NN. Dataset collection attributes elucidation, comparison study is discussed in section VIII. Section VII is all of the result analysis. Section IX is the conclusion, summarizes a brief overview of the content.
-
II. Literature Study
The heart-related sickness is the capital inception of death for everyone these days. Cardiovascular disease refers to the trouble occur with heart. Life is completely leaning on the effective functioning of heart. There are various factors on the basis of which risk become
Table 1. Risk Factor for Heart Disease
From the various study, the death rate is 272 people per 100 000 people in India and globally 235 per 100 000 people. In every year 610,000 population deceased due to heart-related unwellness in the United States. In the year 2009 due to heart-related illness more than half of the deaths were in men.
Aditya Sundar et al employee data mining classification techniques for the heart disease and interrogate how accurately it predict the illness by Naive Bayes and WAC[1].
Sellappan Palaniappan et al gives a clear idea about several classification method Naive Bayes, Decision tree and Neural network for the anticipation of heart related illness [2].
J Thomas et al discuss the classification methods k-NN classification, Naive Bayes Classification, Decision tree classifier and Neural network to anticipate the risk level of a diligent to have a heart-related sickness or not. They conclude that the accuracy of anticipation become greater with the expand in the amount of attributes[4].
Swathy Wilson et al did a scrutiny of diverse mining methods and ended with decision tree with k means clustering returns better quality[5].
A Nishara Banu et al discussed Association Rule Mining, Classification, and Clustering for detection of heart-related unwellness. They showed their planned spotting knowledge can efficiently identify the heart attack[6].
Shabana Asmi P et al attached attributes in the dataset for discovery the heart-related sickness which results increase in accuracy and they used association rules for this[7].
-
III. Proposed Method For Prediction
For negotiate the medical data these days diverse information systems incidental to healthcare are being used because of the immense collection. The primary grail is to design a system which is used for early anticipation of heart related sickness. Figure 1 employee the methodology for the prediction of heart unwellness. The dataset from UCI/Kaggle in CSV format then preprocess the data has been done which includes data transformation, data cleaning, and data integration. After preprocessing data mining classification algorithms such as Decision Tree, SVM, Naive Bayes, k-NN are applied for the prediction with and without filtering the attributes and compare their accomplishment.
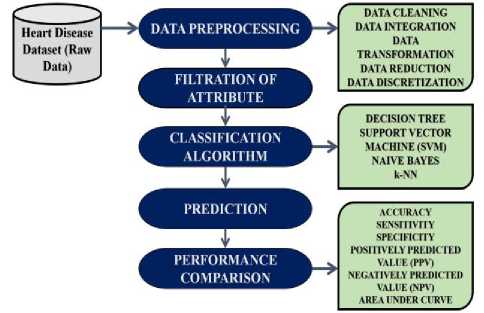
Fig.1. Work Flow for Prediction of Heart Disease
-
IV. Data Preprocessing
Figure 2 represents the flow diagram for the preprocessing of data.
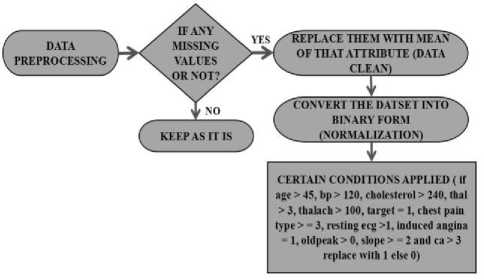
Fig.2. Data Preprocessing
Heart dataset consists of missing values, so at first remove the missing values by replacing them with the mean of that particular attribute. After that we normalize the data by converting the datasets in the binary format I.e 0 and 1 on the basis of various conditions such as :- if age > 45, bp > 120, cholesterol > 240, thal > 3, thalach > 100, target = 1, chest pain type > = 3, resting ecg >1, induced angina = 1, oldpeak > 0, slope > = 2 and ca > 3 then replace them with “1” else replace them with “0”. “1” refers to greater chances of presence of heart illness and “0” refers to the absent of heart illness in the patients [13].
-
V. Attribute Filtration
Figure 3 represents the flow diagram for filtering the attributes in the basis of frequent item set.
While handling large dataset for the identification of heart disease it is a complex task to get the applicable content to predict heart attack at an primal phase on the basis of the indicant observed in patients. So it is essential for the Knowledge Discovery in Data[14]. Mining of knowledge or data mining is used for the prediction of various diseases. There are numerous symptoms observed in a patient for a particular disease which defines the clinical condition of them. For filtering the attribute of heart data algorithm 1 is used in which frequent item set is calculated.
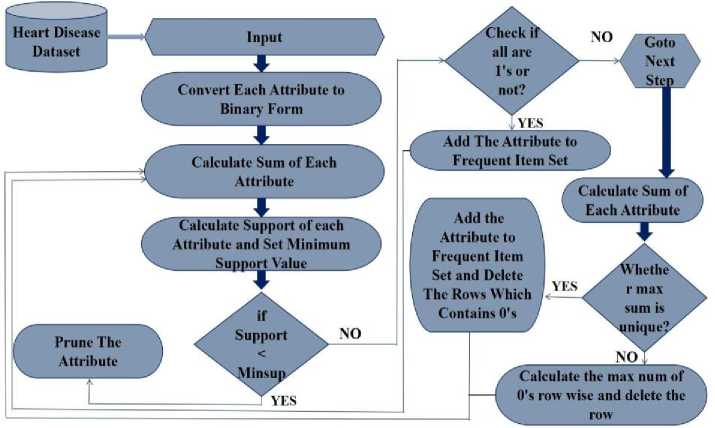
Fig.3. Attribute Filtration by Frequent Itemset
-
A. Algrothim1: Algorithm for attribute filtration
Input: Heart dataset which is in binary form based on the mentioned conditions in data preprocessing.
Output: Most important attribute in the frequent itemsets f k .
Step-1: Import the Heart Dataset.
Step-2: Convert each attribute into binarized form on the basis of given condition.
Step-3: Find the sum and support of each attribute and set a minimum support value which is defined by user.
Step-4: Prune the attribute which does not satisfy minimum support.
Step-5: Check if any attribute contains all 1’s then add the attribute to frequent itemset and delete that attribute else goto next step.
Step-6: Calculate the sum of each attribute if the maximum sum is unique then add the attribute to frequent itemset and delete the attribute along with the rows which contains 0’s in the whole dataset.
Step-7: Calculate the maximum number of 0's row wise and delete the row.
Step-8: Repeat step 3 to 7 until the dataset is void.
Step-9: Output f k , most important attributes.
Output : frequent attribute f k = A14, A10, A8, A4, A2, A1.
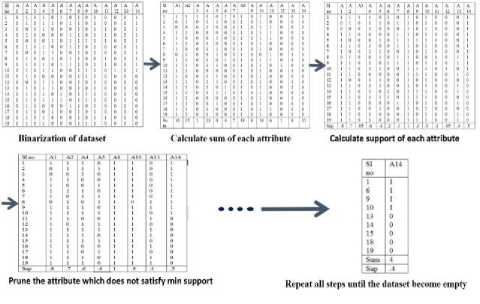
Fig.4. Attribute Filtration
-
VI. Classification Methods
In data mining classification used for predicting a class for each constituent and assigns them to a allocate them to target class. The main cognitive content of classification is to prognosticate the class for each one data accurately[11]. In this paper four classification methods are taken into consideration. This section of the paper gives a detailed idea about the classifiers and their pros and cons. Depending on the pros and cons which signify their characteristics the classifier gives the result. The result also depends upon the dataset in which it is going to apply.
-
A. Decision Tree
Basically a tree composition in which branch nodes signify attribute, terminal nodes signify class labels and branches signify the termination or end points. Testing benchmark are appertain on the source node and branch nodes and conditional on upon testing benchmark the data will precede the branch till it reaches the leaf node or class label[10,17].
Table 2. Pros and Cons of Decision Tree Classification Techniques
|
Pros |
Cons |
|
Robust, simple and easy to implement. |
Class conditional independence. |
|
Not sensitive for irrelevant features. |
Dependencies is not taken into discussion. |
-
B. Naive Bayes
Bayesian classification is a probabilistic method to solve the classification problem, based on Bayes theorem. It classify the data correctly with small training dataset[10, 12,18].
Table 3. Pros and Cons of Naive Bayes Classification Techniques
|
Pros |
Cons |
|
Robust. |
Overfitting. |
|
Easy to interpret. |
Prediction of continuous variable is not suitable. |
|
Need less computation. |
Perform poorly with many class and small data. |
-
C. SVM
Support Vector Machine can be described by a hyperplane which separates the data into two parts which lay in either side. It can be used for classification as well as regression. It basically applied on the data which are noisy and tangled in quality[10,19].
Table 4. Pros and Cons of SVM Classification Techniques
|
Pros |
Cons |
|
Training of dataset is easy. |
Need good kernel function. |
|
Scale well for high dimensional data. |
Sensitive to noisy data. |
-
D. k-NN
k-NN classifier is the most instance-based method for classifying data. k-NN stores all available records and classifies them on the basis of similarity measures[20].
Table 5. Pros and Cons of k-NN Classification Techniques
|
Pros |
Cons |
|
Applied to data of any distribution. |
Depends on K value. |
|
Very simple and intuitive. |
Affected by irrelevant attributes. |
|
Work good for large sample. |
Need huge number of sample for accuracy calculation. |
|
Modeling is not expensive. |
Classifying unknown data is very expensive. |
-
VII. Data Set Elucidation
The dataset is gathered from UCI machine learning repository which is consists of 75 attributes but all of them are not relevant for anticipation or for analysis so a subset of the dataset is taken into consideration i.e consists of 14 attributes and 303 patients record[8]. Here all the attributes in the dataset are described what they refers to and for the prediction of heart illness we need to examine the peculiarities of illness which observed in a particular patient. Depending on the peculiarities of illness one can able to identify what kind of illness it is. So Figure 5 represents the dataset attribute description.
|
Attribute Number |
Attribute Name |
Attribute Elucidation |
|
1 |
Age |
Age of the patients |
|
2 |
Sex |
Sex of the patients |
|
3 |
Cp |
Chest pain type |
|
4 |
Resting Blood Pressure |
Resting blood pressure level of the patients |
|
5 |
Cholesterol |
Cholesterol of patients |
|
6 |
Fasting Blood Sugar |
Blood sugar level of patients in fasting |
|
7 |
Resting ECG |
ECG result |
|
8 |
Thalach |
Maximum heart rate of the patients |
|
9 |
Induced Angina |
If the patients experience angina as a result of exercise |
|
10 |
Old Peak |
ST depression induced by exercise relative to rest |
|
11 |
Slope |
Slope of the peak exercise ST segment |
|
12 |
CA |
Number of major vessels colour by Flouroscopy |
|
13 |
Thal |
Normal.fixed or reversible defect |
|
14 |
Target |
Status of the disease |
Fig.5. Detail Description of Dataset
-
VIII. Performance Examination
For the computation of Accuracy, Sensitivity, Specificity, Area under curve and ROC curve uses confusion matrix exhibits in table 6.
Table 7 gives the comparison of data mining classification algorithms on the basis of various performance parameter without attribute filtration.
Sensitivity : P(+|1) : Percentage of Truly Positive: TP/(TP+FN) (1) which correctly predicts to have illness.
Specificity : P(-|0) : Percentage of Truly
Negative:TN/(TN+FP) (2) which correctly predicts not have illness.
Accuracy : (TP+TN)/(TP+TN+FP+FN) (3) denotes how healthy the test anticipate both collection.
Positive Predicted Value (PPV) : P(1|+) : Probability a person who (+) have heart disease.
Negative Predicted Value (NPV) : P(0|-) : Probability a person who (-) does not have heart disease.
Confusion matrix is a matrix which defines the accomplishment of supervised learning methods and here it is used for classification technique’s effecting. In the Table 6 the row indicate the actual value and the column signify the predicted value. If the actual value signify the presence of illness in a particular patient and the classifier signify the same then the result is TP and if the actual value indicate the absence of illness and the prediction does not match it gives the result FN. If the actual value signify the absence of illness in a particular patient and the classifier signify the same then the result is TN and if the actual value indicate the absence of illness and the prediction does not match it gives the result FP.
Table 6. Confusion Matrix for Heart Disease
|
Class Label |
Present of Heart Disease |
Heart Disease Not Present |
|
Heart Disease Present |
TP |
FN |
|
Heart Disease not Present |
FP |
TN |
Table 7. Comparison of Various Classifier without Attribute Filtration
|
Classifi er |
Acc (%) |
Sensiti vity (%) |
Specifi city (%) |
PPV (%) |
NPV (%) |
AU C |
|
Decisio n Tree |
84.91 |
36.95 |
61.81 |
44.73 |
53.9 6 |
.827 5 |
|
SVM |
88.68 |
39.86 |
58.20 |
44.36 |
53.6 4 |
.884 8 |
|
Naive Bayes |
96.23 |
39.13 |
57.57 |
43.54 |
53.0 7 |
.989 9 |
|
k-NN |
58.49 |
50 |
48.49 |
44.80 |
54.7 |
.628 3 |
ROC curve indicate the graphical representation of measuring the performance of classification methods which is plotted between sensitivity which is the true positive value and specificity which is the false positive value[16].
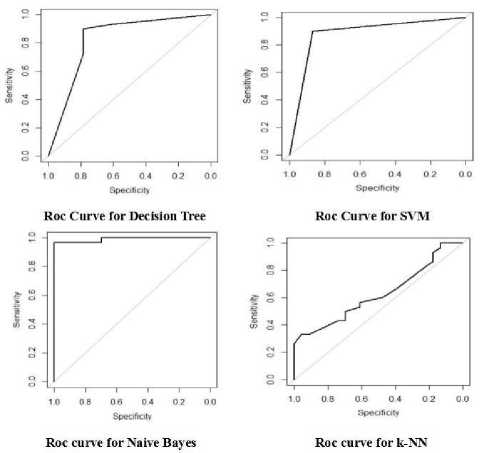
Fig.6. ROC Curve of Various Classifier without Attribute Filtration
Figure 6 gives the Roc curve of different classifier and area under curve. Figure 7 gives the performance of different classifier with respect to accuracy, sensitivity and specificity.
Performance Graph without Atrribute Filtration
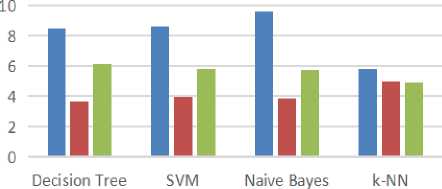
■ Accuracy ■ Sensitivity ■ Specificity
Fig.7. Performance Graph of Various Classifier without Attribute Filtration
Table 8. Comparison of Various Classifier with Attribute Filtration
|
Classifi er |
Acc (%) |
Sensiti vity (%) |
Specifi city (%) |
PPV (%) |
NPV (%) |
AUC (%) |
|
Decisio n Tree |
69.81 |
41.30 |
56.96 |
44.53 |
53.71 |
.6928 |
|
SVM |
81.13 |
41.30 |
56.96 |
44.53 |
53.71 |
.8080 |
|
Naive Bayes |
88.67 |
36.95 |
61.21 |
44.34 |
53.72 |
.9754 |
|
k-NN |
71.70 |
44.20 |
55.75 |
45.52 |
54.43 |
.7609 |
Table 8 gives the comparison of data mining classification algorithms on the basis of various performance parameter with attribute filtration.
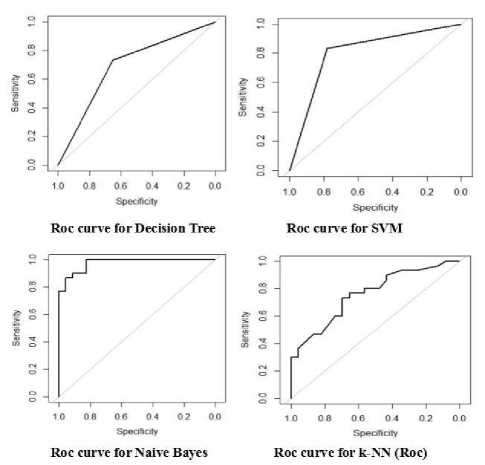
Fig.8. ROC Curve of Various Classifier with Attribute Filtration
Performannce Graph with Attribute Filtration
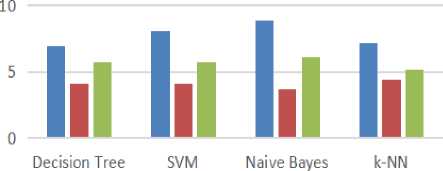
■ Accuracy ■ Sensitivity ■ Specificity
Fig.9. Performance Graph of Various Classifier with Attribute Filtration
Figure 8 represents the ROC curve of different classifier and area under curve with attribute filtration is maximum for Naive Bayes classifier as compare to others but when we consider the performance then the performance of k-NN increases but the performance of other classification methods are decreases. Figure 9 represents the performance of classification methods with respect to accuracy, sensitivity and specificity in a graphical way.
-
IX. Conclusion and Future Scope
This paper focuses on the early anticipation of heart related unwellness on the basis of various indicant observed in a particular patient so that one can got the appropriate care and treatment for recovery. These days to get better medical service so that every tolerant able to recover from unwellness independent of the illness. So the key challenge to provide better care and medical support at an diminish monetary value. For this various predictive analysis methods are used which leads to achieve the result which in needed. This paper scrivener the key detection and hindrance of heart related unhealthiness by diverse classification methods which are implemented using R analytical tool. This research paper describes the classification techniques used for the early anticipation. For the anticipation of heart related unhealthiness at the primaeval period of time the accuracy of Naive Bayes is dominant as compared to another. From findings, the accuracy of foresee heart unhealthiness dissent from each other and the accuracy of foresee also rely on the platform. The accuracy and area under curve is sovereign in case of Naive Bayes classifier by using R data analytical tool for predicting heart illness with or without attribute filtration but performance of k-NN increases but the performance of others decreases. And after this we will try ensemble technique to optimize the proposed model and also compare with the existing proposed one.
References Heart Disease Prediction Using Frequent Item Set Mining and Classification Technique
- Sundar, N. Aditya, P. Pushpa Latha, and M. Rama Chandra. "Performance analysis of classification data mining techniques over heart disease database." International journal of engineering science & advanced technology 2.3 (2012): 470-478.
- Palaniappan, Sellappan, and Rafiah Awang. "Intelligent heart disease prediction system using data mining techniques." 2008 IEEE/ACS international conference on computer systems and applications. IEEE, 2008.
- Dangare, Chaitrali S., and Sulabha S. Apte. "Improved study of heart disease prediction system using data mining classification techniques." International Journal of Computer Applications 47.10 (2012): 44-48.
- Thomas, J., and R. Theresa Princy. "Human heart disease prediction system using data mining techniques." 2016 International Conference on Circuit, Power and Computing Technologies (ICCPCT). IEEE, 2016.
- Wilson, Aswathy, et al. "Data Mining Techniques For Heart Disease Prediction." (2014).
- Banu, MA Nishara, and B. Gomathy. "Disease forecasting system using data mining methods." 2014 International conference on intelligent computing applications. IEEE, 2014.
- Waghulde, Nilakshi P., and Nilima P. Patil. "Genetic neural approach for heart disease prediction." International Journal of Advanced Computer Research 4.3 (2014): 778.
- Database: http://archive.ics.uci.edu/ml/ datasets/Heart+Disease
- Wu, Xindong, et al. "Data mining with big data." IEEE transactions on knowledge and data engineering 26.1 (2014): 97-107.
- Umadevi, S., and KS Jeen Marseline. "A survey on data mining classification algorithms." 2017 International Conference on Signal Processing and Communication (ICSPC). IEEE, 2017.
- Tomar, Divya, and Sonali Agarwal. "A survey on Data Mining approaches for Healthcare." International Journal of Bio-Science and Bio-Technology 5.5 (2013): 241-266.
- Krishnapuram, B., et al., A Bayesian approach to joint feature selection and classifier design.Pattern Analysis and Machine Intelligence, IEEE Transactions on, 2004. 6(9): p. 1105-1111
- “Heart disease” from http://wikipedia.org
- Frawley and Piatetsky-Shapiro, 1996. Knowledge Discovery in Databases:An Overview. The AAAI/MIT Press, Menlo Park, C.A.
- "Hospitalization for Heart Attack, Stroke, or Congestive Heart Failure among Persons with Diabetes", Special report: 2001 – 2003, New Mexico.
- “ROC curve” from https://en.wikipedia.org
- “Decision Tree” from https://en.wikipedia.org
- “Naive Bayes” from https://en.wikipedia.org
- “Support Vector Machine” from https://en.wikipedia.org
- “K Nearest Neighbour” from https://en.wikipedia.org
