Heavy metals pollution and its genotoxicity assessment through the green marine Ulva lactuca (Chlorophyceae) algae in the Lattakia-coastline, Syria
 algae in the Lattakia-coastline, Syria")
Author: Saleh Basel
Journal: Журнал стресс-физиологии и биохимии @jspb
Article in issue: 1 т.16, 2020.
Free access
The current study was conducted to investigate pollution level in Lattakia-coastline, Syria using Ulva lactuca (Chlorophyta) algae as bioindicator for sea water pollution based on Zn, Pb, Cu and Cd concentration using Atomic Absorption Spectrometry (AAS) technique. On the other hand, to investigate pollution genotoxicity on U. lactuca algae based on Genomic Template Stability (GTS%) estimations yielded by Touch-down Directed Amplification of Minisatellite DNA (Td-DAMD) marker. AAS analysis indicated that the Lattakia coastline is not polluted by the mentioned pollutants (Zn, Pb, Cu and Cd) at least regarding these metals. As for GTS%, it is not correlated with observed pollutants concentration in the mentioned sites. Further studies focused especially on determination of other elements than those studied herein and investigation their influence on DNA changes profile are needed.
Ulva lactuca algae, heavy metals pollution, atomic absorption spectrometry (aas) technique, genomic template stability (gts%)
Short address: https://sciup.org/143171151
IDR: 143171151
Text of the scientific article Heavy metals pollution and its genotoxicity assessment through the green marine Ulva lactuca (Chlorophyceae) algae in the Lattakia-coastline, Syria
Air, soil and water pollution became a serious problem worldwide due to daily increased human activities in terrestrial and aquatic ecosystems. According to US Environmental Protection Agency (EPA), cadmium (Cd), mercury (Hg) and lead (Pb) were considered as the most three contaminants of greatest threat to the environment (Jamers et al. , 2013). Pollution caused deleterious effects on water quality and biomass physiology, morphology and molecular approaches. Many analytical methods successfully employed for detecting heavy metals pollution in ecosystems; e.g. Inductively Coupled Plasma Mass Spectrometry (ICPMS) and Instrumental Neutron Activation Analysis (INAA) (Gaudry et al. , 2007; Chakraborty and Owens 2014); Energy-Dispersive X-Ray Fluorescence spectrometry (EDXRF) (Apaydın et al. , 2010); Flame Atomic Absorption Spectroscopy (FAAS) (Allam et al. , 2016); Atomic Absorption Spectrometry (AAS) (Annabi et al. , 2018; Jayasinghe et al. , 2018; Cadar et al. , 2018); Inductively Coupled Plasma Atomic Emission Spectroscopy (ICP-AES) (van Ginneken and de Vries 2018) and Inductively Coupled Plasma-Optical Emission Spectrometry (ICP–OES) (Chen et al. , 2018) techniques.
Seaweeds displayed a critical role in many applications; e.g. industry, cosmetics, food, animal feed, agriculture, horticulture and agronomy, environmental monitoring and bioremediation and thalassic and wellness (Apaydın et al. , 2010; Saleh 2018a).
Living organisms are proved to be an effective tool for environmental genotoxicity monitoring in ecosystems. In this regards, Aras et al. (2011) applied Pseudevernia furfuracea (L.) Zopf lichen to detect air pollution in Turkey. As for aquatic pollution: for example, Dourado et al. (2017) applied animal ( Astyanax altiparanae fish) and plant ( Allium cepa ) for water pollution monitoring in Brazil.
Among living organisms, algae were successfully employed worldwide for detecting heavy metals pollution in marine ecosystems. In this regards, in Hong Kong (Wong et al. 1982); Egypt (Mohamed and Khaled 2005); Atlantic Moroccan coast (Gaudry et al., 2007); Turkish marine coast (Topcuoğlu et al., 2010; Apaydın et al., 2010); Aegean sea (Akcali and Kucuksezgin 2011); Gulf of Kutch in India (Chakraborty et al., 2014); Australia (Chakraborty and Owens 2014); and Algeria (Laib and Leghouchi 2012; Allam et al., 2016). Recently in Tunisia (Annabi et al., 2018); China (Chen et al., 2018); Sri Lanka (Jayasinghe et al., 2018); Black Sea (Cadar et al., 2018) and oceans (van Ginneken and de Vries 2018).
Heavy metals pollution has deleterious effects on living organisms at morphological, physiological, biochemical and molecular levels. Molecular markers approach was widely and successfully employed for detecting DNA changes. Genomic template stability (GTS%) evaluation was considered as a qualitative measure reflecting DNA changes induced by abiotic and biotic stresses (Aras et al. 2011; Saleh 2016a, b;2018b).
Thereby, the current work aimed to monitoring the Lattakia-coastline, Syria pollution by determination of heavy metals (Zn, Pb, Cu and Cd) content in on hand; and to detecting DNA changes induced by the mentioned pollutants based on GTS% estimation resulting from Touch-down directed amplification of minisatellite DNA (Td-DAMD) marker application, on the other hand.
MATERIALS AND METHODS
Sampling procedure
Samples [sea water (SW) and algal thalli (A)] were collected from 8 sites located along the Lattakia-Syrian coast of the Mediterranean Sea (Table 1). Samples collection was carried out from 35°44ʹ459ʹʹE latitude to 35°43ʹ995ʹʹE at 4 km North Lattakia - Syria. The collection site S8 was considered as a control due its location so far from any contamination kind. Whereas, the site S5 was located at dischargeinfluence of river entering the Mediterranean Sea and exposed to our local pollutant emissions.
Only individual with the similar size was harvested manually with disposable gloves, biomass was washed with seawater where the algae were collected and then transported within a flask with (5 l) seawater to laboratory. Upon algae arrival to laboratory, they were washed twice with double distillate water (ddH2O). To facilitate their drying, they were drained and transported to Whatman filter paper. Samples were divided into two sets; the first one was kept in liquid nitrogen for DNA extraction serving for molecular study. Whereas, the second onewas shade dried for two weeks, then powdered by special electric mill and stored separately in polyethylene bags until analysis.
Moreover, seawater (250 ml) samples were also collected from the same locations where the natural habitant of algae. Due to the rocky nature location of sites, sediments involving sand samples did not included in the analysis.
Heavy metals measurement
Heavy metals (Zn, Pb, Cu and Cd) concentration in seawater (SW) and algae (A) samples collected from the 8 examined sites were measured by atomic absorption spectrometry (AAS) technique.
Genomic DNA extraction
Algal genomic DNA was extracted from algae thalli collected from the 8 examined sites, using CTAB (cetyltrimethylammonium bromide) protocol as described by Doyle and Doyle (1987). DNA was kept at -80°C until used.
Td-DAMD molecular marker
Genomic Template Stability (GTS%) estimations
Algal DNA changes were determined based on genomic template stability (GTS%). The polymorphism between control (non-polluted site) and polluted sites was calculated by recording the appearance of new bands and disappearance of bands in polluted sites, compared to their respective control band profiles.
Genomic template stability (GTS%) was calculated according to Atienzar et al. (2002) as follows:
GST% = (1- a/n) x 100
Where (a) is the DNA polymorphism profile in each polluted site and (n) the number of total bands in the control. Polymorphism observed in Td-DAMD profiles included disappearance of a normal band and appearance of a new band in comparison to the control Td-DAMD profiles.
Statistical analysis
RESULTS AND DISCUSSION
AAS analysis revealed that Zn concentration was ranged between 0.207 (S8) – 0.633 (S1) µg/g in SW samples and it was ranged between 0.460 (S8) – 1.767 (S5) µg/g dw in A samples (Table 3). Whereas, Pb concentration was ranged between ˂0.200 (S1, S2, S3, S4, S5, S6 & S8) – 0.207 (S7) µg/g in SW samples and it was ranged between ˂0.200 (S1, S2, S3, S4, S6, S7 & S8) – 1.300 (S5) µg/g dw in A samples (Table 3). As for Cu, its concentration was presented in similar manner in scarce amounts (˂0.050 µg/g) in SW samples regardless collection sites;
From data obtained herein, algal thalli grown in S5 accumulated the highest Zn, Pb and Cu concentrations than the other examined sites.
As for genotoxicity assessment, algal DNA change profiles in the examined sites, using Td-DAMD marker as yielded by URP1F, HBV3 and 33.6 DAMD primers into U. lactuca algae have been presented in Figure 1. The results mentioned that the GTS% was recorded to be 46.472, 56.64,57.418, 67.453, 58.983, 65.566 and 58.405% for S1, S2, S3, S4, S5, S6 and S7 sites, respectively (Table 4).
Sea water and algal thalli samples were collected from 8 sites located along the Lattakia-Syrian coast of the Mediterranean Sea. Pollution level in Lattakia-coastline, Syria has been investigated using U. lactuca (Chlorophyta) algae as bioindicator for sea water pollution based on Zn, Pb, Cu and Cd concentration using AAS technique. Otherwise, pollution genotoxicity on U. lactuca algae based on GTS% estimation has been assessed.
AAS analysis indicated that the examined sites showed different pollutants pattern (Table3). In this regards, site S5 showed the highest heavy metals content compared to the other examined sites. This difference can attribute to the fact that the mentioned site located at discharge influence of river entering the Mediterranean Sea and exposed to our local pollutants emissions.
Based upon AAS data, we can suggest that the Lattakia-coastline is not polluted by the mentioned pollutants at least regarding studied metals. This observation has been established based on other investigations recently published; e.g. in Honaïne coastline- Algeria (Allam et al. , 2016); oceans (Ginneken and de Vries 2018) and South Eastern coast of Tunisia (Annabi et al. , 2018).
Statistical analysis revealed that the samples (SW and A), site collection and interaction samples with site collection significantly affected Zn, Cu and Pb metals content and noticeably Zn one (Table 3).
Topcuoğlu et al. (2010) reported that the Corallina mediterranea , C. officinalis and U. lactuca algae were the most accumulators for Cd, Fe, Ni, Pb and Zn among the examined 11 algae species in Turkey. Whereas, Akcali and Kucuksezgin (2011) reported that Ulva sp. accumulated the highest amounts of Cu among the three examined seaweeds in Aegean sea.
It was noticed that U. lactuca thalli highly accumulated Zn metal than the other measured metals. This observation was in coherent with Chakraborty and Owens (2014); Allam et al. , (2016); Cadar et al. (2018), Annabi et al. (2018) and Jayasinghe et al. (2018) investigations.
In our case study, AAS analysis revealed that the Zn concentration was ranged between 0.207– 0.633 µg/g in SW and between 0.460 – 1.767 µg/g dw in A samples (Table 3). Whereas, Pb concentration was ranged between ˂0.200– 0.207 µg/g in SW samples and between ˂0.200– 1.300 µg/g dw in A samples (Table 3). As for Cu, its concentration was presented in similar manner in scarce amounts (˂0.050 µg/g) in SW samples regardless collection sites; and it was ranged between ˂0.050 – 0.533 µg/g dw in A samples (Table 3). While, Cd concentration was presented in scarce amounts (˂0.050 µg/g) regardless sample type or/and collection sites.
Chakraborty and Owens (2014) reported that Zn was ranged between 41.6-112 µg/g dw, Pb was ranged between 3.6-17.9 µg/g dw, Cu was ranged between 45.5-46.7 µg/g dw and Cd was ranged between 0.060.11 µg/g dw in U. lactuca thalli in South Australian coastline. Whereas, Allam et al. (2016) applied U. lactuca algae for detecting water pollution in Honaïne-Algerian coast. They reported that the U. lactuca content of heavy metals was ranged between 0.45-0.46, 1.442.2, 2.81-3.54 and between 0.15-0.16 µg/g dw for Cu, Pb, Zn and Cd, respectively. Indeed, Annabi et al. (2018) reported the heavy metals (Fe, Zn, Cu, Pb, Cd and Mn) accumulation pattern by U. lactuca thalli collected from 3 different sites located at South Eastern Coast of Tunisia. They reported that Zn concentration was ranged between 0.02-1.615 µg/g dw and between 0.650-1.422 µg/g dw in SW and A samples, respectively. Whereas, Pb concentration was ranged between 0.040.140 µg/g dw in algae thalli. As for Cu, it was ranged between 0.245-2.429 µg/g dw and between 0.037-0.187 µg/g dw in SW and A samples respectively. While, Cd concentration was ranged between 0.018-0.041 µg/g dw and between 0.228-0.578 µg/g dw in SW and A samples, respectively. Whereas, Cadar et al. (2018) reported that the content of heavy metals in U. lactuca was recorded to be 19.28, 3.01, 0.201 and 3.05 mg/kg and to be 19.40, 4.30, 0.266 and 2.95 mg/kg for Zn, Cu, Cd and Pb, respectively during 2016 and 2017, respectively in detecting water pollution in Black Sea. Moreover, Jayasinghe et al. (2018) reported that the Zn concentration in U. lactuca was ranged between 4.7582.00 mg/kg dw, Cu was ranged between 1.82-135.94 mg/kg dw, Cd was ranged between 0.170-0.608 mg/kg dw; whereas, Hg was not detected (LOD<0.07 mg/kg dw).
Table 1. Location sites where samples ( U. lactuca and sea water) were collected.
|
Site N° |
Longitude |
Latitude |
|
1 |
35°34ʹ255ʹʹN |
35°44ʹ459ʹʹE |
|
2 |
35°34ʹ113ʹʹN |
35°44ʹ435ʹʹE |
|
3 |
35°34ʹ161ʹʹN |
35°44ʹ460ʹʹE |
|
4 |
35°33ʹ990ʹʹN |
35°44ʹ288ʹʹE |
|
5 |
35°33ʹ917ʹʹN |
35°44ʹ179ʹʹE |
|
6 |
35°33ʹ789ʹʹN |
35°43ʹ995ʹʹE |
|
7 |
35°33ʹ790ʹʹN |
35°43ʹ996ʹʹE |
|
8 |
35°33ʹ771ʹʹN |
35°43ʹ995ʹʹE |
|
Table 2. DAMD primers used in the current study. |
||
|
Primer Nº |
Primer name |
Primer Sequence 5' to 3' |
|
1 |
URP1F |
ATCCAAGGTCCGAGACAACC |
|
2 |
URP2R |
CCCAGCAACTGATCGCACAC |
|
3 |
URP4R |
AGGACTCGATAACAGGCTCC |
|
4 |
URP25F |
GATGTGTTCTTGGAGCCTGT |
|
5 |
URP30F |
GGACAAGAAGAGGATGTGGA |
|
6 |
FVIIex8 |
ATGCACACACACAGG |
|
7 |
HBV3 |
GGTGAAGCACAGGTG |
|
8 |
YNZ22 |
CTCTGGGTGTGGTGC |
|
9 |
33.6 |
GGAGGTGGGCA |
|
10 |
M13 |
GAGGGTGGCGGCTCT |
|
11 |
HBVb |
GGTGTAGAGAGAGGGGT |
|
12 |
URP2F |
GTGTGCGATCAGTTGCTGGG |
|
13 |
URP6R |
GGCAAGCTGGTGGGAGGTAC |
|
14 |
M13 |
GAGGGTGGCGGTTCCT |
|
15 |
HVA |
AGGATGGAAAGGAGGC |
|
16 |
HVV |
GGTGTAGAGAGGGGT |
Table 3. Heavy metals concentrations in sea water (SW) and U. lactuca algae (A) samples in the examined sites.
|
Zn |
Pb |
Cu |
Cd |
|||||
|
Site |
SW |
A |
SW |
A |
SW |
A |
SW |
A |
|
S1 |
0.633±0.058 Ba |
1.200±0.300 Ab |
<0.200±0.000 Ab |
<0.200±0.000 Ab |
<0.050±0.000 Aa |
0.100±0.000 Ab |
<0.050±0.000 |
<0.050±0.000 |
|
S2 |
0.600±0.000 Bb |
0.730±0.026 Ad |
<0.200±0.000 Ab |
<0.200±0.000 Ab |
<0.050±0.000 Aa |
<0.050±0.000 Ab |
<0.050±0.000 |
<0.050±0.000 |
|
S3 |
0.300±0.000 Bg |
0.833±0.058 Ac |
<0.200±0.000 Ab |
<0.200±0.000 Ab |
<0.050±0.000 Aa |
<0.050±0.000 Ab |
<0.050±0.000 |
<0.050±0.000 |
|
S4 |
0.453±0.076 Bd |
0.710±0.017 Ad |
<0.200±0.000 Ab |
<0.200±0.000 Ab |
<0.050±0.000 Aa |
<0.050±0.000 Ab |
<0.050±0.000 |
<0.050±0.000 |
|
S5 |
0.557±0.040 Bc |
1.767±0.058 Aa |
<0.200±0.000 Bb |
1.300±0.000 Aa |
<0.050±0.000 Ba |
0.553±0.005 Aa |
<0.050±0.000 |
<0.050±0.000 |
|
S6 |
0.307±0.012 Bf |
0.600±0.000 Ae |
<0.200±0.000 Ab |
<0.200±0.000 Ab |
<0.050±0.000 Aa |
<0.050±0.000 Ab |
<0.050±0.000 |
<0.050±0.000 |
|
S7 |
0.377±0.035 Be |
1.133±0.058 Ab |
0.207±0.011 Aa |
<0.200±0.000 Bb |
<0.050±0.000 Aa |
<0.050±0.000 Ab |
<0.050±0.000 |
<0.050±0.000 |
|
S8 |
0.207±0.012 Bh |
0.460±0.056 Af |
<0.200±0.000 Ab |
<0.200±0.000 Ab |
<0.050±0.000 Aa |
<0.050±0.000 Ab |
<0.050±0.000 |
<0.050±0.000 |
Same lowercase letters (columns) and capital letters (rows) are not significantly different at P =0.05 probability by Fisher’s
PLSD test
LSD0.05 Zn=0.1; Pb=0.003 and Cu=0.002.
Data were presented as average (3n) ± standard deviation and expressed in μg/gof dry weight.
Table 4. Estimated genomic template stability (GTS%) yielded by Td-DAMD marker.
|
Primer |
C |
S1 |
S2 |
S3 |
S4 |
S5 |
S6 |
S7 |
|
URP1F |
100.000 |
57.143 |
100.000 |
100.000 |
100.000 |
57.143 |
100.000 |
85.714 |
|
URP2R |
100.000 |
42.857 |
57.143 |
28.571 |
57.143 |
57.143 |
42.857 |
28.571 |
|
URP4R |
100.000 |
90.909 |
72.727 |
72.727 |
72.727 |
54.545 |
72.727 |
72.727 |
|
URP25F |
100.000 |
71.429 |
85.714 |
85.714 |
100.000 |
85.714 |
85.714 |
85.714 |
|
URP30F |
100.000 |
60.000 |
100.000 |
100.000 |
100.000 |
80.000 |
80.000 |
100.000 |
|
FVIIex8 |
100.000 |
61.538 |
61.538 |
69.231 |
69.231 |
69.231 |
61.538 |
61.538 |
|
HBV3 |
100.000 |
72.727 |
63.636 |
63.636 |
54.545 |
63.636 |
81.818 |
45.455 |
|
YNZ22 |
100.000 |
50.000 |
50.000 |
0.000 |
50.000 |
50.000 |
0.000 |
50.000 |
|
33.6 |
100.000 |
57.143 |
57.143 |
57.143 |
71.429 |
71.429 |
78.571 |
71.429 |
|
M13 |
100.000 |
37.500 |
50.000 |
50.000 |
75.000 |
50.000 |
75.000 |
87.500 |
|
HBVb |
100.000 |
33.333 |
66.667 |
66.667 |
50.000 |
33.333 |
33.333 |
16.667 |
|
URP2F |
100.000 |
0.000 |
50.000 |
75.000 |
75.000 |
100.000 |
100.000 |
100.000 |
|
URP6R |
100.000 |
50.000 |
50.000 |
37.500 |
25.000 |
37.500 |
62.500 |
50.000 |
|
M13 |
100.000 |
37.500 |
50.000 |
37.500 |
62.500 |
75.000 |
75.000 |
62.500 |
|
HVA |
100.000 |
16.667 |
66.667 |
50.000 |
66.667 |
33.333 |
50.000 |
16.667 |
|
HVV |
100.000 |
0.000 |
25.000 |
25.000 |
50.000 |
25.000 |
50.000 |
0.000 |
|
Average |
100.000 |
46.472 |
56.64 |
57.418 |
67.453 |
58.983 |
65.566 |
58.405 |
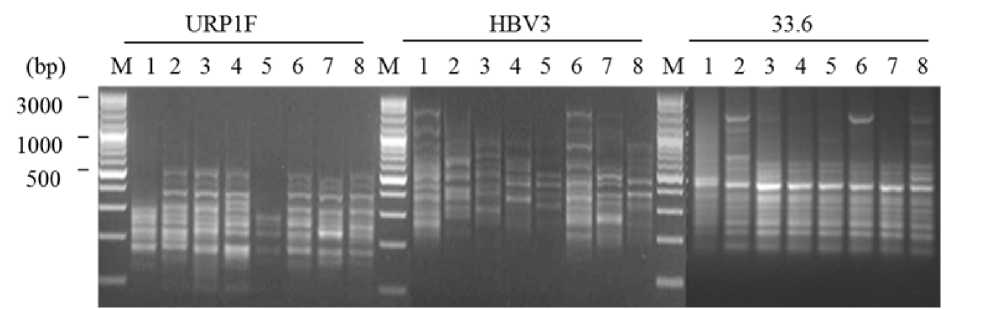
Figure 1. Td-DAMD profile yielded by URP1F, HBV3 and 33.6 DAMD primers into U. lactuca showing DNA change profiles in the examined sites from 1-7 lanes. Lane 8 = control sample. M: A VC 100bp Plus DNA Ladder (Vivantis) ladder standard.
Laib and Leghouchi (2012) reported Cd, Cr, Cu, Pb, and Zn concentration in seaweeds (green, red and brown). They reported that the Zn was accumulated in the highest concentration in the examined seaweeds.
To detect pollution genotoxicity in the Lattakia-coastline, Syria, DNA changes induced by pollutants in the mentioned sites were investigated based on GTS% estimation in U. lactuca using Td-DAMD marker.
Overall, GTS% was recorded to be 46.472, 56.64, 57.418,67.453,58.983,65.566 and 58.405% for S1, S2, S3, S4, S5, S6 and S7 sites, respectively. Based upon this observation, GTS% value is not correlated with observed pollutants concentration in the mentioned sites. This could explain by the fact that, AAS analysis indicated that the Lattakia-coastline, is not polluted by the mentioned pollutants (Zn, Pb, Cu and Cd) at least regarding these metals. On the other hand, the observed algal DNA changes reflecting in GTS% assessed by Td-DAMD marker, could related to other elements that are not emphasized in the current study.
Aras et al. (2011) applied P. furfuracea lichen to detect air pollution in Turkey in 10 sites using 10 RAPD primers. They reported that GTS% value ranged between 81.3-96% according to the studied site.
Under laboratory experiments, Saleh (2015) reported that GTS% value was found to be 65.215, 64.630, 59.835 and 59.250% for Pb, Cu, Cd and Zn exposure, respectively after 5 days exposure using random amplified microsatellite polymorphism (RAMP) marker in U. lactuca algae. Whereas, Saleh (2016a) reported that, GTS% value was found to be 45.4, 69.0 and 72.8% with Cd treatment of 2.5, 5 and 10 mg/L, respectively after 4 days exposure using random Amplified Polymorphic DNA (RAPD) marker in the same algae phyla. Moreover, Saleh (2018b) reported that, GTS% value was found to be 87.274, 84.174 and 70.667 % with Pb treatment of 2, 4 and 8 mg/L, respectively after 4 days exposure using RAPD marker in the same algae phyla.
CONCLUSION
Heavy metals (Zn, Pb, Cu and Cd) content in U. lactuca algae and sea water has been investigated in 8 collection sites from Lattakia-coastline, Syria. AAS analysis indicated that the Lattakia coastline is not polluted by the mentioned pollutants ((Zn, Pb, Cu and Cd) at least regarding these metals. As for GTS%, it is not correlated with observed pollutants concentration in the mentioned sites. Further studies focused especially on determination of other elements than those studied herein and investigation their influence on DNA changes profile are needed.
ACKNOWLEDGEMENTS
I thank Dr. I. Othman (Director General of AECS) and Dr. N. Mirali (Head of Molecular Biology and Biotechnology Department in AECS) for their support, and also the PlantBiotechnology group for technical assistance.
References Heavy metals pollution and its genotoxicity assessment through the green marine Ulva lactuca (Chlorophyceae) algae in the Lattakia-coastline, Syria
- Abacus. (1996) Concept, Statview 4.5 statistical program. Berkeley, Calif. Abacus Concepts
- Akcali I, Kucuksezgin F. (2011) A biomonitoring study: Heavy metals in macroalgae from eastern Aegean coastal areas. Mar Pollut Bull 62(3), 637-645
- Allam, H., Aouar, A., Benguedda, W. and Bettioui, R. (2016) Use of sediment and algae for biomonitoring the coast of Honaïne (Far West Algerian). Open J Ecol 6, 159-166
- Apaydın G, Aylıkcı V, Cengiz E, Saydam M, Küp N, Tıraşoğlu E. (2010) Analysis of metal contents of seaweed (Ulva lactuca) from Istanbul, Turkey by EDXRF. Turk J Fish Aquat Sci 10, 215-220
- Annabi A, Zrig A, Jeddi K, Saleh B (2018) Assessment of trace metal accumulation in green algae Ulva from the South Eastern coast of Tunisia. J Marine Biol Ocean 7(2), 1000193
- Aras S., Beyaztaş T., Cansaran-Duman D., Gökçe-Gündüzer E. (2011) Evaluation of genotoxicity of Pseudevernia furfuracea (L.) Zopf by RAPD analysis. GenMol Res 10 (4), 3760-3770
- Atienzar FA, Venir P, Jha AN, Depledge MH. (2002)Evaluation of the random amplified polymorphic DNA (RAPD) assay for the detection of DNA damage and mutations. Mut Res 521, 151-163
- Cadar E, Mustafa A, Tomescu A, Cherimi M. (2018) Studies regarding polluting agents in Black Sea algae. J Sci Art 1(42), 255-264
- Chakraborty S, Owens G. (2014) Metal distributions in seawater, sediment and marine benthic macroalgae from the South Australian coastline. Int J Environ Sci Technol 11, 1259-1270
- Chakraborty S, Bhattacharya T, Singh G, Maity JP. (2014) Benthic macroalgae as biological indicators of heavy metal pollution in the marine environments: a biomonitoring approach for pollution assessment. Ecotoxicol Environ Saf 100, 61-68
- Chen Q, Pan X-D, Huang B-F, Han J-L. (2018) Distribution of metals and metalloids in dried seaweeds and health risk to population in southeastern China. Sci Rep 8, 3578
- Dourado PLR, da Rocha1MP, Roveda LM, Junior JLR, Cândido LS, Cardoso CAL, Morales MAM, de Oliveira KMP, Grisolia AB. (2017) Genotoxic and mutagenic effects of polluted surface water in the midwestern region of Brazil using animal and plant bioassays. Gen Mol Biol 40 (1), 123-133
- Doyle JJ, Doyle JL. (1987) A rapid DNA isolation procedure for small quantities of fresh leaf tissue. Phytochem Bull 19, 11-15
- Gaudry A., Zeroual S., Gaie-Levrel F., Moskura M., Boujrhal F-Z., Cherkaoui El Moursli R., Guessous A., Mouradi A., Givernaud T., Delmas R. (2007) Heavy metals pollution of the Atlantic marine environment by the Moroccan phosphate industry, as observed through their bioaccumulation in Ulva Lactuca. Water Air Soil Pollut 178, 267-285
- Ince AG, Karaca M. (2012) Species-specific touch-down DAMD-PCR markers for Salvia species. J M Plant Res 6(9), 1590-1595
- Jamers, A., Blust, R., De-Coena, W., Griffinab, J.L. and Jonesco, O.A.H. (2013). An omics based assessment of cadmium toxicity in the green alga Chlamydomonas reinhardtii. Aquat Toxicol 126 (1), 355- 364
- Jayasinghe GDTM, Jinadasa BKKK, Chinthaka SDM. (2018) Nutritional composition and heavy metal content of five tropical seaweeds. Open Sci J Anall Chem 3(2), 17-22
- Laib, E., Leghouchi, E. (2012). Cd, Cr, Cu, Pb, and Zn concentrations in Ulva lactuca, Codium fragile, Jania rubens, and Dictyota dichotoma from Rabta Bay, Jijel (Algeria). Environl Monit Assess 184, 1711-1718
- Mohamed L.A., Khaled A. (2005) Comparative study of heavy metal distribution in some coastal seaweeds of Alexandria, Egypt Chem Ecol 21(3), 181-189
- Saleh, B. (2015) Detection of genetic variations in marine algae Ulva lactuca (Chlorophyta) induced by heavy metal pollutants. J Stress Physiol Biochem, 11 (3), 26-37
- Saleh, B. (2016a)Genetic variation in Ulva lactuca (Chlorophyceae) marine algae under cadmium stress. J Bioinnov, 5 (5), 673-685
- Saleh, B. (2016b) DNA changes in cotton (Gossypium hirsutum L.) under salt stress as revealed by RAPD marker. Adv in Horticul Sci 60(1), 13-21
- Saleh B. (2018a) Algae in pharmacology and medicine applications: A review. J Bioinnov 7 (6), 878-907
- Saleh B. (2018b) Lead genotoxicity in Ulva lactuca (Chlorophyta) seaweed as revealed by RAPD marker. J Bioinnov 7 (5), 790-803
- Topcuoğlu S, Kılıç Ö, Belivermiş M, Ergül HA and Kalaycı G. (2010) Use of marine algae as biological indicator of heavy metal pollution in Turkish marine environment. J Black Sea/Med Environ 16(1), 43-52
- van Ginneken, V. and de Vries, E. (2018) Seaweeds as biomonitoring system for heavy metal (HM) accumulation and contamination of our oceans. Am J Plant Sci, 9, 1514-1530
- Wong MH, Kwok TT, Ho KC. (1982) Heavy metals in Ulva lactuca collected within Tolo Harbour, an almost landlocked sea. Hydrobiol Bull. 16 (2-3), 223-230
