High-Fidelity compression of 3D mesh animation data for humorous cartoon animation production

Author: Li Y.
Journal: Компьютерная оптика @computer-optics
Section: Численные методы и анализ данных
Article in issue: 5 т.49, 2025.
Free access
Humorous cartoon animation with its easy and pleasant style and colorful methods of expression, has become an important entertainment way for people to find relaxation and laughter in their busy lives. However, the data in the current humorous cartoon animation production is too complex. Therefore, the research proposes a new method based on high-fidelity compression algorithm, focusing on the special characteristics of 3D mesh animation data, and optimizing the compression from the two dimensions of time domain and space domain. The experimental results show that the proposed method exhibits higher compression ratio and rate, the average compression ratio reaches 2.55, and the compression rate reaches up to 65.34 Mb/s. It also exhibits lower mean squared deviation and high structural similarity index, the former is 1.56%, and the latter reaches up to 0.98. In the practical application, a compression effect of about 2:1 is achieved. Finally, in the volunteer rating of the produced humorous cartoon animation, the overall average score reaches 9.02. The study provides a new solution for the high-fidelity compression of 3D mesh animation data, which has the potential for practical application and is of great guiding significance for improving the efficiency and quality of animation production.
Humor cartoon animation, high-fidelity compression, 3D mesh, animation data, time-space domain
Short address: https://sciup.org/140310605
IDR: 140310605 | DOI: 10.18287/2412-6179-CO-1530
Text of the scientific article High-Fidelity compression of 3D mesh animation data for humorous cartoon animation production
In today's booming digital entertainment, humorous cartoon animation, as a unique and creative art form, has become one of the audience's favorite forms of entertainment [1, 2]. The charm of humorous cartoon animation lies in its ability to provide viewers with a unique visual experience through exaggeration, humor, and creativity [3, 4]. However, the complexity of this type of animation also makes the amount of data involved huge, which puts severe demands on transmission, display and storage [5]. The storage and transmission of large-scale 3D mesh data is an extremely resource-intensive task, while the direct processing of uncompressed data is not intelligent enough [6]. In multimedia systems, especially in scenarios that need to be transmitted remotely and played in limited storage space, how to efficiently process 3D mesh animation data has become an urgent technical challenge [6]. Therefore, the study proposes a novel high-fidelity compression algorithm (Time-Space PartitionBased Compression Algorithm, TSP-CA) for 3D mesh animation data in humorous cartoon animation production, based on time and space domain partitioning and combining classical compression methods. The research aims to provide a more efficient and innovative 3D animation compression method to meet the needs of cartoon animation production in the field of digital entertainment, while ensuring that the quality of the animation and the humor elements are not lost during the data processing.
The innovation of the proposed TSP-CA algorithm lies in the adaptive data compression by combining time-
domain and spatial-domain segmentation techniques. In addition, TSP-CA algorithm also introduces boundary editing and matrix recombination technology to optimize the problem of information loss at the boundary of traditional PCA method, and improves the matrix recombination process by spectral clustering and EMD.
The study is divided into four parts, the first part introduces the current worldwide research on animation production, compression algorithms and other technologies. The second part mainly introduces the high-fidelity compression algorithm based on spatio-temporal segmentation. The third part verifies the performance of the algorithm proposed in the study through various experiments to ensure its effectiveness and superiority. The last part is to summarize the discussion of the article.
1. Related work
The field of animation production has evolved tremendously over the past few decades, from traditional hand-drawn animation to modern 3D computer-generated animation. Ye et al. worked on solving the challenge of virtual augmented reality animated characters interacting with their real environments by introducing the method of Support Vector Machines with the AR Animator system, which enables users to easily create in-situ character animations closely interacting with a wide range of real environments [7]. Arshad et al. on the other hand, focusing on the flexibility constraints of the character rigging process in 3D animation production, proposed a methodology to explore the process of a basic character rigging system. The study points out that chained rigging system is the best choice applicable to anthropomorphic characters because the rigging process in animation directly affects the character's movements and poses in the final animation [8]. Paier et al. propose a hybrid animation framework to address the challenges of producing realistic face animation in the field of computer graphics. The framework takes advantage of the latest advances in deep learning to provide an interactive animation engine for facial expression editing through intuitive visualization [9]. Li et al. focus on the application of virtual reality technology in the medical field, especially combining 3D animation technology for the animation of virtual medical systems, and propose a method for the design of virtual medical animation systems in the context of virtual reality technology in order to achieve a variety of interactive realtime effects to provide users with a rich perceptual experience [10].
In today's era of digital information explosion, efficient utilization of data transmission and storage has become crucial. With the popularity of wireless technology, Internet and various sensor networks, a large amount of data needs to be transmitted and saved with limited bandwidth and storage resources. Wiedemann et al. addressed the inefficiency problem of video compression by proposing a general compression algorithm for deep neural networks called DeepCABAC, which minimizes the rate distortion function and thus provides a new way for efficient compression and transmission of large-scale videos, thus providing a new way for efficient compression and transmission of large-scale videos [11].Sun X et al. proposed a novel clustering-based point cloud compression algorithm for the problem that the huge transmission and storage requirements of point cloud data may become a critical bottleneck, and experimentally proved that the algorithm can significantly reduce the spatial redundant information of point cloud data, with a compression ratio close to 5%, and compressed the point cloud to 5% of the original size without any distance distortion [12]. Messaoudi et al. proposed a compression algorithm based on discrete cosine transform for the lossy compression needs of static color images, using adaptive block scanning to generate compressed images by using a simple technique to efficiently encode the coefficients of the discrete cosine transform, thus providing a new approach for the compression of static color images [13]. Aiming at the limitations of energy, bandwidth, memory and processing power for image transmission in wireless sensor networks, a highly reliable and low-complexity image compression scheme based on the neighborhood correlation sequence algorithm is proposed, which results in a better balance between the compression efficiency and the quality of the reconstructed image [15].
Aiming at the data compression problem in healthcare system, Jha et al. proposed a data compression scheme combining empirical mode decomposition and discrete wavelet transform, thus providing better compression performance while retaining key features of signals well
-
[15] . Schwarz et al. introduced tree coding quantization, advanced context modeling for entropy coding at the transform coefficient level, arithmetic coding engine with multi-hypothesis probability estimation, and joint coding pairs of chromaticity residuals in view of quantization and entropy coding methods in video compression standards, so as to compress data and improve coding efficiency [16]. Wu et al. proposed a learning block-based hybrid image compression framework for parallel acceleration and memory overflow during high-resolution inference encountered by existing learning image compression methods in practical applications, thus effectively reducing compression and decoding time [17]. Aiming at texture coordinate compression, an important part of the basic grid coding in MPEG's V-DMC standard, Zou et al. proposed an improved geometric guidance method for predicting texture coordinates, so as to improve the accuracy of texture coordinate prediction [18]. Nousias et al. proposed a new depth significance mapping method to be applied to 3D mesh in order to meet the demand for accurate representation in aspects such as capture, processing, compression, simplification and storage, thereby improving the efficiency and effect of 3D mesh processing [19].
-
2. High-fidelity compression algorithm for 3D mesh animation data in humorous cartoon animation production
-
2.1. High-fidelity compression algorithm based on spatio-temporal segmentation
Aiming at the storage and transmission of CT/MR DICOM images in telemedicine applications, Nousias et al proposed a lossless predictive compression algorithm based on the least squares method to optimize the compression efficiency of CT images [20]. Aiming at the quality assessment problem in image compression, Zhang proposed a new full-reference image quality assessment algorithm to measure the perceived quality of compressed images, and used the local adaptive low-pass filtering process as a pre-processing operation to avoid the influence of random noise [21]. Liu et al. proposed an end-to-end deep neural video coding framework to address the limitations of traditional block-based video coding in terms of visual content understanding, feature extraction and compact representation, thus achieving consistent performance improvement in distortion measurement [22]. Nayak et al. proposed a novel algorithm to capture image features and reduce computational complexity, which integrated significance value and low-complexity block truncation coding into a single framework, thus achieving better perception quality under lower visual artifacts [23].
In summary, the field of animation production has made significant progress in the direction of virtual augmented reality, 3D animation production, realistic face animation and virtual medicine. However, there is no good solution for problems such as data redundancy in humor cartoon animation production. Therefore, in order to solve the problems of data transmission and storage, the research proposes a high-fidelity compression algorithm that reduces data redundancy and complexity in both time and space domain dimensions. The innovation of the study is to start from the two perspectives of time and space, complete the animation compression by reducing the redundancy degree of both, and introduce the compression optimization method based on boundary editing to reduce the inconsistency at the boundary in the process of animation reconstruction, so as to improve the reconstruction quality of the decompressed animation data.
Three-dimensional grid animation plays a key role in the production of humorous cartoon animation, which brings a higher level of technical and creative performance for humorous cartoon animation. Therefore, the study proposes a high-fidelity compression algorithm that reduces data redundancy and complexity in both time and space domains to address the complexity of 3D mesh animation data in the process of humorous cartoon animation production.
3D mesh animation is a form of animation based on the mesh structure in three-dimensional space, which presents the motion and change of objects in threedimensional space in a time sequence through deformation, motion and rotation operations on the mesh. 3D mesh animation data is a collection of data describing the motion and deformation of objects in 3D space, including vertices, edges, faces and other elements that constitute the mesh structure. Each keyframe records the state of the mesh at different points in time, while the motion and deformation information describes the trajectory, rotation, scaling, and shape changes of the object [24]. Therefore, 3D mesh animation data is usually very large and complex. The study addresses this problem by proposing the TSP-CA algorithm. By controlling the amount of 3D mesh animation data presented per second combined with the similarity between 3D models, TSP-CA can realize animation compression. Meanwhile, for the motion of the 3D model that is the subject of the animation, TSP-CA realizes effective compression of the animation by reducing the redundancy in the time domain. The study represents the 3D mesh animation as shown in Equation (1).
Animation = ( { V if } , E ) , f = 1,2, - , F , i = 1,2, - , N .(1)
In Equation (1), V denotes all animation frames of the 3D mesh animation, and Vif denotes the i -th point of the 3D mesh model at the f -th frame. The study defaults that the topology between vertices in 3D mesh animation remains constant throughout the motion process, i.e., the number of vertices in all animation frames is N . The TSP-CA process is shown in Fig. 1.
As can be seen from Fig. 1, the proposed TSP-CA performs a conditional judgment after completing the initial time-domain segmentation, and performs the nulldomain segmentation if the condition is satisfied, and di- rectly compresses the 3D animation if the condition is not satisfied. The TSP-CA is adaptive, and there exists almost one conditional judgment for each step, and when the initial value is determined, according to the result of the conditional judgment, the TSP-CA is able to flexibly perform the time-domain segmentation or the nulldomain segmentation or even directly compress the animation. Segmentation or null domain segmentation or even compression of the animation directly. In addition, in each segmentation step, TSP-CA has a certain probability of obtaining a spatial-temporal segmentation block for the final compression step of the algorithm. There are many parameters involved in TSP-CA and their meanings are shown in Tab. 1.
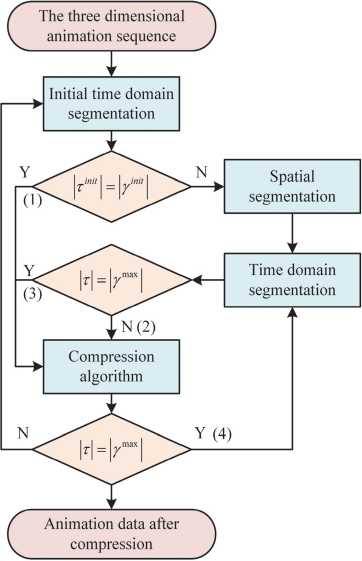
Fig. 1. Schematic diagram of the TSP-CA process
In Tab. 1, у ln“ and у max are the initial input parameters of TSP-CA. TSP-CA is divided into time-domain segmentation algorithm and space-domain segmentation algorithm. The time-domain segmentation algorithm mainly splits two neighboring frames with large differences in the initial time-domain segmentation. The study introduces the concepts of Hilbert space embedding, higher order moments and Maximum-Mean Discrepancy (MMD) [25]. Hilbert space embedding helps to express the dissimilarity of neighboring frames in Hilbert space, thus better quantifying the similarity or dissimilarity between them [26]. Higher-order moments characterize the distribution of adjacent frames more comprehensively than being limited to mean and variance. The MMD problem is used to determine the similarity between adjacent frames. Under the three concepts, the study splits у ,n“ into two sequences of [1, ..., b ], [ b , ..., уm“] and thus the detection of т is fitted to the similarity problem between[1, …, b ], [ b , ., y m“ ] as shown in Equation (2).
m min./ ( [ V '1, V b ]/■ * "^ i * ] ) . b -I ',•••, [ I
In Equation (2), I denotes the degree of correlation of the two subsequences. b The computation of the value is done by Equation (3) as follows.
1 2 ^ f'I K ( y b ; . b i + w y b . b i + w \
T|2 ^j ( ’ minУ TK (vb. b+ w, vb . b + w)
8[t..^“I |Ti|\Ti\ S‘J k’
A S !"K ( Vb .bj + w ybj .bj + w\ IT2I2 S ( ’
In Equation (3), T 1 and T 2 denote the set of two timedomain partitions, vb: ^ bi + w denotes the subsequence from b frame to b + w frame, and K denotes the kernel function, which is used to compute the similarity between the two subsequences within the sliding window, as shown in Equation (4).
K ( v b . b . + w , v b^ b j + w
) = exp ( -X|| vbi
, v b . b w ||2 ) .(4)
In Equation (4), X denotes the parameters of the kernel function. The time domain segmentation algorithm utilizes the kernel function to represent and measure the similarity of the time domain segmented data, so as to realize the time domain segmentation of neighboring frames with large differences. The null domain segmentation algorithm occurs after the time domain segmentation algorithm, at this time, there is a spatio-temporal compressed block in the animation with a frame length of т ln“ size, firstly, the edge length change calculation is performed on the spatio-temporal compressed block, and the threshold value of the rigid edges is determined to be 0.2 using an exponential distribution fitting. Then, through the binary classification annotation, the vertices are classified into rigid and non-rigid. The study utilizes the region growing clustering method to obtain N g initial segmentations and save the clustered data. Finally the segmentation of the null domain is accomplished by recombination of rigid regions. This segmentation is done by minimizing the reconstruction error of Equation (5) as follows.
18 ' - «f =h ' - ( C [ ‘ ] + «)| Г (5)
In Equation (5), 3' and 3j denote the original vertex data and the spatio-temporal segmented and compressed data, respectively, and C[i] denotes the compressed data block corresponding to the original data. The study us-esdl, l = 1, 2, …, L to denote the spatio-temporal segmentation blocks, where L denotes the total number of blocks. TSP-CA employs Principal Component Analysis (PCA) to perform matrix decomposition for each spatiotemporal segmentation block, and introduces the parame- ter a to control the compression accuracy. The matrix decomposition is shown in Equation (6).
3 l = B l x C l + A . (6)
In Equation (6), B l , C l , A l denote the original data projection, principal components, and vector means, respectively. Based on this, the study reconstructs 3 1 as shown in Equation (7).
3 1 * B i ( 1: p ) x C i ( 1: p ) + A . (7)
In Equation (7), p denotes the first p principal components, and it is worth noting that the parameter a here serves to select the first p principal components, i.e., the cumulative degree of importance of the selected first p principal components must be greater than that of a . The final compression result is shown in Equation (8).
S l Ф i , l = 1,2,..., L . (8)
Equation (8) represents the accumulation of the compression results of all spatio-temporal compression blocks, and ф l denotes the result after high-fidelity compression using open source data compression libraries.
-
2.2. Optimization of TSP-CA by boundary editing and matrix reorganization
When PCA is used in TSP-CA, the PCA algorithm is non-destructive, resulting in the loss of information stored in each spatio-temporal segmentation block. When the spatio-temporal segmentation blocks are recombined to form the complete animation data, these losses may be superimposed at the boundary, causing large errors and affecting the visual effect. For this reason, two methods, boundary editing and matrix reorganization, are introduced to optimize TSP-CA. Boundary editing reduces errors and enhances boundary consistency by fine processing at neighboring boundaries to improve continuity and visual effects. Matrix reorganization aims to make more full use of the similarity and improve the efficiency of the compression algorithm by reorganizing the compressed matrix to reduce redundant information. For boundary editing, the study uses four methods, which are linear interpolation, polynomial interpolation, boundary error compensation, and smoothing. Linear interpolation is used to fill in the values between boundary points and is suitable for cases where the values at the joints are estimated through simple linear relationships. Polynomial interpolation is used when a higher number of interpolation approximations are required, and is suitable for estimating the value of a connection through a more complex functional relationship. Error compensation methods are used to correct joint errors by comparing differences between neighboring blocks. Smoothing is suitable for cases where discontinuities are reduced by smoothing the data at the join. The matrix reorganization is more complicated, and its specific process is shown in Fig. 2.
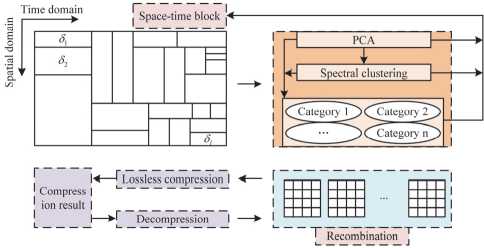
Fig. 2. Matrix reorganization process in TSP-CA optimization
As can be seen in Fig. 2, matrix reorganization takes the correlation between the decomposition matrices as the entry point. The study uses the Euclidean distance metric to measure the edge weights between each two decomposition matrices, where the decomposition matrices are regarded as a point, and this is used to construct the connectivity between points, i.e., between decomposition matrices and decomposition matrices. Next, an undirected graph is constructed using spectral clustering capable of extracting similarities between the data, the nodes of the undirected graph and are the decomposition matrices. Specific steps include expanding the decomposition matrix into one-dimensional vectors, measuring the distance between the vectors by constructing a histogram and using Earth Mover's Distance (EMD) instead of Euclidean distance. The study denotes B l , C l , and A l as X . The EMD was used to construct the distance matrix, where the rows of the matrix represent its correlation and indirectly the characteristics of the matrix. The matrix is fed into the clustering algorithm for classification according to Equation (9) as follows.
®у= EMD ( H ( X i ) , H ( X j ) ) , X = { B , C , A } . (9)
In Equation (9), ® ij■ represents the elements in the i rows and j columns of the distance matrix, EMD ( ) denotes the computation of EMD, and H ( ) is a function that expands the matrix into a one-dimensional vector. The solution of EMD is actually solving the minimization problem shown in Equation (10).
minE^ j f ,j d i,j . (10)
In Equation (10), f i , j and d i , j denote the cost and pairwise distances of the two distribution moves, respectively. EMD is computationally intensive along with high complexity, so the study simplifies it by using the distance between the centers of mass of the two distributions, i.e., the lower bound of EMD, as a substitute. The study uses K-means to cluster the distance matrix as shown in Equation (11).
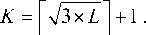
In Equation (11), K is the number of clusters and L is the number of spatio-temporal compression blocks. The reorganization dimension is performed for the k_0-th clustering block as shown in Equation (12).
|Bk\ +| c k\ +| A k | ] .(12)
In Equation (12), X i k represents the i -th matrix within the k _0-th clustering block, B i k , C i k and A i k are the same. The purpose of Equation (12) is to create more vector contacts, where vectors refer to vectors of different lengths in the same category. There are three types of padding when performing matrix reorganization, which are left-to-right, alternating right-left, and spiral padding. The details are shown in Fig. 3.
Type 1 I I I I
Type 2 | | | | |
ТуреЗ I I I I I
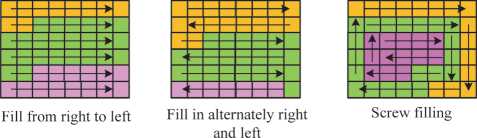
Fig. 3. Three filling methods of matrix recombination
As can be seen from Fig. 3, left-to-right filling means that the leftmost point of the first row is the starting point for filling, and when filling to the specified columns, the filling is performed in the same way from the next row until the end of filling. Right-left alternating fill means that the first left-to-right fill, and then right-to-left fill, the two alternating in each row, that is, the horizontal direction of priority, traversing the elements of each row, but when the specified number of columns is reached, switch to the opposite direction. Spiral fill is to start from the upper left corner and fill the matrix in a clockwise manner until the specified number of columns is reached, i.e., to fill the matrix in a spiral shape, horizontally and then vertically, similar to drawing a circle.
-
3. Performance validation and practical application of high-fidelity compression algorithm for 3D mesh animation data
-
3.1. Verification and analysis of the performance of TSP-CA with its optimization
In order to verify whether the algorithm proposed in the study is helpful for humorous cartoon animation production considering 3D mesh animation data, the study carries out a large number of experimental verifications from both the performance of the algorithm and its practical application, including spatio-temporal segmentation effect, compression effect, distortion analysis and other perspectives, so as to make a comprehensive and objective evaluation of the algorithm's performance.
In order to verify the effectiveness and superiority of TSP-CA, the study conducts a large number of compari- son experiments on it. The comparison algorithms include the commonly used traditional lossless compression algorithm (LCA), transform-based compression algorithm (TCA), entropy coding algorithm (ECA), and blockbased compression algorithm (BCA). They appear respectively in references [20]- references [23]. Six datasets were selected for the study, namely Bosphorus Database, FAUST Dataset, MPEG-4 Animation Framework, CMU Graphics Lab Motion Capture Database, Stanford 3D Scanning Repository, and KIT Whole-Body Human Motion Database. Bosphorus Database is a facial expression database that captures images of the faces of different individuals in a variety of expressions. The FAUST Dataset provides detailed 3D body scans, including a variety of mannequins and poses. The MPEG-4 Animation Framework is an animation data set related to the MPEG-4
standard for the development and testing of animation compression algorithms. CMU Graphics Lab Motion Capture Database from Carnegie Mellon University contains a large amount of human motion capture data. The Stanford 3D Scanning Repository provides 3D scanning results for a variety of objects and scenes, suitable for a variety of 3D modeling research. Finally, KIT WholeBody Human Motion Database contains whole-body human motion capture data, which is ideal for whole-body motion analysis and gait simulation research. The databases are labeled as a, b, c, d, e, and f. Firstly, the study tests the compression ratio and compression rate of different algorithms on different databases, and the results are shown in Fig. 4.
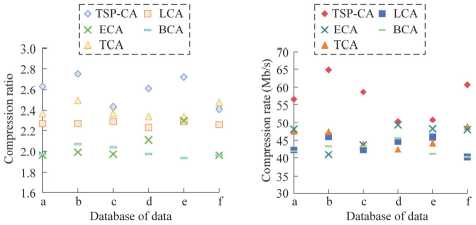
(a) Comparison of compression ratios
(b) Comparison of compression rate
Fig. 4. Compression ratio and compression rate of different algorithms on different databases
From Fig. 4 a , the compression ratio of TSP-CA is basically ahead of the rest of the compared algorithms, with an average compression ratio of 2.55, except for the database f, where the compression ratio of LCA is 2.48 which is larger than that of TSP-CA, which is 2.41.As can be seen from Fig 4 b , the highest compression rate of TSP-CA reaches 65.34 Mb/s, and the lowest one is also 51.98 Mb/s. Whereas LCA averages only 46.45Mb/s, TCA averages only 43.38Mb/s, ECA averages only 44.85Mb/s, and BCA averages only 44.64Mb/s. The study further analyzes the distortion of each algorithm by selecting the metrics Mean Squared Error (MSE) as well as Structural Similarity Index (Structural Similarity Index (SSIM) and the results are shown in Fig. 5.
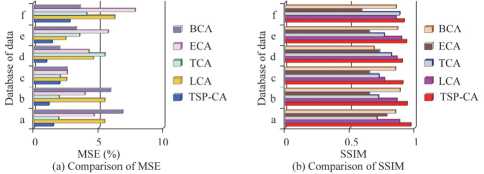
Fig. 5. MSE and SSIM of different algorithms on different databases
As can be seen from Fig. 5 a , the MSE of TSP-CA on the six databases is 1.58%, 1.07%, 2.16%, 0.95%, 1.13%, and 2.46%, with an average of 1.56%, whereas the comparison algorithms with the lowest overall MSE is TCA with an average of 1.98%. As can be seen in Fig. 5 b , the SSIM of TSP-CA is closest to 1, with the highest being 0.98 in database a. This indicates that there is a high degree of structural similarity between the 3D animation generated by TSP-CA compression and the original 3D animation, and it is better than the comparison algorithms. The research takes Bits per vertex frame (bpvf) as the horizontal coordinate and the total error as the vertical coordinate, and selects the methods in references [11], [13], [15] and [16] as the comparison method, and the results are shown in Fig. 6.
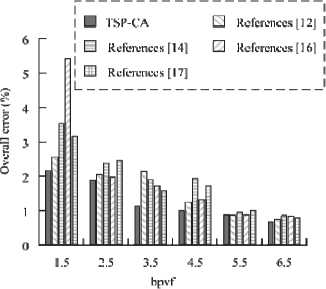
Fig. 6. Comparison of data compression effects
In Fig. 6, a lower bpvf implies a higher compression effect, as it indicates that for each vertex, less storage space is required. As can be seen in Fig. 6, the overall error of each algorithm's compression decreases as bpvf increases, indicating that as the number of bits per vertex per frame increases, the compression algorithms may be able to represent the original animation data more accurately, reducing the distortion due to compression. The overall error of TSP-CA is 2.13% when the bpvf is 1.5, and decreases to 0.64% when the bpvf is 6.5. At this time, the overall error of References [11] is 0.79%, and the overall error of References [13] is 0.83%. The overall error of References [15] was 0.89%, and the overall error of References [16] was 0.80%. Therefore, TSP-CA performs better. Since two optimization algorithms are proposed, the study verifies the effectiveness of boundary editing and matrix reorganization, and the results are shown in Fig. 7.
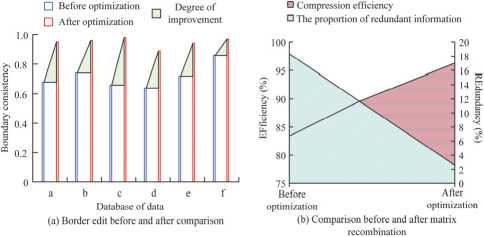
Fig. 7. Boundary edit and matrix recombination validation
As can be seen from Fig. 7 a , after optimizing TSP-CA using boundary editing, the boundary consistency of the animations in each database is improved, for example, the boundary consistency of database a is improved by 0.27, the boundary consistency of database b is improved by 0.22, and the boundary consistency of database c is improved by 0.32, etc., and in general, the boundary consistency is improved by 33.39 % on average. As can be seen in Fig. 7 b , after matrix reorganization, the percentage of redundant information in the compression result is reduced from 18.34 % to 2.58 %, and the compression efficiency is improved from 84.65 % to 96.28 %. The data proves that boundary editing and matrix reorganization can work well.
-
3.2. Validation of TSP-CA in real production cases
34.12 % and 43.45 %, respectively. For the animation sequence of the child exercise, the degree of improvement after TSP-CA compression is lower. In addition, right-to-left padding has the greatest improvement for TSP-CA, reaching 16.46 % on average. Therefore, the study was conducted for the spatio-temporal segmentation for the kid workout versus the matrix reorganization using right-to-left padding, and the results are shown in Fig. 9.
To further validate the performance of the proposed TSP-CA, the study applies it to real animation sequences. Firstly, different types of animation sequences are selected from six databases for compression, such as clothing animation, face expression change, puppy running, etc. In addition, the study not only verifies the performance of TSP-CA, but also compares the three filling methods in matrix reorganization, in order to get better results in the subsequent practical applications. The right-to-left, rightleft alternating, and spiral fills are denoted as J, K, and L, respectively, and the results are shown in Fig. 8.
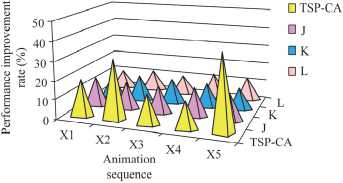
Fig. 8. Performance improvement comparison between TSP-CA and different filling schemes
In Fig. 8, X1-X5 represent five animation sequences, namely, clothing animation, face expression change, puppy running, child exercising, and fan rotation, respectively, and the study compares the performance improvement of these animation sequences after TSP-CA compression, as well as the degree of enhancement of TSP-CA by the three filling methods. As can be seen from Fig. 9, the performance enhancement of face expression change and fan rotation after TSP-CA compression is higher, which is
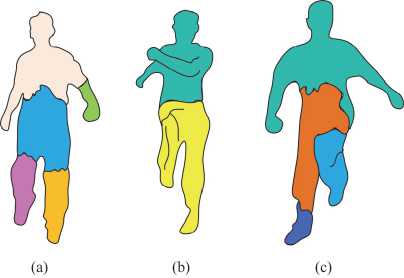
Fig. 9. Spatiotemporal segmentation of children's exercise action sequences
Fig. 9 shows the spatio-temporal segmentation results of the animation sequences of a child walking normally, a child running and a child jumping, respectively fig. 9 a , b and c . From Fig. 9, it can be seen that TSP-CA is able to complete the segmentation of the child exercise animation sequence. This shows that although the compression of TSP-CA is low for the children's exercise animation sequence, it can still achieve satisfactory segmentation results and show better spatio-temporal segmentation performance. On this basis, the study takes another five 3D mesh animation models for TSP-CA compression, the animation models are human, puppy, kitten, eagle and elephant. The compressed results are shown in Tab. 2.
As can be seen from Tab. 2, for the 5 types of 3D mesh animation models, the frames basically remain unchanged after compression by TSP-CA, e.g., the number of frames of the animation model man before compression is 200, and the number of frames after compression is 198. For the model data size, the measured compression ratio is basically around 2:1, e.g., the size of the animation model elephant before compression is 1,039 kb, and the size of the animation model elephant after compression is 495 kb. For the error of 5 types are not more than 1.5 %. Finally, the study randomly selects volunteers to evaluate and score the humorous cartoon animations produced after compression by TSP-CA and the four comparison algorithms, and the volunteers include 18 adults and 18 teenagers, and the evaluation includes the comprehensive evaluation of the fluency, clarity and other indexes of the humorous cartoon animations. The results are shown in Fig. 10.
As can be seen from Fig. 10a, the average rating of 18 adult volunteers for the humorous cartoon animations produced by TSP-CA compression is around 8.82, which is better than that of the comparison algorithm, where the highest rating is 9.62 and the lowest by 8.06. As can be seen from Fig. 10b, the average rating of 18 teenagers for the humorous cartoon animations produced by TSP-CA compression is around 9.21, which is also much better than the comparison algorithm, which indicates that the TSP-CA algorithm has received positive user evaluations on the quality of the generated animations. It is also much better than the comparison algorithm, in which the highest rating is 9.88 and the lowest by 8.72. This indicates that the TSP-CA algorithm has gained positive user evaluations on the compressed production of humorous cartoon animations, and the quality of the generated animations and the humorous effects have been recognized.
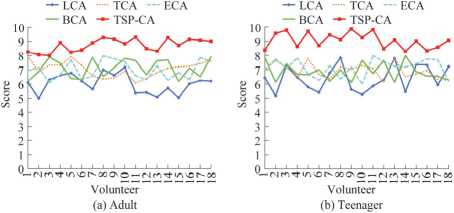
Fig. 10. Results of comprehensive evaluation of volunteers
Conclusion
Aiming at the complexity of data and other problems in the production of humorous cartoon animation, the study proposes a high-fidelity compression algorithm based on spatio-temporal segmentation and optimizes it, and finally proves its effectiveness and superiority through experiments. The experimental results show that the compression ratio of TSP-CA is basically ahead of other comparison algorithms, the average compression ratio reaches 2.55, and the compression rate reaches 65.34 Mb/s. It was significantly higher than LCA (46.45 Mb/s), TCA (43.38 Mb/s), ECA (44.85 Mb/s) and BCA (44.64 Mb/s). The MSE of TSP-CA on the six databases is 1.58%, 1.07%, 2.16%, 0.95%, 1.13% and 2.46% respectively, while the MSE of the comparison algorithm is the lowest overall TCA, with an average of 1.98%. The SSIM of TSP-CA is closest to 1, and the highest is 0.98 in database a. The overall error of TSP-CA is 2.13% when the bpvf is 1.5, and decreases to 0.64% when the bpvf is 6.5. At this time, the overall error of references [11] is 0.79%, and the overall error of References [13] is 0.83%. The overall error of References [15] was 0.89%, and the overall error of References [16] was 0.80%. Through the optimization of boundary editing and matrix reorganization, the boundary consistency enhancement rate reaches 33.39%, and after matrix reorganization, the percentage of redundant information in the compression result is reduced from 18.34% to 2.58%, and the compression efficiency is improved to 96.28%. In practical applications, TSP-CA achieved a compression effect of about 2:1 on different types of animation sequences. The average rating of adult volunteers was 8.82, and the average rating of teenage volunteers was 9.21. Overall, these data fully confirm the excellent performance and effectiveness of TSP-CA in 3D mesh animation data processing for practical applications. However, the proposed method assumes that the topology of three-dimensional mesh is unchanged, so the algorithm cannot be applied to dynamic variable structures with deformed topology. The subsequent research can further improve the universality of the algorithm according to this shortcoming.
