High rate outlier detection in wireless sensor networks: a comparative study

Author: Hussein H. Shia, Mohammed Ali Tawfeeq, Sawsan M. Mahmoud
Journal: International Journal of Modern Education and Computer Science @ijmecs
Article in issue: 4 vol.11, 2019.
Free access
The rapid development of Smart Cities and the Internet of Thinks (IoT) is largely dependent on data obtained through Wireless Sensor Networks (WSNs). The quality of data gathered from sensor nodes is influenced by abnormalities that happen due to different reasons including, malicious attacks, sensor malfunction or noise related to communication channel. Accordingly, outlier detection is an essential procedure to ensure the quality of data derived from WSNs. In the modern utilizations of WSNs, especially in online applications, the high detection rate for abnormal data is closely correlated with the time required to detect these data. This work presents an investigation of different outlier detection techniques and compares their performance in terms of accuracy, true positive rate, false positive rate, and the required detection time. The investigated algorithms include Particle Swarm Optimization (PSO), Deferential Evolution (DE), One Class Support Vector Machine (OCSVM), K-means clustering, combination of Contourlet Transform and OCSVM (CT-OCSVM), and combination of Discrete Wavelet Transform and OCSVM (DWT-OCSVM). Real datasets gathered from a WSN configured in a local lab are used for testing the techniques. Different types and values of outliers have been imposed in these datasets to accommodate the comparison requirements. The results show that there are some differences in the accuracy, detection rate, and false positive rate of the outlier detections, except K-means clustering which failed to detect outlier in some cases. The required detection time for both PSO and DE is very long as compared with the other techniques meanwhile, the CT-OCSVM and DWT-OCSVM required short time and also they can achieve high performance. On the other hand CT and DWT technique has the ability to compress its used dataset where in this paper, CT can extract much less number of coefficients as compared DWT. This makes CT-OCSVM more efficient to be utilized in detecting outliers in WSNS.
Contourlet Transform, Particle Swarm Optimization, Differential Evolution, One Class Support Vector Machine, Outlier, Discrete Wavelet Transform, Internet of Things, Wireless Sensor Networks
Short address: https://sciup.org/15016841
IDR: 15016841 | DOI: 10.5815/ijmecs.2019.04.02
Text of the scientific article High rate outlier detection in wireless sensor networks: a comparative study
Published Online April 2019 in MECS DOI: 10.5815/ijmecs.2019.04.02
Wireless Sensor Networks (WSNs) have risen as one of the most important technologies today which can be used in various fields including, military tracking, medical application, habitat and environmental monitoring application, industry application and personal application [1]. These networks can be considered as the backbone of Internet of Things (IoT) technologies. A WSN consists of large number of low power, low cost and multi-functional nodes that can be used to collect and monitor data in wireless sensing application. The motivation behind utilizing WSNs is not just to gather the deployment data, but basically to analysis these data for decision making [2]. The nature of data gathered by WSNs may be unreliable, inaccurate and of low quality because of the resource constrains of the sensor nodes itself such as energy consumption, storage, bandwidth, computational complexity and node failure [4]. Other reasons due to that the WSNs were deployed in harsh and unintended environments [5]. In addition, malicious attack like, black hole, denial of service, selective forwarding may likewise produce inaccurate data [6]. These inaccurate data are called outliers. Outlier detection is the process of identifying abnormal data among the collected data. Outlier detection techniques permit cleaning, refining and enhancing the performance of the network and also it is important produce secure and reliable networks [3].
The aim of this paper is focused on the design of high speed-high rate outlier detection technique that can be used in WSNs, taking in consideration the limited resources in this type of network, such as; memory, bandwidth, and source power. An investigation of different outlier detection techniques is presented and compared with each other, which include: Particle Swarm Optimization (PSO), Deferential Evolution (DE), K-means clustering, One Class Support Vector Machine (OCSVM), an integration of Contourlet Transform (CT) and (OCSVM) named (CT-OCSVM), and an integration of Discrete Wavelet Transform (DWT) and OCSVM called (DWT-OCSVM).
This paper is outlined as follows. Section 2 presents some of the related works. Next the fundamentals of PSO, DE, OCSVM, K-means clustering, DWT-OCSVM, CT-OCSVM techniques are described respectively. The results and a comparison of these techniques are presented in Section 4. Finally, Section 5 presents the conclusions for this work.
-
II. Related Works
Many researchers have introduced algorithms and techniques to detect outliers in WSNs. For example, Siripanadorn et al. [7] have presented an integration of DWT and Self-Organizing Map (SOM) for outlier detection in WSNs. The raw data are encoded by utilizing DWT technique afterward this encoded data infused to SOM for outlier detection. Also, Takianngam and Usaha et al. [8] have used a combination of DWT and OCSVM for detecting anomalies in WSNs. DWT was utilized for encoding the raw data as in [7] while the OCSVM was used for detecting anomalies. Zhang et al. [9] have presented five techniques for anomaly detection in WSNs using spatial temporal correlation. The proposed techniques are able to detect outliers and recognize between error and event. Sahoo et al. [10] have used naïve Bayesian technique to detect and rectified outlier in WSNs. Different types of attacks was examined for detecting and rectification of the outliers. Soliman et al. [11] compare and asses the most commonly used outlier based intrusion detecting system in hierarchical WSNs and also determined some of the strengthens and weaknesses of each technique. Rassam et al. [12] have presented data reduction by transforming the raw data to another space in WSNs using an adaptive and efficient Principle Component Analysis (PCA). Zhang et al. [13] have presented an online and distributed outlier detection technique in WSNs using ellipsoidal support vector machine that used to increase the detecting rate. Salem et al. [14] have used linear regression to predict the data reading of the sensor from its neighbors reading. The proposed technique can detect outlier and recognize between error and unusual event in medical WSN. Mahmoud et al. [15] have presented an outlier detection technique for smart home WSN using a combination of PCA and fuzzy rule based system. According to the authors the technique can successfully detect the outlier and recognize the data as normal or abnormal. Sinwar and Dhaka [16] have used seven techniques for outlier detection including Radial Basis Function (RBF), pattern clustering, multilayer perceptron, naïve Bayes classifier,
K-means clustering, expectation–maximization (EM) clustering and agglomerative hierarchical clustering. The authors showed that the hierarchical clustering outperforms all other techniques in term of DR while EM clustering technique shows the lowest performance among all techniques. Ahmed [17] has used a combination of PCA and PSO for feature selection and classification in intrusion detection for WSNs. PCA was used for feature reduction and selection while PSO was utilized to choose the ideal subset of feature from the PCA space. Kamal et al. [18] have proposed a technique for outlier detection and identification in WSNs by using Euclidean distance and fuzzy rule based approach. The proposed technique is able to recognize the outlier as error or event. Andrade et al. [19] have used K-means clustering and statistic technique for anomaly detection in WSNs. According to the authors, the proposed technique can provide high DR. Garcia et al. [20] have compared between different techniques for outlier detection in WSNs using raw data gathered from the smart city of Barcelona. Four techniques were used including Mahalanobis Distance (MD), local outlier factor, OCSVM and hierarchical clustering, in which OCSVM gives the best results and outperforms on all other techniques. Gil et al. [21] have introduced three techniques for online anomaly detection in WSNs including, PCA, machine learning, and univariate statistic approach. These techniques are executed within a hierarchical multi-agent system. The results show that the machine learning (Least Squares (LS)- SVM) with modified RBF function can achieve high performance.
-
III. Outlier Detection Techniques
This section presents six different algorithms for outlier detection in WSNs which includes: PSO, DE, OCSVM, K- means clustering, DWT-OCSVM and CT-OCSVM approaches.
-
A. Praticle Swarm Optimization
Particle swarm optimization is an optimization technique introduced by Eberhat and Kennedy [22]. It attempts to enhance the candidate solution over a number of iteration with respect to quality measure (search for the best solution). PSO can be used in various applications including: robotic application, image segmentation, decision making, pattern recognition, speech verification, automatic target detection and many applications. In PSO, at each iteration the velocity changed and particle (population of candidate solution) moved on the way to its gbest (global best) and pbest (personal best) positions.
-
B. Differential Evolution
Differential evolution is an optimization technique developed by Storn and Price [23]. It iteratively attempting to enhance the candidate solutions with respects a quality measure. DE is widely utilized for nonlinear, multimodal and also can be used for noisy discontinues and deterministic problems. It involves the following steps. First randomly choose initial generation.
Second, create new candidate solution from the current generation using process called perturbation. Third, use the selection process for the choice of new population that has the best value [23].
-
C. One Class Support Vector Machine
One class support vector machine is one of the machine learning techniques introduced by Tax and Duin [24] for anomaly detection. In OCSVM the datasets are mapped into higher dimension feature space by hyperplane that split the data fit into various classes (maximize the margin). OCSVM first build training model using set of normal data then the new data are classified as normal or abnormal (testing) according to the trained model [24].
-
D. K-means Clustering
K-means clustering is one of the most known classical clustering techniques that group the objects into K cluster. The objects that are more similar to each other considered to be related to the same cluster. The clustering can be made by minimizing the distance (for example Euclidean, Manhattan, Cityblock distances) between each object and the corresponding centroid [16].
-
E. Integration of Discrete Wavelet Transform with OCSVM
Discrete wavelet transform is a numerical decomposition used in many applications including computer vision, digital communication, image processing, data compression and many others. After applying two dimension DWT four subbands are produced in the transformed space which are, LL, LH, HL and HH where L and H stands for low pass and high pass filter respectively. LL contains rough scale information named approximation coefficients while the remaining three sub bands contain fine scale named detail coefficients. DWT has two main features, first, multiresolution representation, second, time and frequency localization [7,8].
An integration of DWT and OCSVM called DWT-OCSVM is presented in this paper where data are first encoded by DWT then OCSVM is applied for outlier detection in WSNs.
-
F. Integration of Contourlet Transform with OCSVM
Contourlet transform was developed by Do and Vetterli [25] in discrete domain. It has five main features which are multiresolution, localization, directionality, critical sampling and anisotropy. CT is built using an integration of Laplacian Pyramid (LP) and directional filter bank (DFB) therefore it also called Pyramidal Direction Filter Bank (PDFB). LP analyzes the image into low pass and high pass coefficients (determined the point discontinuities in the image) then the DFB uses the high pass coefficients of the LP to decompose the frequency spectrum (link discontinuities to linear structure). The general CT structure with two decomposition levels is shown in Fig.1. The frequency
Contourlet coefficients of an image are considered as its extracted features which can be used for further processes.
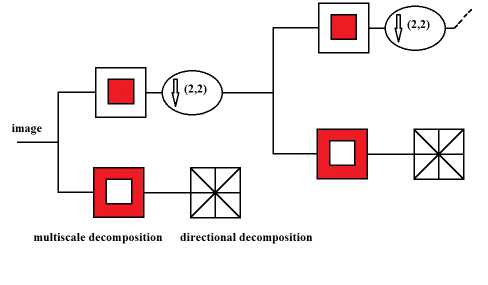
Fig.1. General Contourlet transform with two decomposition levels.
In this work, as the case with DWT-OCSVM, an integration of CT algorithm with OCSVM is proposed to form CT_OCSVM technique. The concept of the CT-OCSVM technique comprise of first converting raw data collected from WSNs into 2D image, and then applying CT algorithm to the image because of its ability of extracting high level information from that image and also for making dimension reduction. Afterward, the OCSVM are applied on the CT coefficients to detect anomalies as shown in the block diagram of Fig.2.
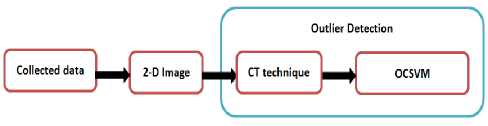
Fig.2. Block diagram of CT-OCSVM.
In the next section, the above mentioned approaches are applied on data collected from a WSN in order to detect the outliers within these data.
-
IV. Experimental Results
Many experimental results are conducted to evaluate the performance of the techniques discussed in the previous section to outlier detection. These techniques are tested on a real data collected from a small WSN - local lab. This WSN is configured with one base station and four sensing nodes used to collect three types of sensed data; Light intensity (L), Temperature (T) and Humidity (H). Table 1. shows an example of the raw data collected from the Lab. based on various packets Sequences (S).
Fig.3 illustrates a sample of temperature data reading for three nodes during the period from 18th-20th /12/2017. Among the collected data of the three nodes of Fig.3, the recorded data of node 4 is characterized by high nonlinearity and with wide gap range between its upper bound and its lower bound temperature. The behavior of the data of node 4 can be regarded as the more complex one, since what are outliers in specific time does not mean they are outliers in other time, and vice versa. For these reasons the data of node 4 is used to test the proposed detecting algorithms.
Table 1. A sample of a raw data collected from a small WSN- local lab.
|
Date/Time |
Node Id. |
S |
T |
H |
L |
|
20/12/2017 16:00:00 |
3 |
16 |
21 |
41 |
7 |
|
20/12/2017 16:00:00 |
2 |
88 |
19 |
46 |
13 |
|
20/12/2017 16:00:19 |
1 |
100 |
21 |
47 |
1 |
|
20/12/2017 16:00:27 |
4 |
86 |
24 |
21 |
22 |
|
20/12/2017 16:00:30 |
3 |
17 |
21 |
41 |
4 |
|
20/12/2017 16:00:30 |
2 |
89 |
19 |
46 |
10 |
|
20/12/2017 16:00:49 |
1 |
1 |
21 |
47 |
1 |
|
20/12/2017 16:00:57 |
4 |
87 |
24 |
21 |
21 |
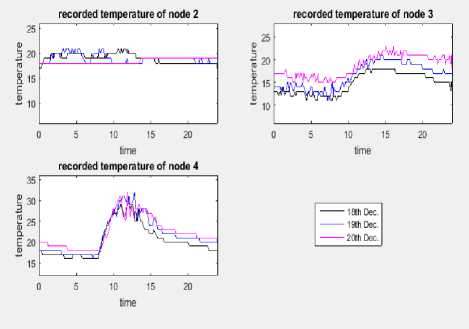
Fig.3. Sample of three consecutive days for temperature data collected from three nodes in the local WSN.
Since both of DWT and CT algorithms are dealing with images, hence; the collected streams of data are converted to 2D images. A sample of 2D image of normal data without outliers is shown in Fig.4 (a), while Fig.4 (b) depicts a sample of 2D image for data with outliers.
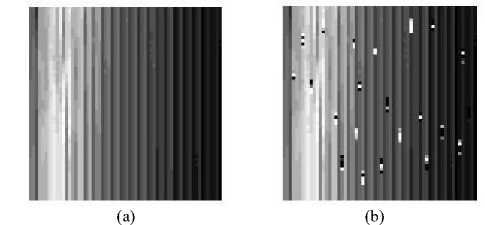
Fig.4. A sample of 2D image. (a) normal data, (b) after imposing some outliers
Four performance metrics are measured which are; time to detect outlier, ACCuracy (ACC), Detection Rate (DR) or True Positive Rate (TPR) and False Positive Rate (FPR).
TP+TN+FP+FN.(
TP
TPR = -—-(2)
TP+FN
FP fpr = .
Where TP, FP, TN, FN are true positive, false positive, true negative and false negative respectively.
Three artificial sorts of faults are utilized as outliers, these are:
-
• Additive White Gaussian Noise (AWGN) is injected to the normal data with 25 dBw fluctuated from short faults (15 outliers) to noisy faults (300 outliers).
-
• Artificial noise between the lower and upper bounds of the normal data, which henceforth is called "in-bound outliers".
-
• Synthetic faults are injected to the normal data (with amplitude from 50 to 100) fluctuated from short faults (15 outliers) to noisy faults (300 outliers).
A comparison of the six techniques covered in this paper are presented in this section including; PSO, DE, OCSVM, K-means, DWT-OCSVM, and CT-OCSVM.
PSO and DE are used as automatic data clustering techniques. Most of the conventional clustering algorithms, like K-means clustering, cannot be utilized to automatically cluster the data where the number of cluster must be known in prior. PSO and DE are metaheuristic techniques that means they don’t creates assumption about the problematic being optimized and can search very deeply in large spaces about the potential solution. In OCSVM, RBF function is used as kernel activation function to deal with nonlinear behavior data. For CT algorithm, an integration of 9-7 biorthogonal filters [26,27] and PKVA biorthogonal quincunx filters [28] are used. Where, 9-7 filter is used in the LP step, while PKVA are utilized in DFB stage. In this comparison, one decomposition level is implemented for CT with 3-level binary tree decomposition is utilized for DFB that gives 2^3=8 subbands of frequency divisions. Also only one decomposition level with Haar filter is used in DWT due its ability to detect changing points.
In CT-OCSVM and DWT-OCSVM techniques the exact position of the injected noise were previously determined and are later used for the identification of FPR and DR. After an anomaly is detected then its position is compared with the identified faults locations, if it is happened, then the detected outlier is true alarm else it is missed. Furthermore, if an anomaly is detected but the noise position did not exist, then the outlier is false alarm.
-
A. Detection Results using 15 in-bound Outliers
In this section, used data is collected from the local lab imposed with 15 in-bound outliers.
The clustering results of PSO is as shown in Fig.5, in which the obtained DR is 40%, FPR is 0.12%, and ACC is 99.7%, while the required detection time is 8.047 sec. Meanwhile the clustering results of DE algorithm, which is shown in Fig.6 achieved DR of 40%, FPR of 0.1057%, and ACC of 99.7% within a detection time of 20.236 sec.
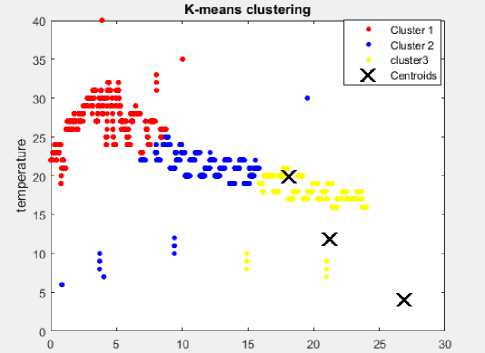
The results of using the K-means clustering with 3 and 6 clusters are shown in Fig.7 and Fig.8 respectively. The experimental results shows that K-means clustering algorithm failed to detect any of the 15 in-bound outliers.
The results of using OCSVM standalone is shown in Fig.9. OCSVM carried out 100% DR, 1.7642% FPR, and 98.242% ACC within a time of 6.546 msec.
Fig.10 illustrates the DWT results, where with LL coefficients the algorithm gave 86.66% DR, 0% FPR, 99.8% ACC and required 0.1154 sec, while with LH coefficients the results achieved 100% DR, 1.488% FPR, 98.44% ACC with detection time of 0.114907 sec.
Fig.11 depicts the output of using CT. Our proposed CT-OCSVM approach (with the integration of (9-7) + PKVA filters, using the second high frequency subband (d2) of CT algorithm), resulted in 100% DR, 0.244% FPR, 99.7558% ACC with detection time of 0.094 sec, meanwhile, the low pass coefficients of the CT achieved 100% DR, 0.563% FPR, 99.43% ACC and it is required 0.094 sec to detect the outliers.
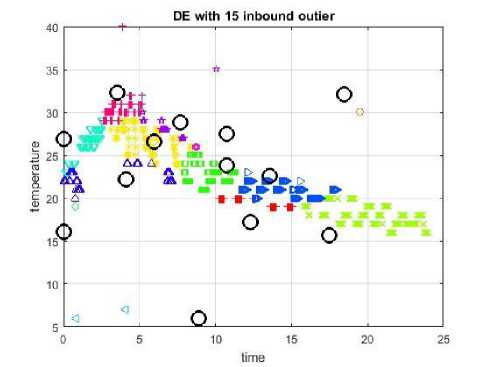
Fig.6. DE with 15 in-bound outlier.
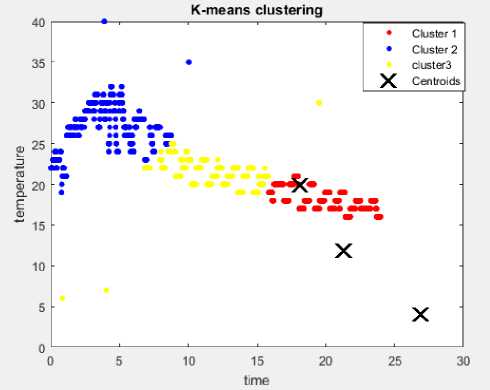
Fig.7. K-means clustering with 15 in-bound outlier and 3 clusters.
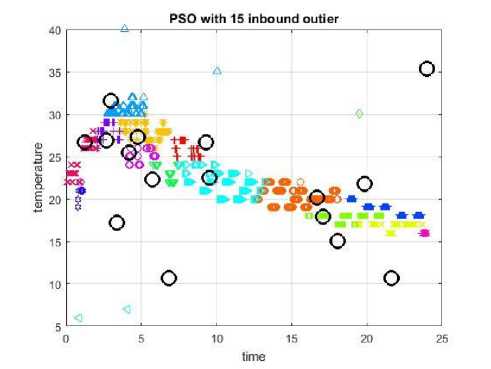
Fig.5. PSO with 15 in-bound outlier.
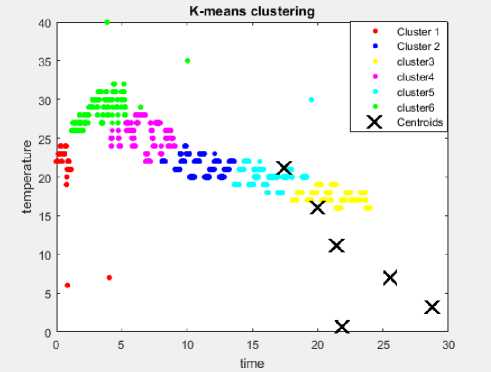
Fig.8. K-means clustering with 15 in-bound outlier and 6 clusters.
temperature
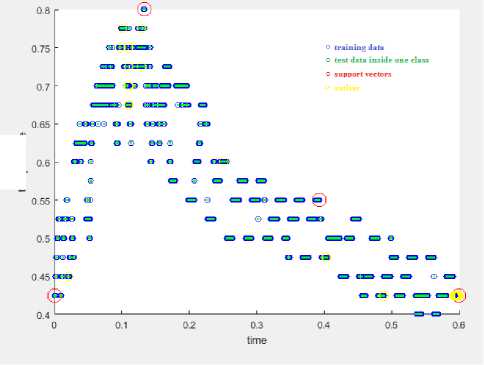
Fig.9. OCSVM with 15 in-bound outlier.
wavelet coefficients
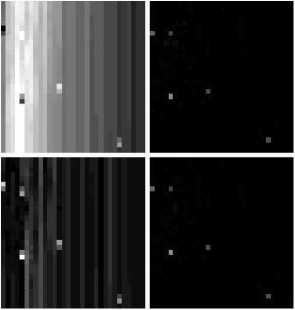
Fig.10. DWT with 15 inbuond outlier.
-
B. Detection Results using 35 in-bound Outliers
This test investigates the capabilities of the studied algorithms when the in-bound outliers increased from 15 to 35. Imposing more outliers between the upper and lower bounds of the recorded data will increase the difficulty of distinguishing the normal data from the outliers.
The obtained clustering results of each of PSO and DE algorithms are shown in Fig.12 and Fig.13 respectively. In PSO algorithm, the obtained DR is 100%, FPR is 0.375%, and ACC is 99.67%. The required clustering time is about 8.413 sec. On the other side, the clustering result of DE algorithm returned with 77.959% DR, 0.21685% FPR, and 99.5094% ACC. The recorded time to complete the clustering process using DE is 21.043 sec.
Fig.14 and Fig.15 illustrate the K-means clustering with 3 and 6 clusters respectively using 35 in-bound outlier. In this test, the K-means algorithm also failed to detect any in-bound outliers.
Fig.16 shows the results of OCSVM algorithm, in which 100% DR is achieved with 1.748% FPR, and 98.266% ACC, the clustering process time required only 6.365 msec.
The results of DWT are shown in Fig.17. With the LL coefficients of the DWT, the calculated DR is 14.285%, FPR is 0%, and the ACC is 97.07% while the required time is 0.10708 sec. The LH coefficients of DWT carried out 100% DR, 0.5055% FPR, 99.511% ACC within a time of 0.11 sec.
contourlet coefficients
Fig.11. CT with 15 in-bound outlier.
The output of testing CT algorithm is as depicted in Fig.18. The CT-OCSVM with the integration of (9-7) + PKVA filter based on the second direction of the high frequency subband (d2) of CT technique resulted in 100% DR, 0.563% FPR, and 99.438% ACC, within a time of 0.095 sec. Meanwhile the low pass coefficients of the CT technique achieved 100% DR, 0.0738% FPR, 99.926% ACC, and it needed 0.095 sec to complete detecting and clustering the data.
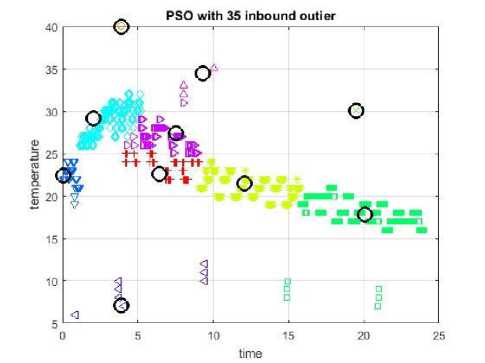
Fig.12. PSO with 35 in-bound outlier.
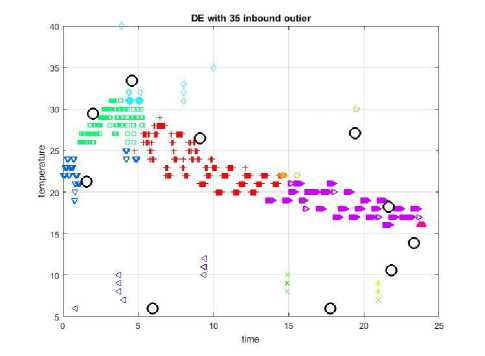
Fig.13. DE with 35 in-bound outlier.
Fig.16. OCSVM with 35 in-bound outlier.
time
Fig.14. K-means clustering with 35 in-bound outlier and 3 clusters.
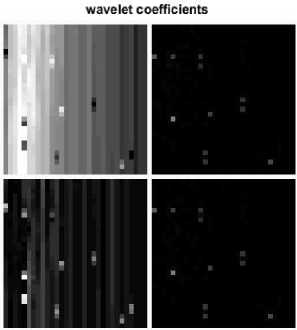
Fig.17. DWT with 35 inbuond outlier.
contourlet coefficients
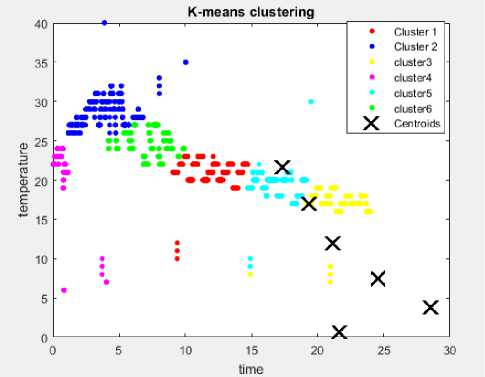
Fig.15. K-means clustering with 35 in-bound outlier and 6 clusters.
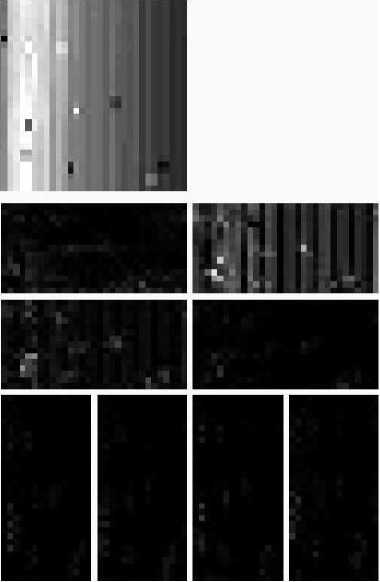
Fig.18. CT with 35 in-bound outlier.
-
C. Detection results using AWGN and Artificial faults
In this subsection, the performances of the compared techniques are carried out in terms of accuracy and the required time to complete the overall detection process. The tests are based on using different ratios of AWGN and artificial faults (with amplitude ranged from 50 to 100) added to the collected data.
Table 2. presents the comparison results for the case of adding AWGN to the collected data. In this table, the ratios of the AWGN represent 0.4%, 2%, 5%, and 7.5% (respectively) of the total number of the collected dataset. Meanwhile, Table 3. presents the performance of these techniques based on using the collected data imposed with artificial faults.
Although there are some differences in the accuracy of the outlier detections, but in general, these are almost of high ratios and close to each other. Meanwhile, comparing the required detection time, OCSVM records the best time, while DE and PSO required very long time. The required time in DE and PSO is proportional mainly with the size of their populations and the number of the permitted iterations. The problem with PSO, DE, K-means, and OCSVM is that they all deals with the total dataset, while in CT-OCSVM and DWT-OCSVM, the clustering is depends on the feature extracted from the first stage of these algorithms. Although the two algorithms reduced the dimension of the data, but CT algorithm makes much more reduction to the data comparing to DWT. According to the results depicted in Table 2 and Table 3, both of CT-OCSVM and DWT-OCSVM algorithms are characterized by very high accuracy, very short detection time, as well as they are dealing in their clustering stage with the reduced dimension of the data (coefficients), taking in consideration that CT outperform DWT in the reduction of the data dimension. Since the constraints of WSNs require saving the bandwidth as well as saving the energy, which can be achieved with low data rate, thus CT-OCSVM can therefore be considered as the more appropriate technique for outlier detection in WSNs.
-
V. Conclusions
The quality of data collected from WSNs is affected by outliers that happen due to different reasons such as malicious attacks, sensor malfunction or noise related to communication channel. Accordingly, outlier detection is an essential process to ensure the quality of data derived from WSNs and to make the right decision. This paper presents a comparison of six different techniques used for outlier detection in WSNs including PSO, DE, OCSVM, K-means clustering, DWT-OCSVM, and the proposed CT-OCSVM techniques. These techniques are tested with real data sets and four performance metrics. CT-OCSVM, DWT-OCSVM, DE and PSO can achieve high detection rate and accuracy with low false alarm rate as compared with other techniques. OCSVM and K-means clustering gives the lowest performance amongst all the algorithms where, K-means clustering failed to detect outlier in the case of the in-bound outlier. CT-OCSVM and DWT-OCSVM techniques outperform on both PSO and DE techniques in term of the required detection time, in which they take very short time. In addition, the CT-OCSVM and DWT-OCSVM technique make a compression to the data where, in this paper CT makes a reduction with one to eight (1:8) while DWT make a reduction of one to four (1:4) of the entire number of data. This property makes CT very suitable to be used in WSNs, in which it prolongs the nodes lifetime, save the energy, as well as save the communication bandwidth. Also CT-OCSVM outperform on the DWT-OCSVM in term of accuracy, DR, FPR in the case of using in-bound outliers. For the need to design high rate outlier detection in WSNs the results show that the CT-OCSVM technique is very suitable and can achieve high detection rate, low false alarm rate, high accuracy, with short detection time, in addition it saves energy and bandwidth by reducing the dimension of the data.
Table 2. Outlier detection with different ratios of AWGN.
|
TECHNIQUES |
Outlier percentage |
|||||||
|
15 (0.4%) |
80(2%) |
200 (5%) |
300 (7.5%) |
|||||
|
Time sec |
ACC % |
Time sec |
ACC % |
Time sec |
ACC % |
Time sec |
ACC % |
|
|
CT-OCSVM [9-7 + PKVA] d2 |
0.093 |
99.9 |
0.092 |
99.6 |
0.092 |
99.2 |
0.093 |
98.3 |
|
CT_OCSVM Lowpass cofficents |
0.093 |
99.2 |
0.092 |
99.53 |
0.092 |
99.65 |
0.093 |
99.8 |
|
DWT-OCSVM LL |
0.114 |
99.9 |
0.114 |
99.4 |
0.115 |
97.9 |
0.115 |
97.3 |
|
DWT-OCSVM LH |
0.109 |
99.6 |
0.109 |
99.8 |
0.110 |
98.6 |
0.112 |
97.7 |
|
PSO |
5.532 |
100 |
8.321 |
99.9 |
8.585 |
99.5 |
7.292 |
98.6 |
|
DE |
22.14 |
99.9 |
23.56 |
99.7 |
25.63 |
99.8 |
23.48 |
97.4 |
|
K-means clustering |
0.297 |
99.6 |
0.304 |
98.65 |
0.307 |
97.43 |
0.331 |
96.21 |
|
OCSVM |
0.006 |
98 |
0.006 |
97.5 |
0.006 |
97.5 |
0.006 |
97.4 |
Table 3. Outlier detection with different ratios of artificial faults.
|
TECHNIQUES |
Outlier percentage |
|||||||
|
15 (0.4%) |
50(2%) |
100 (2.5%) |
300 (7.5%) |
|||||
|
Time sec |
ACC % |
Time sec |
ACC % |
Time sec |
ACC % |
Time sec |
ACC % |
|
|
CT-OCSVM [9-7 + PKVA] d2 |
0.092 |
100 |
0.093 |
100 |
0.093 |
99.8 |
0.093 |
99 |
|
CT_OCSVM Lowpass cofficents |
0.092 |
99.51 |
0.093 |
99.34 |
0.093 |
99.38 |
0.093 |
99.02 |
|
DWT-OCSVM LL |
0.112 |
99.4 |
0.113 |
99.8 |
0.114 |
99.6 |
0.115 |
97.5 |
|
DWT-OCSVM LH |
0.109 |
99.8 |
0.110 |
99.9 |
0.111 |
99.5 |
0.113 |
97.4 |
|
PSO |
4.54 |
99.9 |
7.789 |
100 |
9.975 |
100 |
10.292 |
100 |
|
DE |
22.47 |
99.9 |
22.37 |
99.7 |
24.98 |
100 |
24.97 |
99.8 |
|
K-means clustering |
0.169 |
99.63 |
0.3 |
99.75 |
0.325 |
100 |
0.999 |
99.5 |
|
OCSVM |
0.006 |
97.1 |
0.006 |
97.5 |
0.006 |
97.6 |
0.006 |
97.6 |
References High rate outlier detection in wireless sensor networks: a comparative study
- J. Yick, B. Mukherjee, and D. Ghosal, “Wireless sensor network survey,” Computer Networks, Vol. 52, NO. 12, pp. 2992-2805, 2008.
- Y. Zhang, N. Meratnia, and P. Havinga, “outlier detection techniques for wireless sensor networks: A survey,” IEEE Communications Survey &Tutorials, Vol. 12, NO. 2, pp. 159-170, 2010.
- I. Krontiris, Z. Benenson, T. Giannetsos, F. Freiling, and T. Dimitriou, “Cooperative intrusion detection in wireless sensor networks,” European Conference on Wireless Sensor Networks, Springer, pp. 263-278, 2009.
- R. Jurdak, X.R. Wang, O. Obst, and P. Valencia, “Wireless sensor Network anomalies: Diagnosis and Detection Strategies,” Intelligence-Based Systems Engineering, Springer, pp. 309-325, 2011.
- A.H. Farooqi, and F.A. Khan, “Intrusion Detection Systems for Wireless Sensor Networks: A Survey,” Communication and Networking, Springer, pp. 234– 241, 2009.
- M. A. Rassam, A. Zainal, and M. A. Maarof, “Advancements of Data Anomaly Detection Research in Wireless Sensor Networks: A Survey and Open Issues,” Sensors, vol. 13, No. 8, pp. 10 087–10122, 2013.
- S. Siripanadorn, W. Hattagam, and N. Teaumroong, “Anomaly Detection in Wireless Sensor Networks using Self-Organizing Map and Wavelets,” International Journal of Communications, vol. 4, No. 3, pp. 74–83, 2010.
- S. Takianngam, and W. Usaha, “Discrete Wavelet Transform and One-Class Support Vector Machine for Anomaly Detection in Wireless Sensor Network,” Intelligent Signal Processing and Communication Systems (ISPACS), IEEE, pp. 1-6, 2011.
- Y. Zhang, N.A.S.Hamm, N. Meratnia, A. Stein, M. van de Voort, and P.J.M. Havinga, “Statistics-Based Outlier Detection for Wireless Sensor Networks,” International Journal of Geographical Information Science, vol. 26, No. 8, pp. 1373-1392, 2012.
- L.Sahoo, A. R. Prusty, and S. K. Sarangi, “An Outlier Detection and Rectification Method in Cluster Based Wireless Sensor Network,” International Journal of Computer Science and Telecommunications, Vol. 3, No.4, pp. 63-69, 2012.
- H.H. Soliman, Noha A. Hikal and Nehal A. Sakr, “A comparative performance evaluation of intrusion detection techniques for hierarchical wireless sensor networks,” Egyptian Informatics Journal, vol. 13, No. 3, pp. 225–238, 2012.
- M.A. Rassam, A. Zainal, and M.A. Maarof, “an adaptive and efficient dimension reduction model for multivariate wireless sensor networks applications,” Applied Soft Computing., Vol. 13, pp. 1878-1996, 2013.
- Y. Zhang, N. Meratnia, and P.J. Havinga, “Distributed online outlier detection in wireless sensor Networks using ellipsoidal support vector machine,” Ad Hoc Networks, Vol. 11, No. 3, pp. 1062-1074, 2012.
- O. Salem, A. Guerassimov, A. Mehaoua, A. Marcus, and B. Furht, “Sensor fault and patient anomaly detection and classification in medical wireless sensor networks,” Communication (ICC). IEEE International. Conference, IEEE, pp. 4373–4378, 2013.
- S. Mahmoud, A. Lotfi, and C. Langensiepen, “User activities outliers detection; integration of statistical and computational intelligence techniques,” Computational. Intelligence, Vol. 32. No. 1, pp. 49-71, 2014.
- D. Sinwar, and V.S. Dhaka, “Outlier Detection from Multidimensional Space using Multilayer Perceptron, RBF Networks and Pattern Clustering Techniques,” Computer Engineering and Applications (ICACEA), 2015 International Conference on Advances in, IEEE, pp. 573- 579, 2015.
- I. Ahmad, “Feature selection using particle swarm optimization in intrusion detection,” International Journal of Distributed Sensor Networks. Vol. 11, No. 10, pp. 806-954, 2015.
- S. Kamal, R.A. Ramadan, and E.R. Fawzy, “Smart outlier detection of wireless sensor network,” Facta University, series: Electronics and Energitics, Vol. 29, No. 3, pp. 383–393, 2015.
- A. T. C. Andrade, C. Montez, R. Moraes, A. R. Pinto, Francisco Vasques, and G. L. da Silva, “Outlier Detection Using k-means Clustering and Lightweight Methods for Wireless Sensor Networks,” Industrial Electronics Society (IECON), IEEE, pp. 4683-4688, 2016.
- V. Garcia-Font, C. Garrigues, and H.A. Rif-Pous, “A Comparative study of anomaly detection techniques for smart city wireless sensor networks,” sensors, Vol. 16, No. 6, 2016.
- P. Gil, H.Martins, F.Januário, “Detection and accommodation of outliers in wireless sensor networks within a multi-agent framework,” Applied. Soft Computing, Vol. 42, pp. 204–214, 2016.
- R. Eberhart and J. Kennedy, “A new optimizer using particle swarm theory,”Micro Machine and Human Science, Proceeding of the sixth international Symposium on, IEEE, pp. 39-43, 1995.
- K. Price and R. Storn, “Differential evolution-a simple and efficient heuristic for global optimization over continuous spaces,” Journal of Global Optimization, vol. 11, No.4, pp. 341–359, 1997.
- D.M.J. Tax and R.P.W. Duin, “Support vector description,” Machine Learning, Vol. 54, No. 1, pp. 45-66, 2004.
- M.N. Do and M. Vetterli, “The Contourlet Transform: An Efficient Directional Multiresolution Image Representation,” IEEE Transaction On Image Processing, Vol. 14, No. 12, pp. 2091-2106, 2005.
- J. M. Shapiro, “Embedded image coding using zerotrees of wavelet coefficients,” IEEE Transactions on Signal Processing, Special Issue on Wavelets and Signal Processing, vol. 41, No. 12, pp. 3445–3462, December 1993.
- A. Cohen, I. Daubechies, and J.-C. Feauveau, “Biorthogonal bases of compactly supported Wavelets,” Communication On Pure and Applied Mathmatics., vol. 45, No. 5, pp. 485–560, 1992.
- S.-M. Phoong, C. W. Kim, P. P. Vaidyanathan, and R. Ansari, “A new class of two-channel Biorthogonal filter banks and wavelet bases,” IEEE Transaction on Signal Processing, vol. 43, No. 3, pp. 649–665, 1995.
