High-Resolution Mapping of the Human Olfactory Bulb Using X-Ray Phase Contrast Tomography and Virtual Surface Unfolding

Author: Bukreeva I., Cedola A., Fratini M., Junemann O.
Journal: Компьютерная оптика @computer-optics
Section: International conference on machine vision
Article in issue: 6 т.49, 2025.
Free access
The human olfactory bulb (OB) is a complex neural structure critical for odor processing and one of the earliest sites of pathology in a number of neurodegenerative diseases. We used X-ray phase-contrast tomography (XPCT) to obtain high-quality 3D images of OB tissue from postmortem patients, allowing detailed visualization of soft tissue microarchitecture, including the olfactory glomeruli. To improve spatial analysis, we developed a computational unfolding method that transforms the curved surface of the OB into a 2D map. This transformation preserves anatomical relationships, allowing accurate quantification of glomeruli by number, size, shape, and distribution. The unfolded representations of OB image support in-depth statistical analysis and are compatible with machine learning tools for automated detection and classification of OB morphological structures. This method provides a powerful framework for studying olfactory function and identifying early structural changes in diseases such as Parkinson's disease, Alzheimer's disease, and COVID-19-associated anosmia. By integrating XPCT with virtual unfolding, we offer a new approach to mapping OB morphological features with increased clarity and diagnostic accuracy.
Human olfactory bulb, X-ray phase contrast tomography, virtual unrolling
Short address: https://sciup.org/140313273
IDR: 140313273 | DOI: 10.18287/COJ1789
Text of the scientific article High-Resolution Mapping of the Human Olfactory Bulb Using X-Ray Phase Contrast Tomography and Virtual Surface Unfolding
The human olfactory bulb (OB) is a small yet structurally and functionally complex region of the brain that acts as the primary processing centre for olfactory information. It is the first central relay point where sensory information from olfactory receptor neurons is organised for transmission to higher–order brain areas, such as the piriform cortex and amygdala. Despite its modest size, the OB has complex lamellar structures and specialised neural circuits that are essential for discriminating between odours. Understanding the microarchitecture of the OB is vital not only for explaining olfactory perception, but also for recognising early pathological changes in various neurodegenerative diseases, where olfactory dysfunction is often one of the first clinical signs.
X–ray phase contrast tomography (XPCT) is a powerful tool for imaging soft biological tissues at high resolution, particularly those with low absorption contrast, such as neural tissue. Unlike traditional absorption–based X–ray imaging, XPCT relies on phase shifts in X–ray wavefronts as they pass through soft tissues with small differences in refractive index. This results in significantly enhanced soft tissue contrast, enabling fine anatomical details to be visualised without the need for contrast agents or staining. XPCT provides spatial resolution from the micrometre to the submicrometre scale while maintaining the 3D structural integrity of biological specimens, making it ideal for studying complex neural tissues such as the human OB [1, 2]. XPCT offers significant advantages for investigating the microarchitecture of the olfactory bulb (OB) compared to conventional methods. Its enhanced soft–tissue contrast, high spatial resolution, and non– destructive 3D imaging capabilities effectively overcome key limitations of traditional techniques such as histology, MRI, and absorption–based micro–CT, which often suffer from limited resolution, poor soft–tissue contrast, or require destructive sample preparation [3 –5]. On the other hand, spatial quantification remains challenging due to the OB’s curved, laminar architecture. Traditional analysis relies on labor–intensive manual counting on serial sections, while modern deep learning approaches require extensive cell labeling [6]. This prompts the development of computational flattening techniques inspired by cortical and hippocampus unfolding methods used in brain imaging [7–11]. However, existing computational unfolding tools are not optimized for the OB's radial structure. Our method preserves glomerular spatial relationships by accounting for this radial organization, enabling accurate morphological analysis.
In this study, we use XPCT to create high–resolution 3D reconstructions of the human OB and apply a computational unfolding algorithm to transform the naturally curved 3D surface of the OB into a 2D flattened image. This virtual unfolding significantly enhances our spatial analysis capabilities by providing an accessible planar format that preserves key topological relationships of OB tissue. Similar to cortical flattening methods used in brain mapping [12], this approach opens the way to more quantitative and reproducible analysis of olfactory structures.
The central focus of our work is the analysis of olfactory glomeruli, spherical neuropil structures (typically 50–200 μm in diameter) located near the outer surface of the OB where axons of olfactory receptor neurons converge and synapse with mitral and tufted cells. These glomeruli play a key role in the transmission of olfactory signals. Using flattened imaging, we can:
-
• Visualize glomerular distribution patterns throughout the bulb with minimal distortion.
-
• Quantify the number, size, shape, and spatial arrangement of glomeruli.
-
• Analyze interindividual variability and hemispheric asymmetries with high accuracy.
Furthermore, the OB is particularly vulnerable to early pathological changes in diseases such as Parkinson's disease, Alzheimer's disease, and COVID–19–associated olfactory dysfunction [13, 14]. Olfactory impairment in these conditions often precedes more overt neurological symptoms and is thought to reflect early degeneration of the glomerular and mitral cell circuits. Virtual unwrapping enables more sensitive detection of morphological abnormalities such as glomerular atrophy or spatial disorganization and may serve as a valuable biomarker for disease detection and in–deep study.
From a computational perspective, the transformation of 3D volumetric data into a 2D representation also facilitates the application of machine learning algorithms, automated segmentation, and pattern recognition. These methods may facilitate the development of diagnostic tools, the classification of pathological patterns, and the creation of standardized anatomical atlases of the olfactory system. The flattened format is particularly suitable for convolutional neural network (CNN) architectures, which are well suited for image–based classification tasks.
In this paper, we present our new approach for processing 3D images of the human OB obtained via XPCT. We describe the virtual unwrapping algorithm in detail, which allows for significant enhancements to anatomical, functional, and pathological analyses. This method can be integrated with other imaging techniques such as immunohistochemistry and MRI to achieve multiscale and multimodal understanding of the architecture and function of the human olfactory system.
Materials and methods
Tissue Acquisition and Ethical Considerations
Human OB tissue was obtained by autopsy from an elderly donor without dementia. The study was conducted on autopsy material from the collection of the Federal State Scientific Institution "Research Institute of Human Morphology" (Moscow, Russian Federation). All study protocols were approved by the Ethics Committee of the Research Institute of Human Morphology of the Russian Academy of Medical Sciences (now the Avtsyn Research Institute of Human Morphology of FSBSI “Petrovsky National Research Centre of Surgery”) (No. 6A dated October 19, 2009) and comply with the provisions of the Helsinki Declaration, including paragraphs 7–10 for human material dated January 12, 1996 with the latest amendments dated December 19, 2016.
Sample Preparation Protocol
OB tissue was fixed in 10% neutral buffered formalin for preservation. Following fixation, the specimen was systematically dehydrated using eight successive baths of increasing concentrations of isopropyl alcohol (70%, 80%, 90%, and 100%). The dehydrated tissue was then embedded in paraffin and formed into 5 mm × 5 mm × 10 mm cylindrical blocks optimized for both XPCT and subsequent histological analysis.
X–ray phase contrast tomography acquisition
Experimental setup and parameters
XPCT was performed at beamline P05 of the PETRA III synchrotron facility at DESY in Hamburg, Germany, which is operated by the Helmholtz–Zentrum Hereon [15]. The propagation–based imaging (PBI) mode was chosen due to its effectiveness in virtual histology of neural tissues. In the PBI configuration, phase shifts caused by refraction within the tissue were used to create contrast by converting them into detectable intensity variations as the wavefront propagated from the sample to the detector plane [16, 17].
Tomographic imaging was performed using a monochromatic 25 keV X–ray beam produced with a Si(111) double– crystal monochromator. The sample–to–detector distance was set to 0.5 m to enhance the phase contrast. A total of 4000 projections were acquired during a full 360° rotation with equiangular spacing and an exposure time of 70 ms per projection. The imaging system provided an effective pixel size of 1.28×1.28 μm² with a field of view sufficient to cover the entire cross–section of the OB.
Image Reconstruction and Processing
The acquired projection dataset was pre–processed with flat–field and dark–field corrections as well as phase retrieval [18]. Tomographic reconstruction was performed using a fast filtered back projection (FFP) algorithm to obtain cross– sectional images of the OB. To improve the signal–to–noise ratio, 2×2 binning was applied to the data, resulting in a final voxel size of approximately 2.6 μm×2.6 μm×2.6 μm.
Virtual unfolding methodology
Virtual unfolding of the 3D reconstructed OB image was performed using ImageJ (Fiji) software, which was used to straighten cylindrical surfaces. This approach was chosen since the structure of the specimen closely resembles a series of nested cylinders corresponding to the anatomical layers of the bulb.
Virtual unfolding of the OB was performed as follows:
-
1. Contouring: On the XPCT cross–section, the glomerular layer was manually outlined by drawing a line along its curvature to define its anatomical trajectory.
-
2. Layer thickness determination: A thickness parameter corresponding to the observed width of the glomerular layer was assigned based on visual assessment of the XPCT data.
-
3. Unfolding procedure: The “Straighten” function in ImageJ was used to transform the curved glomerular layer into a linear format while maintaining spatial resolution and anatomical integrity.
-
4. 3D reconstruction: This process was repeated for all slices and the resulting straightened slices were merged to create a 3D unfolded volume of the glomerular layer.
-
5. Post–processing enhancement: To improve the visibility of the glomeruli, an averaged Z–projection of 10 consecutive straightened slices (ImageJ (Fiji) standard function) was used, which increased the contrast and signal– to–noise ratio in the final image.
The reconstructed OB volumes were spatially oriented according to common neuroanatomical approaches to ensure anatomical alignment. The x– and y–axes corresponded to the transverse plane, and the z–axis to the longitudinal axis of the OB. Based on this orientation, a virtual unfolding procedure was applied to align the curved glomerular layer. To achieve this, the original volume data were reparameterized into a new curvilinear coordinate system (u, v, z).
The u coordinate: represents the arc length along the glomerular layer contour, which has been transformed into a linear axis in the transverse plane. Anatomically, this axis lies in the original x–y plane and reflects the curvature of the glomerular surface. The v coordinate: denotes the local thickness of the glomerular layer, measured orthogonally to the contour at each point. Like u coordinate, it is located in the transverse plane of OB slice and provides information about the glomerular layer depth. Z–coordinate: maintains the original longitudinal orientation of the OB, perpendicular to the OB cross–sections. This ensures structural continuity along the anatomical z–axis. The reparameterization procedure allows for alignment of the glomerular layer while preserving its 3D microarchitecture, allowing for improved quantitative and comparative analysis across the entire OB volume.
Histological processing and immunohistochemistry
After computed tomography using XPCT, paraffin–embedded OB samples were cut into 6 μm thick sections using a rotary microtome. Sections were mounted on positively charged glass slides and immunohistochemical analysis was performed using standard protocols including deparaffinization in xylene, epitope retrieval by heating in citrate buffer (pH 6.0), blocking endogenous peroxidase activity with 3% hydrogen peroxide, incubation with primary antibodies: neuron–specific β–III–tubulin (dilution 1:500, Thermo Fisher Scientific) and PGP9.5 (dilution 1:300, Thermo Fisher Scientific), detection using the UltraVision Quanto detection system (Thermo Fisher Scientific) and counterstaining with hematoxylin, dehydration and coverslipping. Immunohistochemically stained sections were examined and digitized using a Zeiss A1 light microscope equipped with a digital camera. The resulting images were processed and analyzed using ImageJ software (NIH, version 1.53c) to identify and characterize glomerular structures.
Results
We developed a workflow, shown in Fig. 1, that involves virtual unwrapping of human OB tissue in 3D, allowing for improved visualization of the complex OB morphology. Transforming the OB cylindrical layers into a flattened image allowed for more accurate identification of the glomerular layer and segmentation of individual glomeruli. This approach provided a clearer and more intuitive visualization of the spatial organization of the glomeruli, significantly improving interpretability compared to the original curved geometry of the raw volume data.
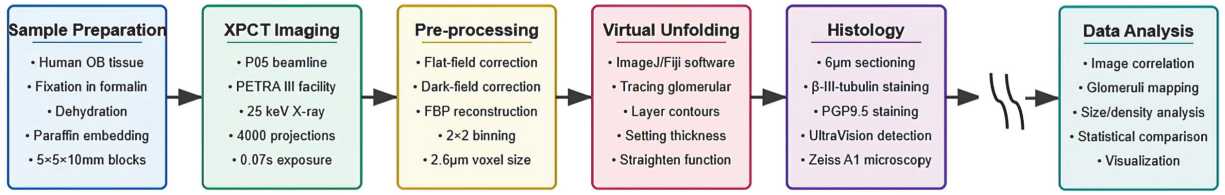
Fig. 1. Schematic representation of the XPCT imaging and virtual unfolding study workflow of human OB. The process proceeds from left to right: 1) Specimen preparation (human OB tissue, formalin fixed and paraffin embedded); 2) XPCT imaging (PETRA III beamline P05 using 25 keV X–rays); 3) Image pre–processing (flat/darkfield correction, artifact suppression and tomographic reconstruction with 3.2 μm voxel size); 4) Virtual unfolding (ImageJ/Fiji, glomerular layer tracing); 5) Histology and immunohistochemistry (sectioning, staining and microscopy); 6) Data analysis (correlation, mapping and statistical comparison) is not presented in this research
As shown in Fig. 1, our workflow begins with specimen preparation followed by XPCT imaging of paraffin–embedded OB tissue, producing high–resolution volume datasets with sufficient contrast to clearly differentiate key OB anatomical structures, including OB layers and cells. Following image acquisition, the reconstructed volumes were pre–processed to enhance the definition of tissue boundaries. We used 3D imaging to digitally unwrap the curved OB surface, producing flattened images of the glomerular layer. This transformation allowed consistent determination of layer thickness, tracing of glomeruli, and spatial comparison across the specimen. Histological and immunohistochemical staining of OB sections allowed cross–validation of XPCT–derived features. Our workflow, designed to transform complex 3D volume data into anatomically meaningful 2D maps, can lay the foundation for microstructural segmentation of the OB. This transformation opens up possibilities for future applications of convolutional neural networks (CNNs) for automated analysis, disease diagnosis, and integration into human brain atlases. The expanded data format supports the identification of spatial patterns, assessment of regional variability, and broader statistical analyses. However, since this proof–of– concept study was conducted on a single postmortem specimen, DL–based segmentation and large–scale statistical analysis remain outside the scope of this study.
Fig. 2 a shows a schematic representation of the human brain, highlighting the OB as bilateral structures located on the ventral surface of the frontal lobe (shown in green). The OBs are the main sensory processing centers for olfactory information in the brain. They receive direct projections from the olfactory epithelium and relay information to the overlying cortex. Fig. 2 b illustrates the capabilities of XPCT, revealing the layered cytoarchitecture of the OBs with high resolution and contrast. In particular, the non–destructive nature of XPCT imaging allows visualization of fine structural details such as glomeruli and lamellar borders without the need for physical sectioning or contrast agents. Fig. 2 c shows the corresponding immunohistology sections confirming the XPCT findings. All main layers of the OB, including the glomerular, outer plexiform, mitral, inner plexiform, and granular cell layers, are identified and correspond to the features seen on XPCT. Notably, the glomerular layer shows a clear concentric organization in both modes, highlighting the anatomical accuracy of our imaging approach.
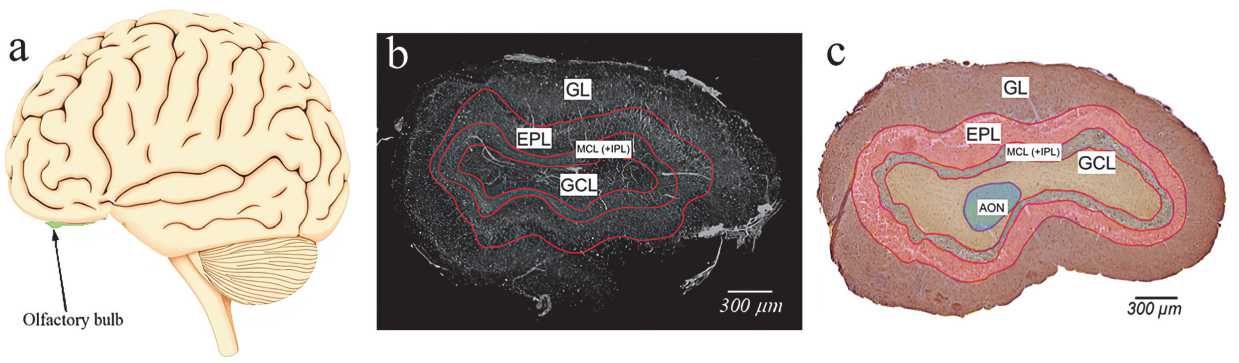
Fig. 2. (a) Schematic representation of the human brain with olfactory bulbs (bilateral green structures); (b) grayscale XPCT image of OB section (axial plane), (c) immunohistochemical staining with antibodies to neuron–specific β–III–tubulin in human OB section (axial plane) with multilayered cellular architecture: glomerular layer (GL), outer plexiform layer (EPL), mitral cell layer and inner plexiform layer (MCL (+IPL)), granule cell layer (GL), anterior olfactory nucleus (AON)
Fig. 3 a shows the glomerular structures observed by XPCT, which correspond well with those detected by immunohistochemistry (Fig. 3 b ). These rounded morphological units, ranging in diameter from 65.2 to 112.8 μm, were clearly delineated in the XPCT data, providing a basis for measuring their size and distribution. Unlike traditional histology, XPCT preserves the full 3D shape and spatial structure of the OB, avoiding the distortions often introduced by tissue slicing and staining. Fig. 2 and 3 demonstrate the ability of XPCT to reveal anatomical features that are typically only visible with staining, while maintaining a broader 3D context. This is particularly important when studying the olfactory system, where the spatial relationships between structures are critical. The preserved 3D volume also enables advanced processing steps such as virtual unwrapping of the OB surface, mapping of glomerular positions, and preparing data for segmentation, automated analysis, and future computational modelling.
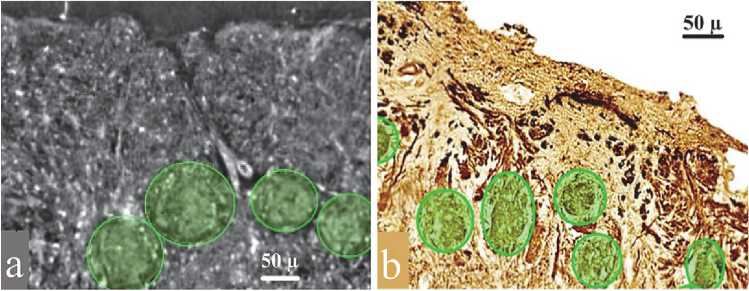
Fig. 3. (a) Part of the glomerular layer of the olfactory bulb, XPCT image. The glomeruli are represented by the oval structures outlined in green. (b) Part of the glomerular layer of the olfactory bulb, immunohistochemical staining with antibodies to neuron– specific β–III–tubulin. The glomeruli are highlighted in green
Fig. 4 illustrates the 3D architecture of a human olfactory bulb specimen and its relevance for computational unfolding. Fig. 4a presents a schematic 3D image of the OB, highlighting its multilayered cellular organization arranged in a geometry approximating nested cylinders. Each layer, such as the glomerular layer, external plexiform layer, granule cell layer, etc., is concentrically aligned around the central axis of the bulb. This cylindrical symmetry is important for interpreting the spatial structure of the OB sample and supports the computational transformation to flattened 2D representations. Fig. 4 b shows the corresponding XPCT volumetric reconstruction, where the tissue microarchitecture is preserved in full 3D without physical sectioning. The spatial orientation of the dataset was anatomically defined, with the x– and y–axes aligned with the transverse plane of the OB and the z–axis corresponding to its longitudinal axis. The nearly cylindrical shape of the specimen simplifies coordinate mapping and is necessary to create anatomically accurate
2D projections of the curved glomerular surface. Schematic and XPCT imaging show that the OB specimen maintains a roughly cylindrical geometry well suited for the subsequent flattening process.
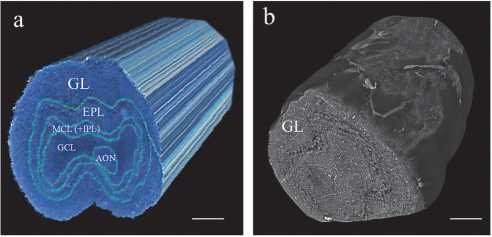
Fig. 4. Three–dimensional visualization of the OB: (a) three–dimensional schematic illustration of the complex multilayered cellular organization in the OB specimen, highlighting the spatial arrangement of OB layers and supporting cells; (b) corresponding volumetric reconstruction XPCT dataset. Scale bar in (a) and (b) is 300 micron
The virtual unfolding method markedly improves expert visual assessment of glomeruli within the OB glomerular layer, enabling detailed morphological analysis that is not achievable in conventional tomographic sections. In the original XPCT sections, only a few glomeruli were visible due to the curvature of the OB surface and limited slice thickness (Fig. 5 a ). The efficiency of expert analysis can be improved by applying an averaged projection of adjacent z–axis sections (ImageJ/Fiji), which helps to visualise additional glomeruli (shown by the dashed circles in Fig. 5 a and the white arrows in the inset). However, without computational flattening, their three–dimensional organisation remains unclear and difficult to interpret. To capture the complete glomerular layer, we manually outlined it on the slice, aligning it with the layer curvature and adjusting the thickness to match its physical extent in the XPCT data (yellow strip in Fig. 5 b ). ImageJ's straighten tool then flattened the curved layer (Fig. 5 c ). This process was repeated for each section along the longitudinal axis of the OB, and the straightened sections were assembled into a continuous 3D unwrapped volume. Fig. 5d illustrates the top view of the unfolded volume OB shown in Fig. 5 c . An averaged projection was applied to the ten sections along the z–axis (Fig. 5 d ), revealing the multiple glomeruli as discrete rounded structures (white arrows), with markedly improved clarity of spatial distribution and morphology compared to the original volumes. In the XPCT dataset (see Fig. 5 a and 5 b ), the cross–section is defined by the x– and y–axes, and the z–axis corresponds to the longitudinal direction of the OB. In the unwrapped volume (Fig. 5 c and 5 d ), a new curvilinear coordinate system (u, v, z) was introduced to reflect the transformed geometry. Axis u follows the straightened contour of the glomerular layer; axis v extends orthogonally to the layer, reflecting its thickness; and z preserves the original longitudinal orientation of the bulb.
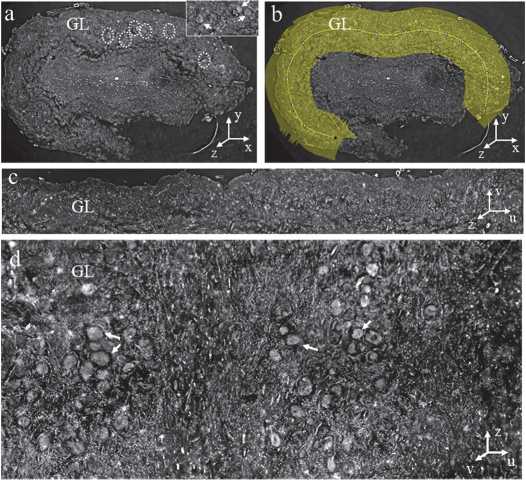
Fig. 5. Unfolding procedure of the glomerular layer. (a) Representative cross–sectional image of the OB obtained with XPCT. The dotted circles indicate the position of the glomeruli in the glomerular layer (GL). In the inset in the upper right corner, the glomeruli are highlighted with white arrows. (b) In the cross–section, a yellow line was manually drawn along the contour of the glomerular layer. The thickness parameter was adjusted according to the actual layer thickness observed in the XPCT data. (c) Result of the straightening process, during which the curved glomerular layer was transformed into a linear representation. (d) Multiple glomeruli (highlighted by white arrows) are visible in the unfolded view after compiling the straightened sections into a 3D volume.
Fig. (d) is a projection of the top view of the unfolded volume OB shown in (c)
As a proof of concept, this work demonstrates the feasibility and value of combining XPCT with virtual unwrapping for high–precision mapping of the human OB microarchitecture. Our approach not only improves visualization but also enables detailed structural assessment of the glomerular layer throughout the OB. By preserving anatomical orientation while transforming a complex 3D surface into an analyzable 2D format, our method facilitates accurate morphometric analysis and supports future large–scale data–driven studies. Based on postmortem tissue samples, this concept lays the foundation for studying disease–associated structural changes and may be useful for future studies focusing on the involvement of the olfactory system in neurodegenerative and infectious diseases.
Discussion
In this study, we present an approach combining XPCT with computational unwrapping to enable high–resolution 3D imaging and quantitative analysis of the human OB. This method addresses key limitations of traditional imaging techniques related to capturing the full spatial organization of the glomerular layer, a structurally complex and curved surface critical for early olfactory processing.
Applying XPCT to postmortem human OB tissue provided sufficient contrast to visualize soft tissue microarchitecture, including individual olfactory glomeruli, without the need for staining or sectioning. However, due to the natural curvature of the OB and the limited thickness of individual sections, traditional cross–sectioning provided only a partial view of glomerular structures. To overcome this, we developed a virtual unwrapping method that straightens the curved glomerular layer and projects it onto a regular rectilinear coordinate system. This transformation preserves anatomical integrity, allowing for improved spatial and morphometric analysis. Importantly, the human OB does not have a simple cylindrical geometry; instead, it has a more complex ovoid shape with variable curvature along both the mediolateral and rostrocaudal axes. Moreover, the shape of the OB appears to change with age in healthy individuals and may be associated with certain causes of olfactory disorders, such as the higher incidence of irregular shapes in post– traumatic olfactory loss [19]. Thus, nonlinear mapping that takes into account the anatomical asymmetry and curvature of the bulb was required for accurate unfolding. Two well–known conformal parameterization methods, such as least– squares conformal maps (LSCM) and angle–based smoothing (ABF), combined with XPCT, can provide a robust computational platform for virtual unfolding, allowing non–invasive exploration of the internal structure of the specimen [20]. The expanded volumes revealed numerous glomeruli throughout the OB surface, allowing for quantitative assessment of their number, size, shape, and distribution in 3D space, parameters that are difficult to accurately assess in native tomographic or histological images. Moreover, by transforming the data into a 2D representation, our method facilitates statistical comparisons between samples and integration with machine learning systems for automated feature detection [21, 22].
It is important to note that although our study is based on postmortem samples, the methods developed here are potentially useful for retrospective analysis of olfactory pathology. The OB is a known early target in several neurodegenerative diseases, including Parkinson's disease and Alzheimer's disease [14–16,23–25], as well as in COVID– 19–associated anosmia [26, 27]. The ability to systematically map and quantify structural changes in the glomerular layer may contribute to a better understanding of disease–specific patterns of olfactory impairment. However, this study has limitations. As a validation study, it was applied to a limited number of samples and does not yet reflect interindividual variability or pathological changes [28, 29]. Furthermore, although XPCT provides high contrast and resolution of soft tissues, it remains a synchrotron radiation–based technique, which limits its availability for routine pathological studies. Future studies may include adapting the unwrapping process to other imaging modalities or extending its application to larger sample groups, including diseased tissues.
Finally, we demonstrate the feasibility of combining XPCT with computational unwrapping to obtain anatomically accurate, high–resolution mapping of the human OB. This concept opens up new possibilities for structural analysis of the olfactory system and lays the foundation for future studies exploring the role of olfactory architecture in health and disease.
Conclusion
We present a novel approach combining XPCT with computational unwrapping to obtain anatomically accurate, high– resolution mapping of the human OB. This method transforms the curved glomerular layer of the OB into a 3D unwrapped image that preserves spatial relationships and microarchitecture. Unlike traditional 2D histology or tomographic slices, our unwrapped maps preserve volumetric data within a rectilinear framework. This enables accurate glomerular quantification and facilitates statistical analysis and machine learning integration. Although this approach has only been demonstrated in a limited number of postmortem samples, it can reveal subtle structural details that are critical for understanding olfactory dysfunction and early pathology in neurodegenerative diseases such as Parkinson’s and Alzheimer’s disease, as well as in cases of SARS–CoV–2–associated anosmia. Expanding this concept to larger sample number and groups and more accessible imaging modalities may advance OB pathology research and improve diagnostics. Overall, our approach provides a powerful tool for comprehensive, spatially coherent analysis of the structure, function, and pathology of the human OB.
Acknowledgments
Fabian Wilde and Elena Longo for the assistance with the measurements at the P05 beamline of the synchrotron facility PETRA III, DESY operated by the Helmholtz–Zentrum Hereon.
The authors used ChatGPT, developed by OpenAI, to improve the clarity of the manuscript's language. The authors reviewed and edited the content to ensure accuracy and integrity. The final manuscript represents their own work and intellectual contribution.
