Highly Selective Digital Filter Bank through Linear Variation of Stopband Attenuation in Multirate Processing by Sample Modification Technique

Author: Ganekanti Hemanja, K. Satya Prasad, P. Venkata Subbaiah
Journal: International Journal of Image, Graphics and Signal Processing(IJIGSP) @ijigsp
Article in issue: 8 vol.5, 2013.
Free access
Digital spectral analysis is the significant factor of consideration by which numerous applications importantly need of effective reception and analysis of signals, that is, the reception of signals is needed with improved spectral characteristics and simple techniques. To meet the above requirements, a novel technique is proposed in digital bandpass filter bank, supported by 'Modified Kaiser window' based Finite impulse response method in Multirate processing followed by Fast Fourier transform. The novel technique influences largely in the proposed method in such a way that it involves the modification of samples of input signal for deriving the advantages in respect of selectivity, stopband attenuation, peak output and constant width cum sharp rise of response apart from smooth spectral output when compared with existing methods. Further, reduction in computational complexity and hardware complexity are the additional features of the proposed method, henceforth; its spectral output is suitable in many of real time applications and moreover advantageous in digital hearing aids. The simulation results are drawn and its performance is compared to elucidate the advantages in the proposed method.
Multirate processing, Heterodyning, Bandpass filtering, Modified Kaiser window, Finally modified input samples
Short address: https://sciup.org/15013018
IDR: 15013018
Text of the scientific article Highly Selective Digital Filter Bank through Linear Variation of Stopband Attenuation in Multirate Processing by Sample Modification Technique
Several applications require effective spectral reception by which the signal processing at the succeeding stages and implementation of hardware becomes easier. For this purpose, amplitude and frequency components of received signal must be detected to much of accuracy when the signals are to be received with maximum peak response, free from adjacent channel interference and better stopband attenuation. Moreover, the computational complexity and hardware complexity should be less. To derive the above advantages, this paper proposes a novel approach of sample modification technique in Multirate digital filter bank [1,2] followed by efficient Fast Fourier transform (FFT) technique. Because of specified advantages in the proposed method of spectral analysis it is better suited in various applications.
Further, the proposed spectral response becomes more selective for the reception of vestigial modulated side band sequences because the proposed method of spectral response can able to extract the low frequency components which attached to the adjacent frequency band of assumed passband. These low frequency components are highly essential to keep with important information without which the received signal creates noise in the reception system. Extraction of such frequency components is difficult by existing filter bank response of higher stopband attenuation. This disadvantage can be overcome by the proposed method by having the linear stopband attenuation characteristic. The characteristic serves the purpose of extracting such important information apart from exhibiting high stopband attenuation for undesired input frequencies. There is a scope of possible enhancement in selectivity, lesser adjacent channel interference and smooth response as compared to the results, clarified by authors [3,4,7]. Further, there is a possibility of improvement in peak response and stopband attenuation as compared to the results shown in [5,6,8]. In addition, there is a possible enhancement in spectral response so as to make better suitable for extraction of vestigial modulated side band sequences as compared to the existing method [9] and more over resulting to better image coding gain as compared to existing method [10].
The proposed method uses the novel approach of input sample modification technique which is appended to Modified Kaiser window based Finite impulse response (FIR) type of Multirate digital bandpass filter bank. This filter bank causes for better passband and stopband characteristic and selectivity apart from precise control over phase response. The techniques used in FFT reduce the computational complexity and hardware complexity rather than specified one in the reference [8]. Prior to modification of samples, the input signal is heterodyned with respect to starting frequency of band of interest so that the input band is shifted to lower frequencies starting from ‘0’ Hz. This operation is performed for minimizing the computational complexity. The proposed filter bank separates the input signal band into frequency bands as it forms the basis for a Multichannel compression in hearing aid development [11,12], apart from analysis of spectral components. In addition, each stage of filter bank attains constant width cum sharp rise of response which causes for improvement of selectivity in the spectral output. An important characteristic of linear stopband attenuation is arrived in the spectral output. This feature is more advantageous in hearing aid development for effective extraction of low frequencies of assumed passband resulting to improvement of selectivity. The above merits are arrived in the proposed method without the need of information with regard to stopband frequencies as like in existing method [13]. Further, these merits in the proposed method have lead to improvement in respect of stopband response, constant width cum sharp rise of passband response and less adjacent channel interference as compared to the existing methods [3,4,7] apart from great reduction in computational complexity and further resulting to enhancement in stopband attenuation and peak output response as compared to existing methods [5,6,8]. The improvement in selectivity of spectral output in the proposed method is attained due to linear amplitude variation in stopband attenuation and constant width cum sharp rise of response. This method is particularly verified at lower frequencies with ‘Cosine input function’ as this function represents the real time signals in number of applications. This method is described with the help of analytic equations. The simulation results and performance characteristics of proposed method are drawn to verify the facts.
Kaiser window method [8]. The desired frequency response of bandpass filter (h d (z)) is given as
hd ( z ) = <
Where ‘f p1 ’ is lower passband frequency and ‘f p2 ’ is higher passband frequency .The desired unit sample response is given by h d (n).
hd ( n ) — n n
sin
( (2 n nfr 2)
V F 7
= -( fc 2 - fc l) F
sin
2nnfcA
V F 7
for ••■ n = 0
Where f c1 = f p1 -(df/2), f c2 = f p2 +(df/2) df2 = fp1-fs1, df3 = fs2-fp2
Where ‘df’= min {d f2 , d f3 }, F = Sampling frequency f s1 = Lower stop band frequency f s2 = Upper stop band frequency n = integer
N׀ = Order of the filter
The frequency response of the h d (n) is given by h d (z).
, . . -( N ' - 1)/2
hd ( z ) = z
( N ' - 1)
h, (0) + Z 2 h , ( n )cos(2 nnT )
d n = 1 d
(N '-1)
Where h. (0) + Z 2 h, (n )cos(2n/nT) represents d n=1 d the magnitude response equation, where T=1/F.
B. Design of window
The basic Kaiser window function
' Io ( B )
ak ( n )
= ^ Io ( A )
----for •" n 5 ( N - 1 ) /2
0------- Otherwise
Where ‘A’ is an independent variable empirically
determined by Kaiser.
(
В = A 1
V
2 0.5
2 n )
7 7
II. MATERIALS AND METHODS
A. Design of bandpass filter
This method of approach is arrived through partial modification of designated parameters in the existing
( 0.5 x 2 ) ( 0.5 x 2 ) 2
Io ( x ) = 1 + + —
(1!)2 (2!)2
This series converges rapidly and can be computed up to 25 terms to attain the desired accuracy. While considering the bandpass specifications, where the passband ripple (Ap) and minimum stopband attenuation (As) in decibels are given by
( 1 + dp ) )
Ap=2oiogi0 k^)
As = -20 logjq (ds)
The ‘ds’ and ‘dp’ can be determined as ds = 10 (-0.05 As)
( 10 Ap - 1 )
dp =(100 05 Ap +1)
dp׀ = min(dp,ds)
The actual stopband attenuation is arrived to be,
As = -20log10 (dp')
where dp׀ is the minimum among ‘dp’ and ‘ds’.
The value of ‘A’ is determined from the empirical design equation
ripple and quality of output are attained as compared to the existing methods of reference [6,7,8,13]. This novel approach of filter bank design has brought attractive advantages in the proposed method of filter bank response, which follows.
TABLE 1. Passband and stopband frequencies of proposed method of filter bank
|
Stage No. |
Lower stopband frequency f s1 (Hz) |
Lower passband frequency f p1 (Hz) |
Upper passband frequency f p2 (Hz) |
Upper stopband frequency (f s2 (Hz) |
|
Stage 1 |
0 |
10 |
60 |
70 |
|
Stage 2 |
70 |
80 |
130 |
140 |
|
Stage 3 |
140 |
150 |
200 |
210 |
|
Stage 4 |
210 |
220 |
270 |
280 |
1.2
0.8
0.6
A = ^ 0.5942 ( As - 21)0.4 + 0.7986 ( As - 20) - for - 21 < As < 50
0.1102( As - 8.7) - for - As > 50
0.4
A parameter ‘D’ is determined from the empirical design equation
0.2
First stage response Second stage response Third stage response Fourth stage response
-0.2
0 200
400 600 800 1000 1200 1400
FREQUENCY IN HZ
D = If As - 7.95
к 13.95

for - As ) 21
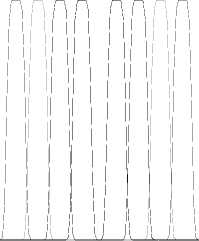
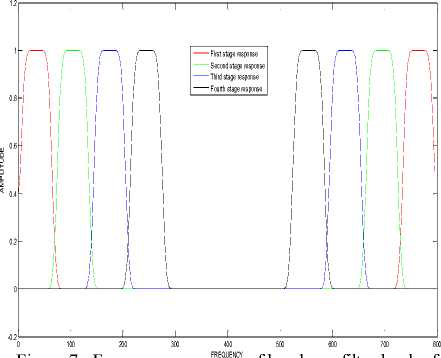
Figure 1. Modified Kaiser window based frequency response of bandpass filter bank
The filter order for the lowest odd value of ‘N׀’ , calculated to be
( F * D )
N1 > -------- + 1
df
The order of the filter increases with increase in the sampling frequency or decrease in the transition width. Finally the unit sample response of the FIR bandpass filter is determined as h (n) = ak (n)(hd (n)) - for - n < (N '-1)/2 (15)
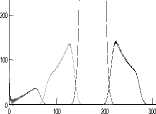
Where a k (n) and h d (n) are window coefficients and desired unit sample response respectively. The frequency response of the filter, that is, the frequency response of h(n) is computed as similar to that of h d (z). The frequency response and the output response of the filter bank are plotted according to Modified Kaiser window approach, as shown in figure 1 and figure 2 respectively. It is observed that a better spectral response with improvement in passband and stopband
First stage response Second stage response Third stage response Fourth stage response
FREQUENCY IN HZ
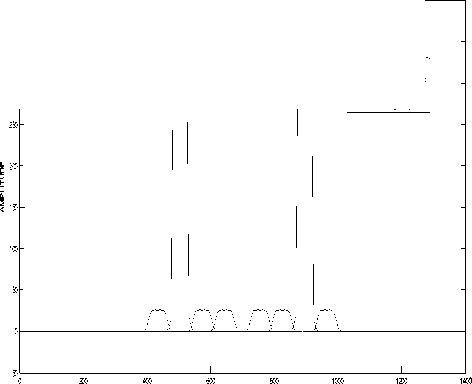
Figure 2. Modified Kaiser window based output response of bandpass filter bank for the input signal band of frequencies from 480 Hz to 530 Hz (With existing method)
-
III. III. PROPOSED METHOD WITH NEW
TECHNIQUE IN MULTIRATE PROCESSING
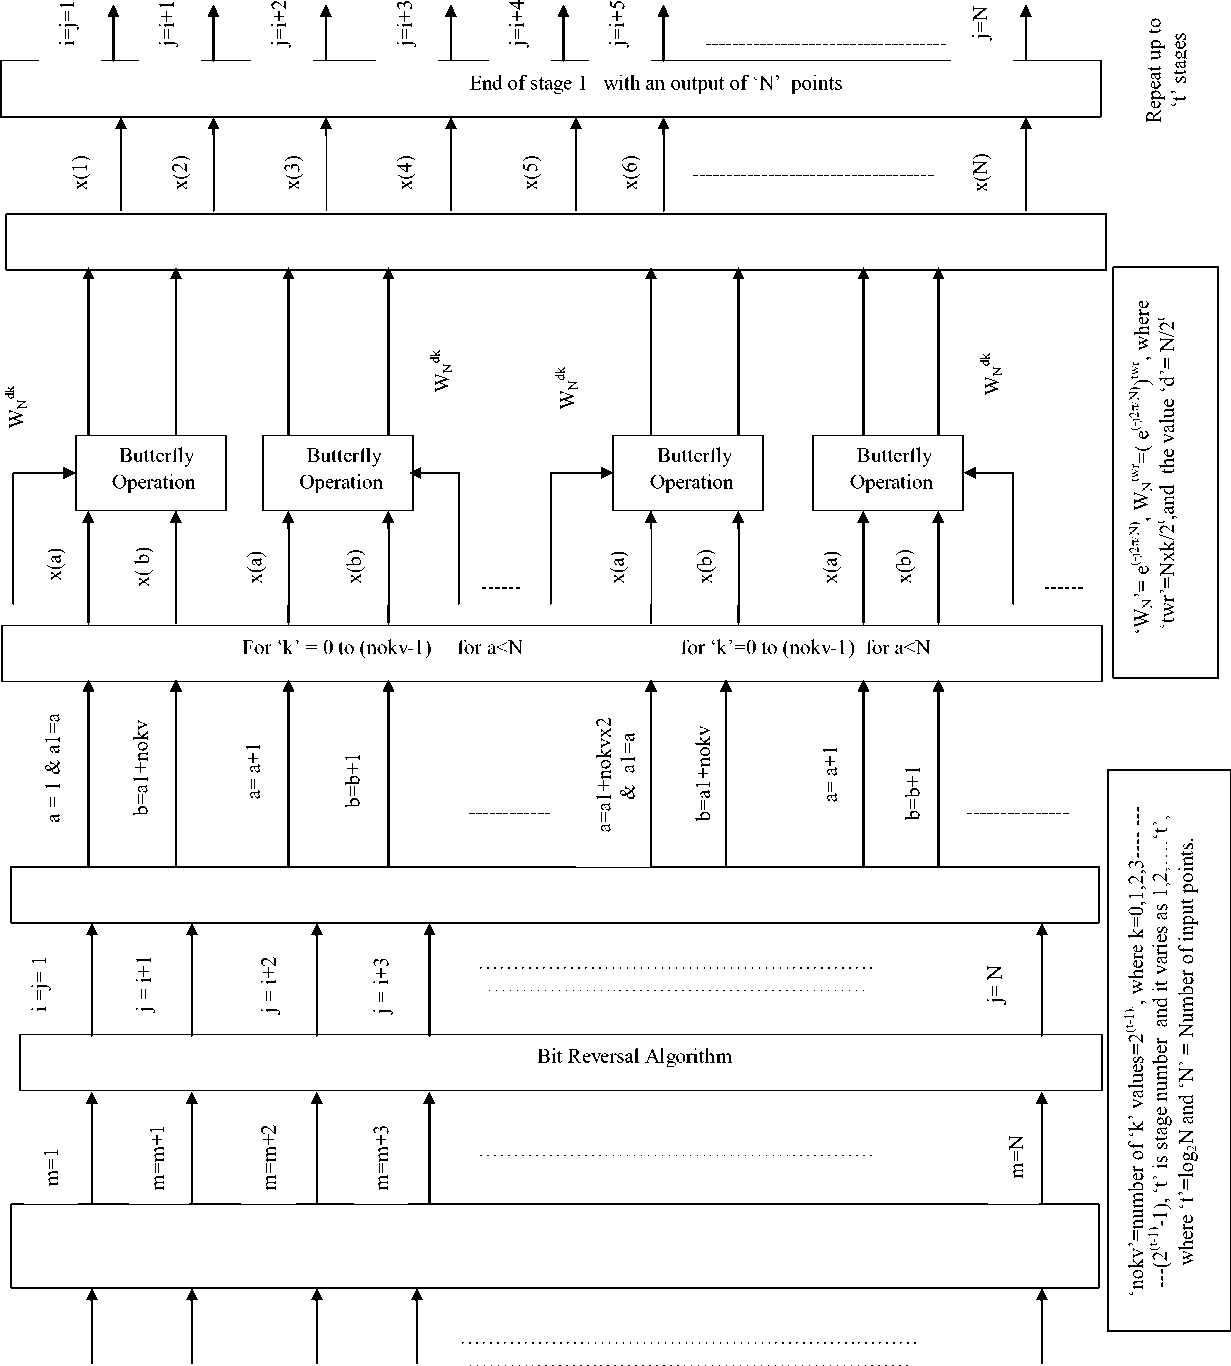
The proposed method is mainly based on novel technique, attached to Modified Kaiser window based FIR bandpass filter bank preceded with heterodyning operation and followed by Fast Fourier transform. The input signal is generated for the band of interest and each sample is multiplied by cos(2πw p ׀nT) in order perform the heterodyning operation, where ‘w p ׀’ is the starting frequency of input band and ‘n’ is the sample number. Now, the heterodyned output (x 1 (n)) is modified by the novel technique so as to result in Finally modified input sequence (x 4 (m)) as shown in figure 3. The intermittent signal conversions at various intermediate stages of the input signal are explained as below.
At first, the biggest value (big) among heterodyned output samples is calculated. Later, an intermediate sequence, ‘x 2 (m)’, is arrived by subtracting every sample of heterodyned output from the value ‘big’ and each result of which is divided by ‘200’. The next form of modified sequence ‘x 3 (m)’ is arrived by adding the corresponding samples of x 1 (m) and x 2 (m). Finally, except for first and third samples, the individual sample value of ‘x 3 (m)’ is doubled. The first sample of ‘x 3 (m)’ is unchanged while dividing the third sample by 0.45, resulting to Finally modified input sequence. Now, the samples of ‘x 4 (m)’ are taken as input to the individual stage of bandpass filter bank and each bandpass filter is designed to meet the desired specifications as shown in table 1. The time domain output of individual stage bandpass filter is obtained by taking the convolution between ‘x 4 (m)’ and unit sample response of individual bandpass filter stage resulting to time domain output sequences such as y 1 ׀(m), y 2 ׀(m), y 3 ׀(m),……..y i ׀(m) as shown in figure 4. The output of individual bandpass filter is rounded to ‘N’ samples by placing zeroes after relative magnitude values at successive intervals of time. The value ‘N’ is equal to a number, 2t, where ‘t’ is an integer such that, the value ‘N’ is next immediate greater value to the number of output samples of bandpass filter. Finally, the frequency response of individual stage of bandpass filter is arrived by performing radix-2 Fast Fourier transform on ‘N’ samples of the filter response as shown in figure 4. The related procedure of Fast Fourier transform in connection with figure 4, is shown in figure 5.
From figure 1, the signal conversions at various points upon input signal can be considered in the form as mentioned below.
x 1 (n) = x(n)(cos(nw p ׀T)) (16)
Where ‘wp׀’ is the starting frequency of input signal band in rad/sec. and x(n) is the input signal, where ‘n’ = 0,1,2,-------(N1-1), Where ‘N1’ is the number of input samples as corresponding to sampling frequency ‘F’. The samples of x1(n) are taken at the decimated sampling frequency such that the decimation factor, ‘D’ = F/F׀, where ‘F׀’ is the decimated sampling frequency.
Let x(nT) be the input signal with number of input samples be ‘N1’. The decimated output of original input signal is taken by using the Interpolation formula as given below
( ^ 1 - 1)
x i (mT y ) = S x i ( nT ) g ( mTy - nT ) (17)
n = 0
Where ‘T’ is the original sampling period and ‘T y ’ is the sampling period of decimated output. ‘n’ and ‘m’ are the sample numbers of original and decimated input signals respectively such that ‘n’ = 0,1,2,-------(N1-1) and ‘m’ =
0,1,2,3--------(M-1), where ‘M’ are number of samples of decimated input signal.
Where g(t) is given as sin (nt / T) / \ g (t) = ( \G G (F 1) = 1
( nt / T )
T ,-I F 1 < F /2
0,- otherwise
Equation (17) provides the fundamental equation for the discrete implementation of sampling rate conversion.
Хд ( m ) = 2{ x g( m )}....., for .....' m ' = 2,4,5,----( M - 1) > (19)
x 4(1) = {x3(1)} x 4(3) = {x 3(3)}/(0.45)
The samples of x4(m) are taken as inputs to the filter bank stages. The time domain output of individual bandpass filter stage is obtained by taking the convolution between x4(m) and Unit sample response of individual stage of bandpass filter such that y^'(m) = x^ (m) * h (m)
У 2' ( m ) = x^ ( m ) * h^ ( m )
yi '( m ) = x 4( m )* hi ( m )
Where h 1 (m), h 2 (m), h 3 (m)……h i (m) are the unit sample responses of individual bandpass filter stages and ‘i’ is the number of bandpass filter stage. Each stage output of filter consists of (N׀+M-1) samples positioned from ‘n’ = 0 to n = (N׀+M-2), where ‘N׀’ is the order of filter and ‘M’ is the number of Finally modified input samples. These samples of filter output are extended to ‘N’ by zero padding the remaining samples from (N׀+M-1) to (N-1), resulted as
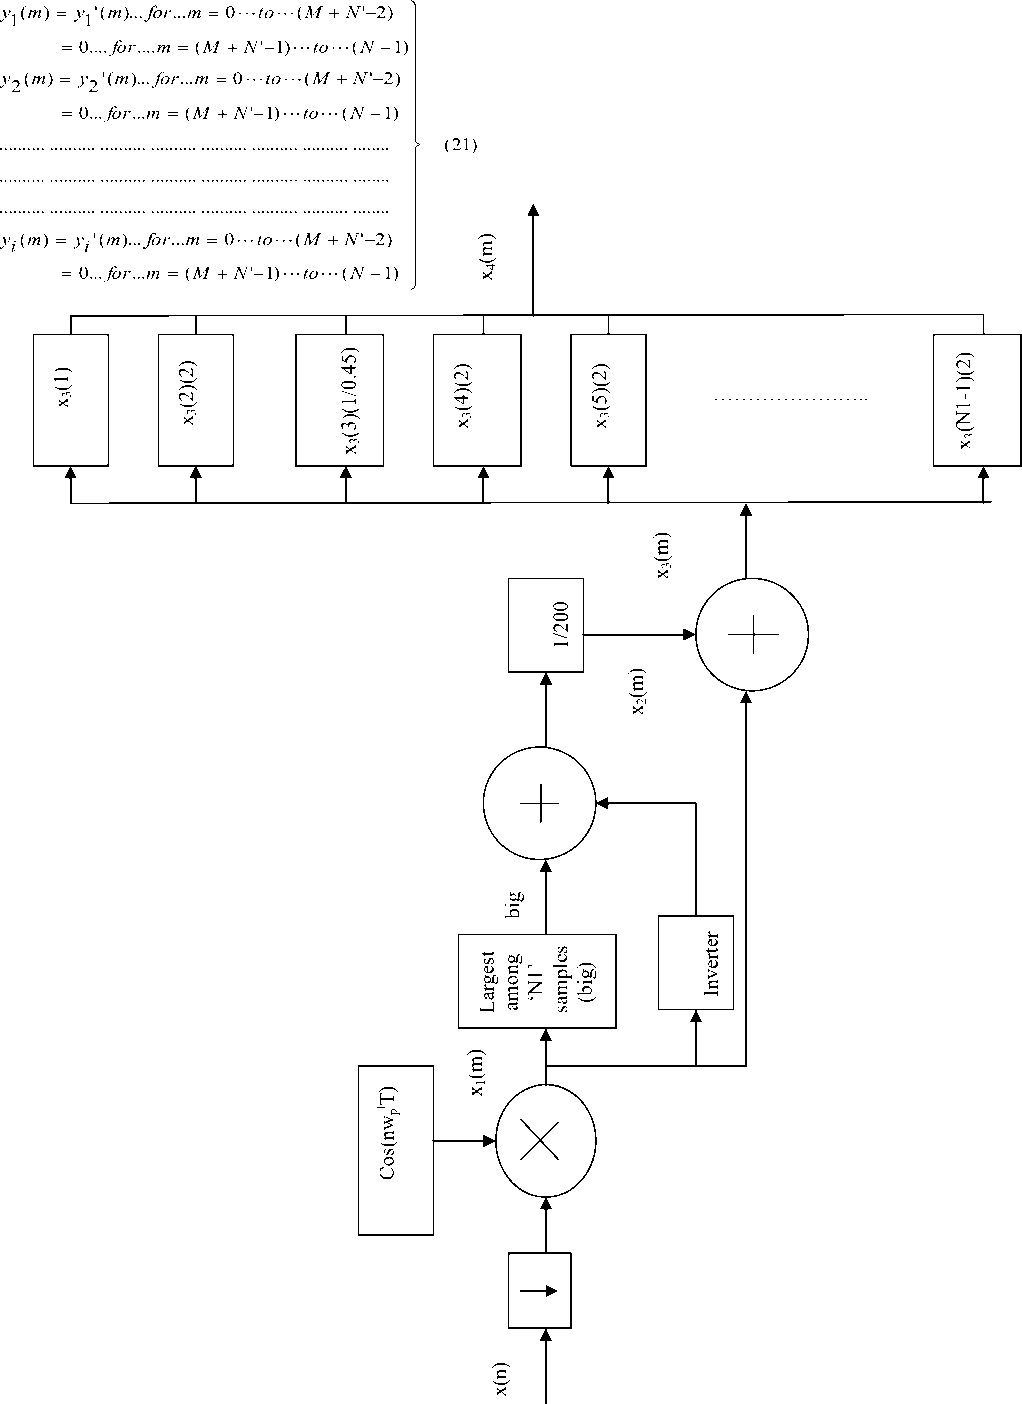
Figure 3. Block diagram of the time domain output of Finally modified Output sequence
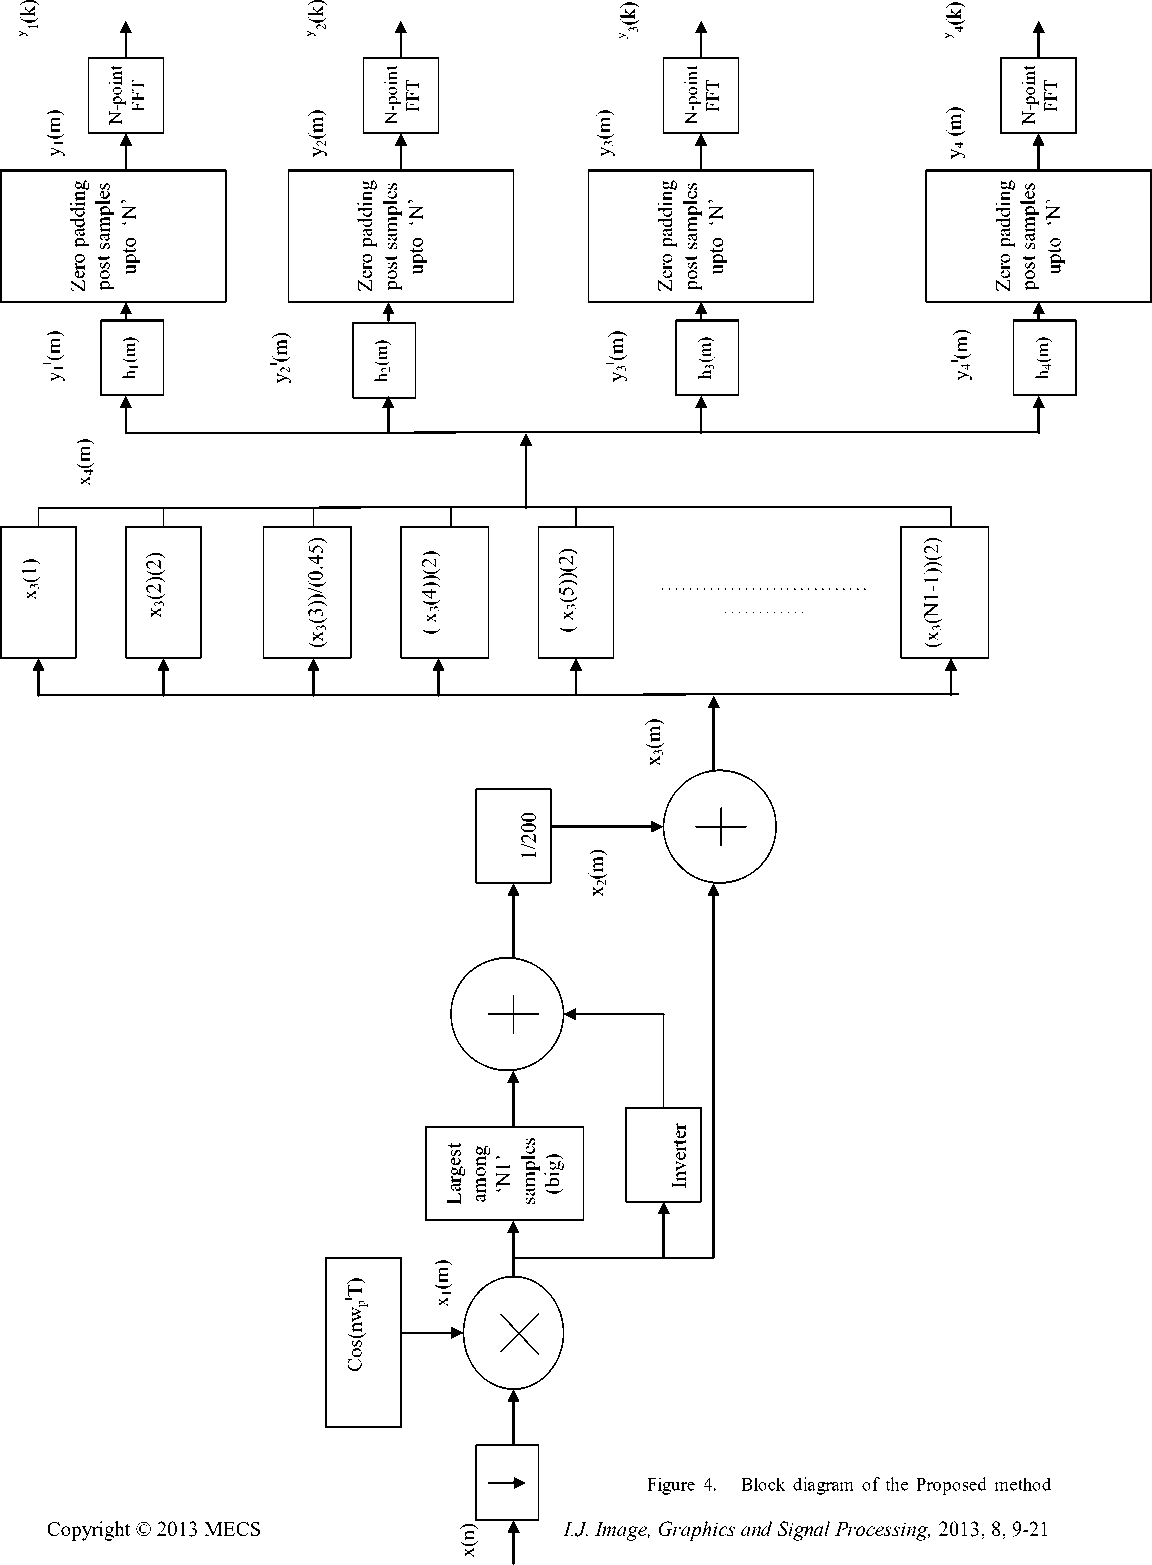
Lastly, an ‘N’ point FFT is carried out on these filter outputs, namely, y 1 (m), y 2 (m),…….y i (m) in order to arrive N-point outputs for ‘i’ stages as y 1 (k), y 2 (k),…….y i (k). The individual FFT stage output is derived according to the equation (22).
(N-1) -2nfTy m y1(k) = ^ y1(m)(e))
(N-1) -2nTy) m y2(k) = m^0 y2(m)(e) у
(N-1) -2nfTy m yi(k) = S yi(m)(e m=0
The method of performing FFT is well described in figure 5 which elite the advantages adhered in reducing the hardware complexity. The features of Fast Fourier transform are hereby as follows.
-
IV. IV. FAST FOURIER TRANSFORM METHOD
For deducing the frequency domain output response, the Fast Fourier transform is exercised on filter bank time domain response. The techniques involved in the FFT operation are such that every parameter which takes place in FFT operation is deduced with respect to stage number because of which the hardware complexity becomes lesser. The number of stages in FFT operation is dependent upon the number points (N) upon which FFT is to performed. The number of output points of filter bank is rounded to ‘N’ such that its value should be equal to 2t, where ‘t’ is an integer. The FFT is of In-place radix-2 ‘Decimation in time’ algorithm whose methodology is shown in Figure 5. This type of FFT minimizes the computations because of which the proposed output response is achieved with lesser computational complexity.
-
V. RESULTS AND DISCUSSION
The proposed method of spectral analysis is implemented for the input frequency band between 400 Hz and 680 Hz and further divided this band into four stages. The input signal is considered over a band of frequencies from 410 Hz to 670 Hz so that the sampling frequency becomes (2)(700) = 1400 Hz. After heterodyning operation, this sampling frequency is reduced to 800 Hz by a decimation factor ‘D’ such that the value ‘D’ becomes (1400/800). This decimated sampling frequency is so chosen to result in ‘Alias free’ for the frequency modified input signal. The bandwidth for each stage of input is taken as 50 Hz as such the four input frequency bands which are considered to be 410 Hz - 460 Hz, 480 Hz - 530 Hz, 550 Hz - 600 Hz and
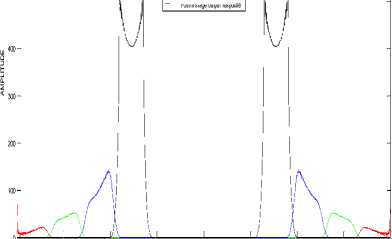
620 Hz - 670 Hz respectively. The selected band of input frequencies are received primarily by four stage bandpass filter bank whose specifications of passband and stopband frequencies of individual stage are mentioned in table 1. The filter bank is designed from 0 Hz to 280 Hz for the assumed input signal band, as the input frequency band is shifted correspondingly from 10 Hz to 270 Hz. As a result of constructing each stage of filter bank with Modified Kaiser window based FIR design approach, the frequency response and output response of individual filter are arrived as shown in figure 1 and figure 2 with better passband and stopband characteristic as compared to the existing methods [6,7,8,13], where passband ripple and stopband attenuation are assumed as 0.5 dB and 35 dB respectively. Unlike the method of figure 2, other existing method [8] is simulated by taking FFT output for the original input frequency band as shown in figure 6 and corresponding to these existing methods the variation of design parameters are shown from table 2 to table 5. Even in both the responses of figure 2 and figure 6, the output response needs to be enhanced in respect of constant width cum sharp rise of response and stopband attenuation in order to achieve minimum adjacent channel interference. To overcome the above disadvantages and to further extend the advantages, this proposed method of spectral analysis serves more capable. Within the lines of description, the proposed method of filter bank frequency response is arrived as shown in figure 7 in order to witness the cause for obtaining the merits such as smooth response and better selectivity. In addition, the time domain output response of individual stage of filter bank is obtained as shown in figure 8. Finally, the output frequency domain response is attained by taking FFT output on individual time domain response of bandpass filter stage as shown from figure 9 to figure 12, where each response is arrived for the selected band of input frequencies. Further, the values of spectral parameters of proposed method are mentioned in table 6 and table 7.
0 500 1000 1500 2000 2500
FREQUENCY
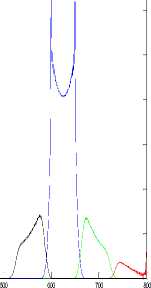
Figure 6. Fast Fourier Transform Output for the input band of frequencies from 480 Hz to 530 Hz
From these results, it can be concluded that the proposed method of spectral output at each stage has been witnessed with better simulated characteristics in respect of high selectivity, less adjacent channel interference and smooth response as compared to existing methods [3,4,7] and more peak response, better stopband attenuation as compared to existing methods [5,6,8] respectively. A characteristic of linear amplitude variation in stopband is the highlight in achievements and this feature is resulted in high selectivity because such characteristic can faithfully extract the low frequency components of selected passband attached to side bands of assumed passband and more over created better attenuation at stopband frequencies. Therefore, this functionality is well supportive for extracting the vestigial sideband modulated sequences effectively when compared with existing method [9] so as to make better suitable in Multicarrier applications. In addition, for the reason of being prescribed vanishing moments adjacent to passband and for the cause of arrival of the output with less hardware complexity than existing method [13], this type of spectral output has become useful in deriving better gain rather than the existing method [10] in order to work extremely well with image coding. Unlike in existing method [13], the hardware complexity became lesser in the proposed method because the proposed method is carried out with no information pertaining to stopband frequencies. Incorporating the above mentioned techniques, the proposed method is implemented in MATLAB-7.01 and results are verified with the facts. The computational complexity is also utmost form of concern for designing a particular method of spectral analysis. As the computational complexity is directly related to the design parameters such as number of input samples, sampling frequency, number of output frequency points and filter order, the computations became lesser and optimally suitable to any real time application because, the proposed method of filter bank design is done at minimum possible values of these parameters as similar to existing method [13]. Thus, with the arrival of less computational complexity and the involvement of salient techniques in the proposed method, this method greatly minimizes the hardware complexity besides increasing the system accuracy. Because of above reasons, the proposed method of spectral analysis became useful in various real time applications especially in digital hearing aids.
TABLE 3. Amplitude response of the existing method of Fast Fourier transform for the input signal band of frequencies from 480 Hz to 530 Hz (As per figure 6.)
|
S.NO. |
Input frequency band (Hz) |
Normalised Amplitude |
|
1 |
410 – 460 |
0.193 |
|
2 |
480 – 530 |
1 |
|
3 |
550 - 600 |
0.2 |
|
4 |
620 -670 |
0.129 |
response ass
.
proposed method (using Modified Kaiser window)
First stage output response Second stage output response Third stage response
Fourth stage output response

-10
-20
TABLE 2. Amplitude response of the existing method of filter bank for the input signal band of frequencies from 480 Hz to 530 Hz (Using Modified Kaiser window)(As per figure 2.)
|
S.NO. |
Input frequency band (Hz) |
Normalised Amplitude |
|
1 |
410 – 460 |
0.104 |
|
2 |
480 – 530 |
1 |
|
3 |
550 - 600 |
0.104 |
|
4 |
620 -670 |
0.104 |
0 0.5 1 1.5 2 2.5 3
Figure 8. Time domain respo TIM n E se of frequency shifted filter bank for the input band of frequencies from 410 Hz to 460 Hz of proposed method
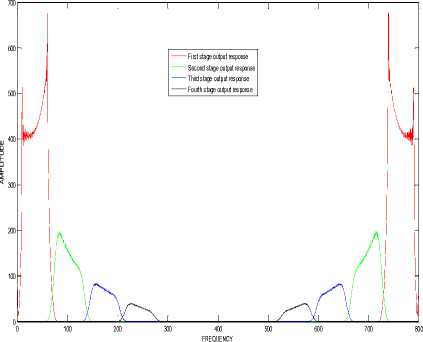
Figure 9. Output response of proposed method for the input band of frequencies from 410 Hz to 460 Hz

First stage output response Second stage output response Third stage output response Fourth stage output response
FREQUENCY
Figure 11. Output response of proposed method for the input
band of frequencies from 550 Hz to 600 Hz
700 : т । т : т : т :
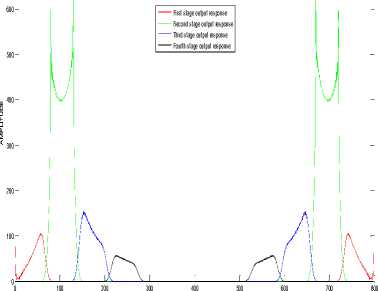
Figure 10. Output response of FR p EQU r EN o CY posed method for the input band of frequencies from 480 Hz to 530 Hz
First stage output response Second stage output response Third stage output response Fourth stage output response
FREQUENCY
Figure 12. Output response of proposed method for the input band of frequencies from 620 Hz to 670 Hz
TABLE 4. Values of filter parameters as per simulation results of figure 2 for the input signal band of frequencies from 480 Hz to 530 Hz (using Modified Kaiser window)
|
S.No. |
Input frequency band (Hz) |
Assumed passband and stopband frequencies (Hz) |
Simulated results of passband and stopband frequencies (Hz) |
Filter order |
Passband and stopband attenuation of output response (dB) (As Per figure 2.) |
|
1 |
410 - 460 |
f s1 = 400 f p1 = 410 f p2 = 460 f s2 = 470 |
f s1 = 400 f p1 = 410 f p2 = 460 f s2 = 470 |
283 |
19.66 |
|
2 |
480 - 530 |
f s1 = 470 f p1 = 480 f p2 = 530 f s2 = 540 |
f s1 = 470 f p1 = 480 f p2 = 530 f s2 = 540 |
283 |
0 |
|
3 |
550 - 600 |
f s1 = 540 f p1 = 550 f p2 = 600 f s2 = 610 |
f s1 = 540 f p1 = 550 f p2 = 600 f s2 = 610 |
283 |
19.66 |
|
4 |
620 - 670 |
f s1 = 610 f p1 = 620 f p2 = 670 f s2 = 680 |
f s1 = 610 f p1 = 620 f p2 = 670 f s2 = 680 |
283 |
19.66 |
TABLE 5. Values of parameters as per simulation results of existing method of Fast Fourier transform
|
S.No |
Input frequency band (Hz) |
Assumed Pass band and stopband frequencies (Hz) |
Simulated results of pass band and stop band frequencies (Hz) |
Passband and Stop band attenuation of output response (dB) (As per figure 6.) |
|
1 |
410 -460 |
f s1 =400 f p1 =410 f p2 =460 f s2 =470 |
f s1 =400 f p1 =410 f p2 =460 f s2 =470 |
14.33 |
|
2 |
480 – 530 |
f s1 =470 f p1 =480 f p2 =530 f s2 =540 |
f s1 =470 f p1 =480 f p2 =530 f s2 =540 |
0 |
|
3 |
550 – 600 |
f s1 = 540 f p1 =550 f p2 =600 f s2 =610 |
f s1 = 540 f p1 =550 f p2 =600 f s2 =610 |
13.98 |
|
4 |
620 - 670 |
f s1 =610 f p1 =620 f p2 =670 f s2 =680 |
f s1 =610 f p1 =620 f p2 =670 f s2 =680 |
17.79 |
TABLE 6. Amplitude response of the proposed method for the input signal band of frequencies from 410 Hz to 460 Hz (As per figure 9.)
|
S.No |
Input frequency band (Hz) |
Translated band of input frequencies (Hz) |
Normalized Amplitude at passband and Stopband frequencies |
|
1 |
410 – 460 |
10 -60 |
1 |
|
2 |
480 – 530 |
80 – 130 |
0.277 |
|
3 |
550 -600 |
150 - 200 |
0.131 |
|
4 |
620 – 670 |
220 - 270 |
0.058 |
TABLE 7. Values of filter parameters as per the simulation results of proposed method
|
S.No. |
Input frequency band (Hz) |
Assumed passband & stopband Frequencies (Hz) |
Translated band of input frequencies (Hz) |
Simulated results of passband & stopband frequencies (Hz) |
Filter order & pass band ripple (dB) |
passband and stopband attenuation of output response (dB) (As per figure 9.) |
|
1 |
410 – 460 |
fs1=400 fp1=410 fp2=460 fs2=470 |
fs1=0 fp1=10 fp2=60 fs2=70 |
fs1=0 fp1=10 fp2=60 fs2=70 |
163 & 0 |
0 |
|
2 |
480 -530 |
fs1=470 fp1=480 fp2=530 fs2=540 |
fs1=70 fp1=80 fp2=130 fs2=140 |
fs1=70 fp1=80 fp2=130 fs2=140 |
163 & 0 |
11.15 |
|
3 |
550 - 600 |
fs1=540 fp1=550 fp2=600 fs2=610 |
fs1=140 fp1=150 fp2=200 fs2=210 |
fs1=140 fp1=150 fp2=200 fs2=210 |
163 & 0 |
17.65 |
|
4 |
620 - 670 |
fs1=610 fp1=620 fp2=670 fs2=680 |
fs1=210 fp1=220 fp2=270 fs2=280 |
fs1=210 fp1=220 fp2=270 fs2=280 |
163 & 0 |
24.73 |
-
VI. CONCLUSIONS
The simulated results of spectral output are achieved with numerous advantages when compared with results of existing methods. It is verified that the proposed method has brought attractive advantages in respect of high selectivity, peak response, constant width cum sharp rise of response and stopband attenuation in addition to advantages assured rather with ‘Modified Kaiser window’ in respect of better passband and stopband ripple and smooth response as compared to the existing methods specified. An improvement in selectivity of spectral output is worthy of importance because a linear amplitude variation in stopband is arrived at the cost of only input sample modification and without the need of further information pertaining to stopband frequencies. In addition, a better reduction in computational complexity and hardware complexity can be achieved and so the proposed method of spectral output is suitable for any real time application as it takes optimal time for computations and especially draw more advantages in digital hearing aid applications. Because of above merits the proposed method can able to bring attractive advantages with regard to compression techniques and hearing loss compensation. Apart from these advantages, the features of the spectral output and methodology could able to draw advantages in Multicarrier applications and Image coding. Thus the overall performance of the proposed method of spectral output is improved in respect of spectral parameters through which the advantages in various real time applications can be met as per the results published in figures and tables.
References Highly Selective Digital Filter Bank through Linear Variation of Stopband Attenuation in Multirate Processing by Sample Modification Technique
- R.E. Crochiere and I.R. Rabiner. Multirate Digital Signal Processing, 1983, Prentice-Hall Inc.
- Douglas F. Elliot. A Hand book of Digital Signal Processing, Academic press, 1987.
- Robert W Bauml and Wolfgang sorgel. Uniform polyphase filter banks for use in hearing aids: Design and Constraints, 16th European Signal Processing Conference (EUSIPCO-2008), 2008.
- Aditya Goel. Design of multichannel filter banks for subband coding of audio signals for multirate signal processing techniques, SPIE publications, 2007.
- Jovanovic-Dolecek G. Multirate Systems: Design and Application, Idea Group Publishers, 2002.
- Robert Brennum and Todd Schneider. A flexible filter bank structure for Extensive signal manipulations in Digital hearing aids, O-7803-4455-3/98/5 10:00(c),IEEE. 1998.
- Ricky Setiawan, Victor Putra Lesmana and Bah-Hwee-Gwee. Design and Implementation of a low Power FIR filter bank, Journal of The institution of Engineers, Singapore, 2005, Vol. 45, Issue 5.
- David J. Defatta, Joseph C. Lucas and William S. Hodgkiss. Digital Signal Processing : A System Design Approach, John Wiley and Sons.
- Behrouz Farhang – Boroujeny and Chung Him (George) Yuen. Cosine Modulated and Offset QAM Filter bank Multicarrier techniques: A Continuous – Time Prospect, EURASIP Journal on Advances in Signal Processing Volume 2010, 2010, Article ID 165654.
- Adams M.D. and Xu D. Optimal design of high performance seperable wavelet filter banks for image coding, Elsevier journal article, 2010, vol.90, ISSN 0165-1684.
- T. Schmeider and R.L. Brennan, A Multichannel Compression Strategy for a Digital hearing Aid. proc, IC ASSP-97. 1997, Munich Germany, pp. 411-415.
- D.Y. Pan. A Tutorial on MPEG Audio Compression, IEEE Multimedia Magazine Summer, 1995, pp. 60-74.
- G. Hemanja, Dr. k. Satya Prasad and Dr. P. Venkata Subbaiah. Efficient Spectral Analysis Through Effective Reduction of Adjacent Channel Interference in Multirate Processing, SIGNAL PROCESSING: AN INTERNATIONAL JOURNAL (SPIJ), 2012, VOLUME 6, ISSUE 1.
