House Price Prediction Modeling Using Machine Learning

Author: M. Thamarai, S. P. Malarvizhi
Journal: International Journal of Information Engineering and Electronic Business @ijieeb
Article in issue: 2 vol.12, 2020.
Free access
Machine Learning is seeing its growth more rapidly in this decade. Many applications and algorithms evolve in Machine Learning day to day. One such application found in journals is house price prediction. House prices are increasing every year which has necessitated the modeling of house price prediction. These models constructed, help the customers to purchase a house suitable for their need. Proposed work makes use of the attributes or features of the houses such as number of bedrooms available in the house, age of the house, travelling facility from the location, school facility available nearby the houses and Shopping malls available nearby the house location. House availability based on desired features of the house and house price prediction are modeled in the proposed work and the model is constructed for a small town in West Godavari district of Andhrapradesh. The work involves decision tree classification, decision tree regression and multiple linear regression and is implemented using Scikit-Learn Machine Learning Tool.
Decision tree, house price prediction, decision tree regression, multiple linear regression
Short address: https://sciup.org/15017396
IDR: 15017396 | DOI: 10.5815/ijieeb.2020.02.03
Text of the scientific article House Price Prediction Modeling Using Machine Learning
Published Online April 2020 in MECS
Data Mining is extracting knowledge or useful pattern from large databases. Classification is one of the data mining functionalities, employed for finding a model for class attribute which is a function of other attribute values [1].
Decision Tree is a tool, which can be employed for Classification and Prediction. It has a tree shape structure, where each and every internal node represents test on an attribute and the branches out of the node denotes the test outcomes.
-
80% of the known dataset can be used as training set and 20% can be used as test data set. Each record in the dataset denotes X and Y values, where X is a set of attribute values and Y is the class of the record which is the last attribute in the dataset. Using the training set Decision Tree Classifier model is constructed and tested
with test data to identify the accuracy level of the classifier.
Decision Tree formation as shown in fig. 1 employs divide and conquer strategy for splitting the training data into subsets by testing an attribute value. This involves attribute selection measures; the attribute which is to be tested first is the one which is having high information gain. Same splitting process is recursively performed on the subsets derived [2]. The splitting process of a subset ends when all the tuples belong to the same attribute value or when no remaining attributes or instances are left with. Decision Tree formation does not need any basic domain knowledge. It can handle data of high dimensions as well. Decision Tree Classifiers have good accuracy in classification.
Once the Decision Tree is formed, new instances can be classified easily by tracing the tree from root to leaf node. Classification through Decision Tree does not require much computation. Decision Trees are capable of handling both continuous and Categorical type of attributes.
To avoid generation of meaningless and unwanted rules in Decision Trees, tree should not be deeper which results in over fitting. Such a tree with over fitting works more accurate with training data and less accurate with test data. Pre pruning and Post pruning are the techniques used in Decision Tree to reduce the size of the trees and avoid over fitting. In Post Pruning the Decision Tree branches and hence the level (depth) of the tree are reduced after completely building the tree. In Pre Pruning, care is taken to avoid over fitting while building the tree itself.
Decision Trees find its major applications in areas such as medicine, weather, finance, entertainment, sports, etc. Decision Tress can also be used for prediction, data manipulation and handling of missing values. As an example in digital mammography it is used for classifying tumor cells and normal cells [3].
This paper discusses about an application of Decision Tree, for purchasing a house in a city based on attribute values such as transport facilities, number of bed rooms, and availability of schools, shopping facilities and medical facilities.
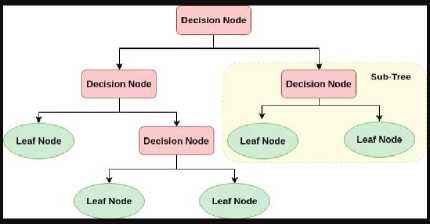
Fig. 1. Decision Tree Structure
child node in the tree (before splitting) [15]. Reduction of larger impurity means the selected split attribute is a better one. Many attribute selection measures exist. The more pronounced ones which lead to better results in terms of accuracy are the following three.
-
A. Information Gain
Expected reduction in entropy obtained by partitioning the examples based on attribute is measured by Information Gain. Attribute selection measure in ID3 algorithm is using information gain.
m
Info = - Z P ( i ) log 2 P ( i ) (1)
i = 1
-
II. Related Work
Patel and Upadhyay [4] have discussed various pruning methods and their features and hence pruning effectiveness is evaluated. They have also measured the accuracy for glass and diabetes dataset, employing WEKA tool, considering various pruning factors.
ID3 algorithm splits attribute based on their entropy. TDIDT algorithm is one which constructs a set of classification rules through the intermediate representation of a decision tree [5,6]. Weka interface [7] is used for testing of data sets by means of a variety of open source machine learning algorithms.
Fan et al [8] has utilized decision tree approach for finding the resale prices of houses based on their significant characteristics. In this paper, hedonic based regression method is employed for identifying the relationship between the prices of the houses and their significant characteristics. Ong et al. [9] and Berry et al. [10] have also used hedonic based regression for house prediction based on significant characteristics.
Shinde and Gawande [11], predicted the sale price of the houses using various machine learning algorithms like, lasso, SVR, Logistic regression and decision tree and compared the accuracy. Alfiyatin et al. [12] has modeled a system for house price prediction using Regression and Particle Swarm Optimization (PSO). In this paper, it has been proved that the house price prediction accuracy is improved by combining PSO with regression.
Timothy C. Au [13] addressed about the absent level problems in Random Forests, Decision Trees, and Categorical Predictors. Using three real data sets, the authors have illustrated how the absent levels affect the performance of the predictors.
-
III. Attribute Selection Measures
Redundant attributes which are considered inappropriate for the data mining task is removed using a process called Attribute selection [14]. Hence a desirable set of attributes results which is the ultimate goal of Attribute selection algorithms. This attribute set produces analogous classification results as that of using all the attributes. Best split attributes selection measures are defined in terms of impurity reduction from parent to
B. Gain Ratio
Information gain is partially inclined towards tests with several outcomes. Hence information Gain obtained by splitting on attribute is highest and such a splitting is hopeless for classification. Followed by ID3 its successor C4.5 arrived, which used Gain Ratio as in equation (2) as an extension to the information gain.
GainRatio
( A ) =
Gain ( A )
SplitiInfo ( A )
Where Gain(A) is the reduction expected in the information requirement instigated by knowing the value of attribute A as shown in equation (3). SplitInfo(A) as in equation (4) is the value defined analogously with Info(D), Which is also known as entropy of D.
Gain ( A ) = Info ( D ) - Info ^( D ) (3)
Splitinfo ( A ) = - Z y-D ^ *log ’ ( D ^) (4)
C. Gini Index
Gini index is used in CART (Classification and Regression Trees). Gini index measures the impurity of D, a data partition or set of training tuples as given in equation (5).
Gini ( D ) = 1 - ^ P,
Pi is the probability that a tuple in D belongs to the class Ci.
IV. Proposed Method
Proposed work aims at predicting the availability of houses based on different features of the houses and also the facilities available nearby the location of the houses. Work also includes the price prediction of the houses based on the features of the house and facilities nearby its location.
This work includes two parts namely,
(i)Decision Tree Classifier is used to predict the availability of houses as per the users’ requirement constraints and it produces responses like yes or no respectively to tell whether a house is available or not.
(ii)Decision tree regression and Multiple Linear Regression methods are used to predict the prices of the houses.
A real time dataset is prepared by analyzing the location named Tadepalligudem of West Godavari District in Andhrapradesh of India. The dataset contains the following features of the houses such as Number of bedrooms, age of the house, transport facility, schools available in the nearby location and shopping facilities.
The proposed method helps to search houses in big cities based on the following attributes.
-
1. Number of bedrooms (1BHK, 2BHK and 3BHK).
-
2. Transport facility such as availability of bus facility, train facility and flight facility.
-
3. School facility such as availability of Government schools, matriculation and CBSE.
-
4. Shopping facility such as small markets, general stores, shopping malls
-
5. Prices of the houses from 10 lakhs to 30 lakhs.
-
6. Age of the house varying from one to five years.
The proposed work is implemented using Scikit Learn, a machine learning tool.
-
A. Scikit Learn
The Scikit-Learn (SK Learn) is a Python Scientific toolbox for machine learning and is based on SciPy, which is a well-established Python ecosystem for science, engineering and mathematics. Scikit-learn provides an ironic environment with state of the art implementations of many wellknown machine learning algorithms, while sustaining an easy to use interface tightly integrated with the Python language [16],[17]. Scikit-learn features various functionalities like Clustering algorithms, Regression, Classification including random forests, gradient boosting, support vector machines, k-means and DBSCAN, and it has been designed to interoperate in conjunction with the Python scientific and numerical libraries SciPy and NumPy.
The step by step implementation using SK Learn is as follows.
Step 1: Import the required libraries.
Step 2: Load the dataset.
Step 3: Assign the values of columns 1 to 6 in the Dataset to “X”.
Step 4: Assign the values of column 7 which is the class label to “Y”.
Step 5: Fit decision tree classifier to the dataset.
Step 6: Predict the class label for the test data.
The decision tree classifier shown in fig. 2 is constructed using Scikit Learn and the respective specifications involved are as shown below. It uses Gini index as the measure to select the relevant attributes for testing and splitting the training set.
DecisionTreeClassifier(class_weight=None, criterion='gini', max_depth=None, max_features=None, max_leaf_nodes=None, min_impurity_decrease=0.0, min_impurity_split=None, min_samples_leaf=1, min_samples_split=2, min_weight_fraction_leaf=0.0, presort=False, random_state=None, splitter='best')
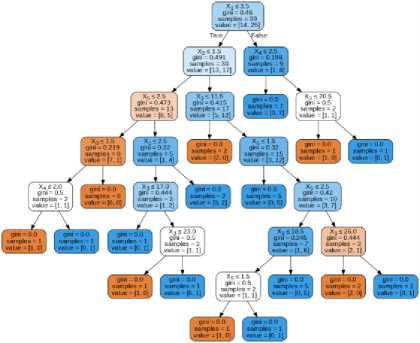
Fig. 2 . Decision Tree classifier for house availability
-
V. Experimental Evaluation
-
A. House Availibility Prediction
The Decision tree output for classifying the availability of houses has discrete binary values like Yes or No. The output of the Decision tree Regression used for house price prediction is a continuous one. The continuous values (Prices) are predicted with the help of a decision tree regression model.
Table 1 shows the sample dataset with ten records considered with some essential features for the area, Tadepalligudem selected in West Godavari District of Andhra Pradesh. But the original dataset consists of 50 records of different combinations. In the table for attribute 3, travelling facility, range is taken from 1 to 3, where 1 denotes Bus facility is available nearby, 2 denotes Bus and train facilities are available nearby and 3 denotes both bus and train facilities are farther to the house location. In shopping facility attribute, 1 denotes less shopping facility with vegetable market and small grocery shops, 2 denotes departmental stores and some small malls and 3 denotes super markets with all facilities. In school attribute 1 denotes that government schools are alone available nearby, 2 denotes that government and private schools are available nearby and 3 denotes that government, private and CBSE schools all are available nearby the house location. Scikit Learn tool splits the training data and test data in the ratio 80:20.
Table 1. Sample dataset
|
no. of bedro oms |
age of the house (years) |
travell ing facilit y |
price in lakhs |
shopp ing facilit y |
Sch ool |
clas s |
|
2 |
5 |
2 |
15 |
2 |
1 |
1 |
|
1 |
4 |
1 |
10 |
1 |
2 |
1 |
|
3 |
3 |
3 |
28 |
3 |
3 |
1 |
|
2 |
4 |
3 |
20 |
2 |
2 |
1 |
|
3 |
2 |
2 |
22 |
3 |
3 |
0 |
|
2 |
4 |
3 |
23 |
3 |
3 |
1 |
|
2 |
1 |
3 |
22 |
2 |
1 |
1 |
|
2 |
4 |
1 |
15 |
1 |
1 |
1 |
|
3 |
3 |
1 |
20 |
1 |
1 |
0 |
|
2 |
2 |
1 |
21 |
2 |
2 |
0 |
The decision tree classifier is constructed using the training dataset splitted (80%) from the main dataset. Once the construction of the decision tree model is over it is tested for its accuracy by using it for classifying the 20% of the remaining dataset called test data. The predicted output for the test dataset is given in table 2. Fifty percentage of the test data are predicted correctly for availability which is clearly known from the table 2.
Table 2. House availability prediction
|
Record No. |
Actual Availability of house |
Predicted availability of house |
|
4 |
0 |
1.0 |
|
28 |
0 |
0.0 |
|
29 |
1 |
1.0 |
|
33 |
1 |
1.0 |
|
34 |
0 |
1.0 |
|
25 |
0 |
0.0 |
|
10 |
0 |
1.0 |
|
22 |
1 |
0.0 |
The performance of the classifier is measured in terms of Mean Squared Error (MSE), Mean Absolute Error (MAE) and root mean squared error (RMSE). The performance metric values are given below.
MAE: 0.5 MSE: 0.5
RMSE: 0.7071067811865476
-
B. House Price Prediction
-
1) Decision Tree Regression Classifier Model
The Predicted house prices using the decision tree regression classifier for the test data is given in table 3. From the table it is clear that five test data record prices are predicted with lesser deviations. For example record number 25 is predicted accurately and record numbers 10 and 34 are predicted with less deviation.
Table 3. House price prediction
|
Record No. |
Actual Price (Lakhs) |
Predicted Price (Lakhs) |
|
4 |
22 |
24 |
|
28 |
17 |
20 |
|
29 |
19 |
14 |
|
33 |
27 |
24 |
|
34 |
24 |
23 |
|
25 |
11 |
11 |
|
10 |
18 |
17 |
|
22 |
12 |
10 |
The performance metrics of the decision tree regression model is given below.
Mean Absolute Error: 2.125
Mean Squared Error: 6.625
Root Mean Squared Error: 2.57390753524675
-
2) Multiple Linear Regression
Almost all the real-world problems are having more than one variables. Linear regression involving multiple variables is called “multiple linear regression” or “multivariate linear regression”. The steps to perform multiple linear regression are almost similar to that of simple linear regression. The difference lies in the evaluation. The equation for multiple linear regression is Y= Ф 0 + Ф 1 Х 1 + Ф 2 Х 2+ Ф 3 Х 3 + Ф 4 Х 4+ Ф 5 Х 5 where Y is the output response, X1 to X5 are the different input attributes, Ф 0 is the intercept and Ф 1 to Ф 5 are the regression coefficients for the attributes (X)
In this house prediction problem the model parameters are assigned as follows. Ф 1 to Ф 5 are the regression coefficients for the attributes (X) of the dataset such as number of bedrooms, age of the house, travelling facility, shopping facility and school facility and Y is the predicted price. Multiple linear regression consists of more than one linear regression lines one per attribute considered. The model calculates the regression coefficients and intercepts using Sk-Learn. The step by step implementation procedure is as follows.
Step 2. Divide the data into “attributes” and “labels”. X variable contains all the attributes/features and Y variable contains labels.
Y = Prices of the houses.
Step 3. Split 80% of the data as training set and 20% of the data as test set.
Step 4. Train the model.
Step 5. Price prediction on test data.
The developed model coefficient values for various attributes are given below.
Coeff Φ 1 to Φ 5 = [[5.8056887 -0.22656665 1.30837976
0.86415419 0.53264177]]
Intercept Φ 0 = [1.6068795]
The influence of each and every feature on price is shown in fig. 3 with multiple regression lines.
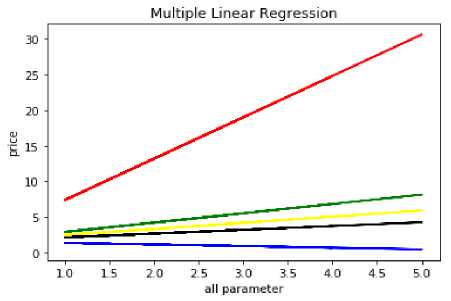
Fig. 3 . Multiple Linear Regression curves for house price prediction
Table 4. Predicted price values
|
Record No. |
Actual Price (Lakhs) |
Predicted Price (Lakhs) |
|
5 |
20 |
21.04942136 |
|
11 |
21 |
16.86709527 |
|
17 |
19 |
21.12892981 |
|
20 |
23 |
22.97885908 |
|
23 |
14 |
17.73124946 |
|
25 |
13 |
12.59635298 |
|
29 |
20 |
16.3344535 |
|
36 |
24 |
26.0487519 |
|
40 |
11 |
11.39291899 |
Red colour line in figure denotes the number of bedrooms, blue colour line denotes the age of the house, green colour line denotes the travelling facility, yellow colour line denotes the shopping facility and black colour line denotes the school facility. According to the figure.3 number of bedrooms is the attribute having more influence on price and age of the house is the attribute having less influence on price. The predicted price values are given in table 4. Prices of record numbers 5, 20, 25 and 40 are predicted more or less correctly.
The performance metrics for multiple regression such as MAE, MSE and RMSE values are given below.
Mean Absolute Error: 1.9527234112192413
Mean Squared Error: 6.0653477870232635
Root Mean Squared Error: 2.462792680479472
Performance of multiple linear regressions is better than decision tree regression for predicting the prices of the houses. The developed model can be used to predict the availability and prices of houses for any new record as per the user constraints. In general the accuracy of prediction can be improved by (i)Having a huge amount of data to get the best possible prediction (ii)Minimizing/eliminating bad assumptions,
(iii)Identifying best features, that has more correlation with the output price.
-
VI. Conclusion and Future Scope
This article uses the most fundamental machine learning algorithms like decision tree classifier, decision tree regression and multiple linear regression. Work is implemented using Scikit-Learn machine learning tool. This work helps the users to predict the availability of houses in the city and also to predict the prices of the houses. Two algorithms like decision tree regression and multiple linear regression were used in predicting the prices of the houses. Comparatively the performance of multiple linear regression is found to be better than the decision tree regression in predicting the house prices. In future the dataset can be prepared with more features and advanced machine learning techniques can be for constructing the house price prediction model.
References House Price Prediction Modeling Using Machine Learning
- Jiawei Han, MichelineKamber, “Data Mining Concepts and Techniques”, pp. 279-328, 2001.
- J. R.Quinlan,” Simplifying decision trees”, Int. J. Human-Computer Studies.
- Maria-Luiza Antonie, et. al., “Application of Data Mining Techniques for Medical Image Classification”, Proceedings of the Second International Workshop on multimedia Data Mining(MDM/KDD’2001) in conjunction with ACM SIGKDD conference. San Francisco,USA, August 26,2001.
- Nikita Patel and Saurabh Upadhyay, “Study of Various Decision Tree Pruning Methods with their Empirical Comparison in WEKA”, International Journal of Computer Applications, Volume 60– No.12, December 2012, pp 20-25.
- J.R. Quinlan, “C4.5: programs for Machine Learning”, Morgan Kaufmann, New York, 1993.
- J.R. Quinlan, “Induction of Decision Trees”, Machine Learning 1, 1986, pp.81-106.
- SamDrazin and Matt Montag”, Decision Tree Analysis using Weka”, Machine Learning-Project II, University of Miami.
- Gang-Zhi Fan, Seow Eng Ong and Hian Chye Koh, “Determinants of House Price: A Decision Tree Approach”, Urban Studies, Vol. 43, No. 12, November 2006, PP.NO.2301- 2315.
- Ong, S. E., Ho, K. H. D. and Lim, C. H., “A constant-quality price index for resale public housing flats in Singapore”, Urban Studies, 40(13), 2003, pp. 2705 –2729.
- Berry, J., McGreal, S., Stevenson, S., “Estimation of apartment submarkets in Dublin, Ireland”, Journal of Real Estate Research, 25(2), 2003, pp. 159–170.
- Neelam Shinde, Kiran Gawande, “Valuation of house prices using Predictive Techniques”, International Journal of Advances in Electronics and Computer Science, ISSN: 2393-2835, Volume-5, Issue-6, Jun.-2018 pp. 34 to 40.
- Adyan Nur Alfiyatin , Hilman Taufiq, Ruth Ema Febrita and Wayan Firdaus Mahmudy, “Modeling House Price Prediction using Regression Analysis and Particle Swarm Optimization”, (IJACSA) International Journal of Advanced Computer Science and Applications, Vol. 8, No. 10, 2017, pp. 323 to 326.
- Timothy C. Au, “Random Forests, Decision Trees, and Categorical Predictors: The Absent Levels Problem”, Journal of Machine Learning Research 19, 2018, pp. no.1-30.
- K.C. Tan, E.J. Teoh, Q. Yu, K.C. Goh,” A hybrid evolutionary algorithm for attribute selection in data mining”, Department of Electrical and Computer Engineering, National University of Singapore, 4 Engineering Drive 3, Singapore 117576, Singapore.Rochester, Institute of Technology, USA.
- Liangxiao Jiang, Chaoqun LI, “An Empirical Study on Attribute Selection Measures in Decision Tree Learning”, Journal of Computational Information Systems6:1, 2010, pp. 105-112.
- http://scikit-learn.org/stable/index.html
- http://scikit-learn.org/stable/auto_examples/index.html.
