Human Identification by Gait Using Corner Points

Author: Mridul Ghosh, Debotosh Bhattacharjee
Journal: International Journal of Image, Graphics and Signal Processing(IJIGSP) @ijigsp
Article in issue: 2 vol.4, 2012.
Free access
Recently human gait has become a promising and very important biometric for identification. Current research on gait recognition is usually based on an average gait image or a silhouette sequence, or a motion structure model. In this paper, the information about gait is obtained from the disparity on time and space of the different parts of the silhouette. This paper proposes a gait recognition method using edge detection, identification of corner points from edges, and selection of control points out of those corner points. Here, the images of moving human figures are subtracted from background by simple background modeling technique to obtain binary silhouettes. A gait signature of a person is taken as silhouette images of a complete gait cycle. A complete gait cycle is then divided into different frames in such a way that the information of the person’s gait style can be represented fully. One given unknown gait cycle is compared with stored gait cycles in terms of a cyclic distances between control points of an image of input gait cycle with that of corresponding image of the stored gait cycle. Experimental results show that our method is encouraging in terms of recognition accuracy.
Gait recognition, silhouettes, Edge Detection, corner detection, control points
Short address: https://sciup.org/15012240
IDR: 15012240
Text of the scientific article Human Identification by Gait Using Corner Points
Gait [1] is a behavioral biometric that measures the way people walk. The demand for automatic human identification system [2][3][4] is robustly escalating in many important applications, particularly at a distance. It has gained an immense interest for its uses in many security-sensitive environments such as banks, military, parks and airports. Biometrics is a powerful tool for reliable human identification. It makes use of human physiology or behavioral characteristics such as face, iris and fingerprints for recognition. However, these biometrics methodologies are either informative or limited to many environments. For example, most face recognition techniques are able to recognize only frontal or side faces or with some specified angle of turn or inclination, but if the face is not shown or only the back side of head is shown then it is of no use, other biometrics such as fingerprint and iris are no longer applicable when the person suddenly appear in the surveillance. Therefore, new biometric recognition methods are strongly required in many surveillance applications, particularly recognition at a distance. Compared with the first generation biometrics, such as face, fingerprints and iris, which are widely applied in some commercial and static applications, currently, gait is the only biometric at a distance, can be used when other biometrics are either obscured or at too low a resolution to be perceived till now, though it is also affected by some factors such as drunkenness, obesity, pregnancy and injuries involving joints. So to recognize an individual’s walking characteristics, gait recognition includes visual cue extraction as well as classification. However, major issue here is the extraction and representation of the gait features in an efficient manner. Another motivation is that video footage of suspects can be made readily available, as surveillance cameras are relatively low cost and can be installed in most buildings, banks, railway stations, shopping malls, cinema hall, airport, different important locations of road, sacred places or different locations requiring a security presence. Once video footage is available then only task would be to monitor the movement of the suspect. The increase in processor speed, along with the decrease in price of high speed memory and data storage devices, there has been increased availability and applicability of computer vision and video processing techniques. Section II describes overview of the system, implementation of the present method has been described in section III, experiments conducted for this work along with results are described in section IV, and section V concludes this work.
-
II. OVERVIEW
Our investigation aims to establish an automatic gait recognition method based upon silhouette analysis measured during walking. Gait includes both the body appearance and the dynamics of human walking motion. Intuitively, recognizing people by gait depends greatly on how the silhouette shape of an individual changes over time in an image sequence. So, we may consider gait motion to be composed of a sequence of static body poses and expect that some distinguishable features with respect to those static body poses can be extracted and used for recognition by considering spatial variations of those observations.
For any recognition system, the feature extraction is the most important thing. Person’s gait sequences need to be considered in such a way that the sequence can completely identify the person’s walking style, which is discussed in subsection III A . As we are considering the silhouette images, the information relating to silhouettes are to be extracted. The edges of silhouette image have been extracted after applying edge detection technique and we are to find some points on the edge which would be used to represent a gait movement. After proper edge detection, corner detection technique will definitely work well because corner can be defined as a point for which there are two dominant and different edge directions in a local neighborhood of the point . t he corner strength is defined as the smallest sum of squared differences between the patch and its neighbors i.e. horizontal, vertical and on the two diagonals, discussed in subsection III B . From these corner points we need to select some points in such a way that the gait signature of the person’s silhouette is properly extracted and discussed in subsection III C . Distance between these points need to be calculated as these distance values are the features of the silhouettes. After extracting the features of silhouettes, they are stored in the database corresponding to their selected points in the form of matrices. After obtaining feature of the gait sequence of the testing person, it’s being compared with the feature sequence available in the database, which is discussed in subsection III D . If the trained database contains the similar sequence then the video gets authenticated.
-
III. PRESENT METHOD
Like any trainable recognition system, this gait recognition system is also consisted of two phases namely training and testing. Taking a gait silhouette sequence of a person, edges of individual image in that sequence is detected after applying Sobel Edge detector [5][6][7]. From those edges, the closed contour of the individual is extracted. From the closed contour, the corner points are identified. There may be several corner points in an image, but we need to pick up a set of fixed points such that the set represents the uniqueness of an individual by which any individual can be discriminated from others. These points are called control points. A block diagram representing the training phase is shown in figure 1.
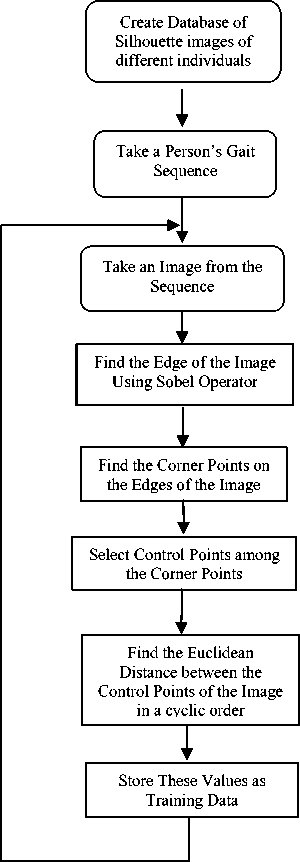
Figure 1. The block diagram for the training phase
Euclidean Distances between the Control Points in cyclic order are calculated and stored as features from that sequence. All these distance values from a sequence of images are kept in the database as training set for a person.
-
A. Gait Sequence
The database can be created by taking the video sequence of a person, then dividing this video sequence into different frames in such a way that the sequence can completely identify the persons gait style. Moreover, these images are the silhouette [8][9][10] images of persons to be included in the database. The silhouette of a person in the image can be obtained by background subtraction method [14]. Recognizing people by gait depends greatly on how the silhouette shape of an individual changes over time in an image sequence. To conduct experiments, we have used CASIA gait database, where the main assumption made is that the camera is static, and the only moving object in video sequences is the walker. The gait sequence can be obtained by taking the silhouettes in such a way that the object’s posture in the first image will repeat in another image and the total number of images from the first to that repeated postured image make a sequence. Hence, to find a sequence, we accumulate all the images after recording the pose of the object in the initial image until the same pose is repeated in some image. For this database, the 26th image’s gait pose is same as first image and we have taken twenty six images of a person as a gait cycle. Such a sequence is shown in figure 2. It may be noted that, in the second sequence the images may not be in same pose as in the first sequence, i.e. first image’s posture of the first sequence may not be same as that of first image of second sequence but it will be same with some another image later in that sequence. We have tested with the gait cycle of 50 persons.
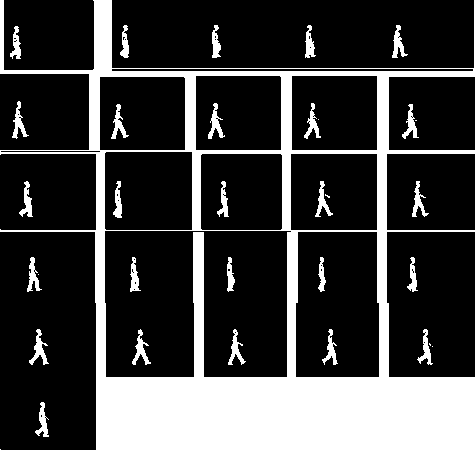
Figure 2. Complete gait cycle or sequence of a person
-
B. Corner Detection
Before we detect corner, we have detected edge of the image to find approximate contour of gait images. Edge detection [5][6][7][11][12][13] is a fundamental tool in image processing and computer vision , particularly in the areas of feature detection and feature extraction , which aims at identifying points in a digital image at which the image brightness changes sharply or, more formally, has discontinuities. Image Edge detection significantly reduces the amount of data and filters out useless information, while preserving the important structural properties in an image. Here, we have used Sobel operator [6] as a filter to detect edge of an image.
After detecting the edge of the silhouette, we find out the corner points on the edge. A corner can be defined as the intersection of two edges. A corner can also be defined as a point, for which there are two dominant and different edge directions in a local neighborhood of the point. In practice, most so-called corner detection methods detect intersecting points in general, rather than corners in particular. As a consequence, if only corners are to be detected it is necessary to do a local analysis of detected intersecting points to determine which of these real corners are. Examples of edge detection that can be used, with some post-processing, to detect corners are the Kirsch-Operator and the Frei-Chen masking set [14]. There are different types of method for corner detection e.g. Minimum Eigenvalue Method, Moravec corner detection algorithm [14], The Harris and Stephens corner detection method [14][16][17] etc. Minimum Eigenvalue Method is more computationally expensive than the Harris corner detection algorithm. Harris and Stephens improved upon Moravec's corner detector by considering the differential of the corner score with respect to direction directly, instead of using shifted patches. In order to exploit this improvised result, in this work, we have used the Harris and Stephens corner detection method to detect corner of the edge of the silhouette [15][16][17] .
Let an image be given by I. Consider taking an image patch over the area ( u, v ) and shifting it by ( x, y ). The weighted sum of squared differences (SSD) between these two patches, denoted as S, is given by: S(x,y) = ∑ ∑ w(u,v ) (I(u+x,v+y ) – I(u,v)) 2 … (1)
u v
I (u+x,v+y) can be approximated by a Taylor expansion. Taking I x and I y be the partial derivative of I, such that
I (u+x, v+ y)≈ I (u,v) + I x (u,v)x +I y (u,v)y ……….….(2)
The approximation can be written as,
S(x,y) = ∑ ∑ w(u,v)(I x (u,v)x +I y (u,v) y)2 ……..……(3) uv
The equation (3) can be written in matrix form:
S(x,y) ≈ (x y) A ……….……(4)
where A is the structure tensor [17], given as
^^|д “И^» 1»Я.......(5)
This matrix is a Harris matrix, and angle brackets denote averaging i.e. summation over (u, v).
-
C. Selection of control points
In this work, we have first extracted the contour of an image. We find the corners on this contour of each subject. Taking these corner points, we select a subset of those with a fixed number, called as set of control points. Then we find out the distances between them in a cyclic order and stored as a feature vector for that image. Similarly, for all the twenty six images of a gait sequence, feature vectors are extracted and stored in sequence to represent the feature vector set for the entire sequence.
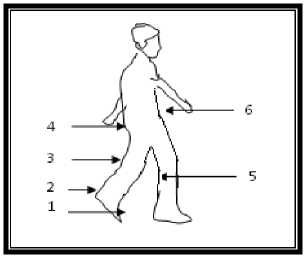
Figure 3. C ontrol points 1, 2, 3, 4, 5 and 6.
Control point selection is very important and imperative in our paper of human identification by gait. From the corner points, we have chosen some points that will rightly characterize the person’s gait characteristics.
In the figure 2, we can see the control points marked as 1, 2, 3, 4, 5, and 6 on toe, ankle, thigh, hip, knee, and waist respectively . Reason for selecting these points is that, respective positions of those points remain approximately constant for the same type of posture in different sequences but changes when the subject moves in a different posture and also, distinctly represents walking style of different individuals.
D. Testing
In case of testing, we follow the same technique for an unknown person’s gait sequence and find out the distance values accordingly to compute the feature vector. Then this vector is compared with all such vectors stored in the database against a derived threshold value. If there is a match with any person’s training sequence data then that person is identified, but if there is no match then we can infer that the data of that person is not available in our training set. The detail of the testing procedure is shown in figure 4.
The threshold value(T) is chosen in such a way that for the same person, after matching the training set with the testing set, it will rightly recognize the person, and for a different person, it will also recognize that both the person are not same. To declare a match between probe gait image and gallery gait images at least four control points, out of six, should match. This threshold value (T) has been identified experimentally.
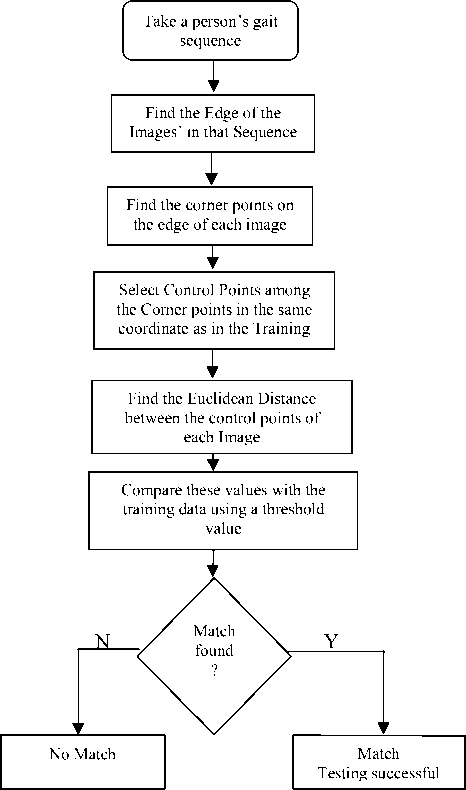
Figure 4. The Block Diagram describing testing
-
IV. EXPERIMENTAL RESULT
For experimentation, we have used CASIA gait database: dataset C. We conducted our experiment with gait sequence of 50 persons to examine the effectiveness of our technique. Here, we have given sample details of two individuals. Table I shows the data of 26 images of a person (say person-A). The first column denotes the image numbers and rest of columns are distances between the control points in cyclic order. For the same person, person-A, distances are also computed for another sequence and shown in Table II. After testing, we see the two different sequences of person-A matches. Since we have considered 26 images in a sequence, both in the training and testing database there should be a match with 26 images.
t able i . t able contains the data of person -a of a sequence
|
Image No. |
Distance between Control points |
|||||
|
1-2 |
2-3 |
3-4 |
4-5 |
5-6 |
6-1 |
|
|
1 |
14.14214 |
10.04988 |
22.82542 |
56.04463 |
34.48188 |
44.01136 |
|
2 |
36.87818 |
7.28011 |
35.44009 |
23.85372 |
38.32754 |
61.35145 |
|
3 |
81.02469 |
7 |
38.32754 |
27.65863 |
87.28115 |
36.35932 |
|
4 |
28.44293 |
1.414214 |
68.18358 |
33.30165 |
78.31347 |
40.31129 |
|
5 |
35.0571 |
13 |
31.257 |
25.4951 |
60.82763 |
43.46263 |
|
6 |
10.19804 |
4 |
36.12478 |
58.18075 |
22.82542 |
40.31129 |
|
7 |
11.40175 |
1.414214 |
38.20995 |
23.85372 |
58.30952 |
19.31321 |
|
8 |
15.81139 |
1.414214 |
80.22468 |
50.77401 |
27.29469 |
23.85372 |
|
9 |
17.72005 |
1.414214 |
21.84033 |
88.29496 |
112.2854 |
18.68154 |
|
10 |
54.45181 |
1 |
27.51363 |
58.5235 |
11.31371 |
91.78235 |
|
11 |
10.44031 |
7.28011 |
46.32494 |
54.78138 |
84.48077 |
25.05993 |
|
12 |
21.9545 |
6.082763 |
34.9285 |
73.08215 |
17 |
91.09336 |
|
13 |
16.12452 |
8 |
86.49277 |
71.30919 |
58.13777 |
79.84986 |
|
14 |
82.9759 |
6.324555 |
36.71512 |
23.76973 |
55.9017 |
98.03061 |
|
15 |
76.29548 |
6.708204 |
16.27882 |
75.18643 |
83.29466 |
23.02173 |
|
16 |
101.7104 |
6.708204 |
32.89377 |
54.40588 |
26.24881 |
61.03278 |
|
17 |
78.31347 |
5 |
37.36308 |
49.0408 |
113.1106 |
105.3233 |
|
18 |
26.07681 |
12 |
45.27693 |
98.65597 |
38.47077 |
22.02272 |
|
19 |
31.257 |
10.04988 |
48.25971 |
21.09502 |
60.29925 |
24.41311 |
|
20 |
21.37756 |
1.414214 |
94.19129 |
86.68333 |
11.31371 |
15.0333 |
|
21 |
72.1734 |
16.03122 |
80.30567 |
18.24829 |
101.4938 |
28.30194 |
|
22 |
79.40403 |
8 |
43.17407 |
25.45584 |
65.37584 |
91.44397 |
|
23 |
14.31782 |
7 |
87.69265 |
25.23886 |
14.86607 |
85.61542 |
|
24 |
11.18034 |
2.236068 |
13.45362 |
98.48858 |
10.19804 |
86.58522 |
|
25 |
54.57105 |
8.062258 |
14.31782 |
99.24717 |
84.85281 |
23.08679 |
|
26 |
16.87818 |
7.28011 |
35.44009 |
23.85372 |
38.32754 |
51.35145 |
Table II. Table contains the data of person A of another sequence
Table III. Table contains the data of person-B of a sequence
|
Image No. |
Distance between Control Points |
|||||
|
1-2 |
2-3 |
3-4 |
4-5 |
5-6 |
6-1 |
|
|
1 |
38.60052 |
10.04988 |
41.4367 |
24.20744 |
38.8973 |
24.69818 |
|
2 |
36.13862 |
5.09902 |
15.55635 |
25.23886 |
73.68175 |
73.37575 |
|
3 |
16.27882 |
16.03122 |
44.28318 |
34.1321 |
71.06335 |
20.09975 |
|
4 |
59.07622 |
11.04536 |
44.72136 |
69.64194 |
28.86174 |
20.61553 |
|
5 |
42.04759 |
49 |
25.31798 |
35 |
54.12947 |
101.2028 |
|
6 |
17.46425 |
4.123106 |
52.23983 |
51.07837 |
8.544004 |
97.49359 |
|
7 |
27.89265 |
4.123106 |
29.12044 |
35.80503 |
40.60788 |
27.80288 |
|
8 |
27.20294 |
10.04988 |
15.6205 |
110.0227 |
13.45362 |
88.76936 |
|
9 |
55.7853 |
11.04536 |
51.24451 |
40.81666 |
10.19804 |
30.52868 |
|
10 |
25 |
6.082763 |
36.23534 |
33.94113 |
14.76482 |
76.92204 |
|
11 |
26.1725 |
6.324555 |
56.64804 |
28.79236 |
59.5399 |
109.2016 |
|
12 |
18.02776 |
8.944272 |
29.20616 |
28.4605 |
21.40093 |
32.14032 |
|
13 |
68.65858 |
4 |
38.01316 |
38.91015 |
67.74216 |
24.08319 |
|
14 |
35.13662 |
5.09712 |
15.54635 |
25.23226 |
73.18175 |
73.33475 |
|
15 |
96.13012 |
6.082763 |
20.24846 |
27.20294 |
76.10519 |
75.43209 |
|
16 |
16.12452 |
30.08322 |
46.27094 |
29.83287 |
78.31347 |
19.23538 |
|
17 |
59.03389 |
68.00735 |
8.246211 |
22.82542 |
67.18631 |
50.92151 |
|
18 |
48.16638 |
12 |
37.48333 |
38.07887 |
51.62364 |
25.4951 |
|
19 |
34.71311 |
13.0384 |
76.53104 |
21.0238 |
10.63015 |
94.14882 |
|
20 |
31.01612 |
8 |
62.8172 |
42.94182 |
89.27486 |
115.447 |
|
21 |
19.23538 |
6 |
56.29387 |
40.31129 |
74.67262 |
27.20294 |
|
22 |
31.38471 |
6.082763 |
61.03278 |
27.313 |
32.75668 |
87.23531 |
|
23 |
52.20153 |
6.082763 |
76.24303 |
33.42155 |
18.78829 |
79.75588 |
|
24 |
17.72005 |
9.055385 |
102.9612 |
60.16644 |
41.59327 |
92.84934 |
|
25 |
21.63331 |
7.615773 |
70.34202 |
39.96248 |
50.35871 |
90.24965 |
|
26 |
31.19691 |
6.082763 |
45.24144 |
21.09502 |
10.63015 |
26.2168 |
Table IV. Different recognition parameters (for threshold, T= 8.5)
|
Image No. |
Control Points |
|||||
|
1-2 |
2-3 |
3-4 |
4-5 |
5-6 |
6-1 |
|
|
27 |
71.19691 |
6.082763 |
91.24144 |
21.09502 |
10.63015 |
76.2168 |
|
28 |
62.39391 |
6.082763 |
74.43118 |
56.85948 |
29.54657 |
52.55473 |
|
29 |
64.03124 |
13 |
26.68333 |
42.48529 |
104.1201 |
44.72136 |
|
30 |
54.07176 |
19.06524 |
15.41639 |
23.12714 |
52.80127 |
15.5125 |
|
31 |
11.31371 |
50.24938 |
106.3015 |
115.2085 |
19.10497 |
23.4094 |
|
32 |
14.56022 |
5.09902 |
52.23983 |
37.57659 |
21.84033 |
15.29706 |
|
33 |
52.46904 |
5.09902 |
73.68175 |
31.241 |
32.98485 |
83.9345 |
|
34 |
8.485281 |
1.414214 |
24.69818 |
69.57011 |
21.09502 |
108.8531 |
|
35 |
17.49286 |
2.236068 |
45.22168 |
49.64877 |
15.81139 |
94.59387 |
|
36 |
16.15549 |
7.211103 |
36.67424 |
30.52868 |
13.45362 |
66.24198 |
|
37 |
53.45091 |
6.324555 |
57.24509 |
25.96151 |
8 |
59.20304 |
|
38 |
16.27882 |
8.544004 |
13.0384 |
101 |
7.615773 |
100.4241 |
|
39 |
64.13267 |
11.40175 |
106.7942 |
64.62198 |
54.12947 |
102.3572 |
|
40 |
49.64877 |
4 |
103.9471 |
82.46211 |
29.83287 |
58.59181 |
|
41 |
80.025 |
17 |
30.41381 |
23.02173 |
37.10795 |
20.24846 |
|
42 |
55.08176 |
29.01724 |
19.41649 |
70.00714 |
62.80127 |
25.6125 |
|
43 |
73.06162 |
8.062258 |
50.08992 |
65.80274 |
25.70992 |
20 |
|
44 |
17.46425 |
4.123106 |
27.65863 |
38.27532 |
46.87217 |
22.2036 |
|
45 |
51.97115 |
1.414214 |
36.68787 |
65.14599 |
11 |
99.0404 |
|
46 |
8.062258 |
8 |
32.57299 |
52.80152 |
63.15061 |
26.24881 |
|
47 |
13.89244 |
5.09902 |
34.9285 |
39.05125 |
39.84972 |
36.12478 |
|
48 |
17.08801 |
5 |
76.92204 |
30.88689 |
49.47727 |
112.8938 |
|
49 |
54.23099 |
6.082763 |
23 |
59.09315 |
8.485281 |
72.67049 |
|
50 |
41.14608 |
8.062258 |
74.72617 |
39.44617 |
47.67599 |
90.82401 |
|
51 |
63.06346 |
2 |
38.07887 |
52.92447 |
21.54066 |
31.257 |
|
52 |
66.27882 |
6.082763 |
80.51828 |
24.29447 |
12.95281 |
80.00625 |
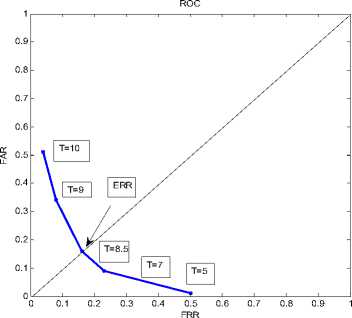
Figure 5. ROC Curve
|
Person |
Correct Recognition rate |
Correct Rejection |
False Acceptance Rate (FAR) |
False rejection Rate (FRR) |
Equal Error Rate (EER) |
|
50 |
84% |
83% |
16% |
16% |
0.16 |
-
V. CONCLUSION
With strong experiential evaluation, this paper focuses on the idea of using silhouette-based gait analysis. With the increasing demands of visual surveillance systems, human identification at a distance has recently gained more interest in the field of image processing and pattern recognition. Gait is a potential behavioral feature and many allied studies have demonstrated that it has a rich potential as a biometric for recognition. Gait is sensitive to various covariate conditions, which are circumstantial and physical conditions that can affect either gait itself or the extracted gait features. Example of these conditions includes carrying condition (backpack, briefcase, handbag, etc.), view angle, speed and shoe-wear type and etc. In this work, we have used only six control points. There is a scope of extension in number of control points. Also, for classification for feature vectors support vector machine (SVM) can be employed in future.
ACKNOWLEDGEMENT
References Human Identification by Gait Using Corner Points
- R. Zhang, C.Vogler, and D. Metaxas, “Human gait recognition” IEEE Workshop on Articulated and Nonrigid Motion, 2004.
- Jiwen Lu, ErhuZhang, “Gait recognition for human identification based on ICA and fuzzy SVM through multiple views fusion”, Pattern Recognition Letters 28 (2007) 2401–2411.
- James B. Hayfron-Acquah, Mark S. Nixon, John N. Carter “Automatic gait recognition by symmetry analysis” Pattern Recognition Letters xxx (2003) xxx–xxx.
- Wang, L., Tan, T., Ning, Z., Hu, W., 2003. “Silhouette analysis-based gait recognition for human identification”. IEEE Trans. Pattern Anal. Machine Intell. 25 (9), 1505–1518.
- Elif AYBAR,”Sobel Edge Dtection Method for Matlab” Anadolu University, Porsuk Vocational School, 26410 Eskisehir
- SOBEL, I., An Isotropic 3×3 Gradient Operator, Machine Vision for Three – Dimensional Scenes, Freeman, H., Academic Pres, NY, 376-379, 1990.
- SOBEL, I., Camera Models and Perception, Ph.D. thesis, Stanford University, Stanford, CA, 1970.
- Liang Wang, Tieniu Tan, Senior Member, IEEE, Huazhong Ning, and Weiming Hu “Silhouette Analysis-Based Gait Recognition for Human Identification” IEEE Transactions On Pattern Analysis And Machine Intelligence, Vol 25. No 12, December 2003.
- Brian DeCann and ArunRoss, ”Gait Curves for Human Recoognition, Backpack Detection and Silhouette Correction in a nighttime Environmant”, USA Proc. of SPIE Conference on Biometric Technology for Human Identification VII, (Orlando, USA), April 2010.
- L. Wang, H. Ning, W. Hu, and T. Tan, “Gait recognition based on procrustes shape analysis,” Proceedings of the IEEE International Conference on Image Processing, pp. 433–436, 2002.
- E. Argyle. “Techniques for edge detection,” Proc. IEEE, vol. 59, pp. 285-286, 1971.
- Raman Maini & Dr. Himanshu Aggarwal. ”Study and Comparison of Various Image Edge Detection Techniques” International Journal of Image Processing (IJIP), Volume (3): Issue (1).
- R. C. Gonzalez and R. E. Woods. “Digital Image Processing”. 3rd ed. Prentice Hall, 2002.
- C. Harris and M. Stephens (1988). "A combined corner and edge detector". Proceedings of the 4th Alvey Vision Conference. pp. 147–151.
- G. Veres, L. Gordon, J. Carter, and M. Nixon, “What Image Information is Important in Silhouette–based Gait Recognition?” CVPR, vol. 2, pp. 776–782, 2004.
- C. Harris and M. Stephens (1988). "A combined corner and edge detector". Proceedings of the 4th Alvey Vision Conference. pp. 147–151.
- J. Matthews. “An introduction to edge detection: The sobel edge detector,” Available at http://www.generation5.org/ content/2002/im01.asp, 2002.
- CASIA gait database http://www.sinobiometrics.com
