Hydrodynamic dispersion of calcium aluminosilicate from technogenic and nonmetallic materials

Author: Kashkina Liudmila V., Stebeleva Olesya P., Emelyanova Tatiana Y., Petrakovskaya Eleonora A., Bayukov Oleg A.
Journal: Журнал Сибирского федерального университета. Серия: Техника и технологии @technologies-sfu
Article in issue: 1 т.7, 2014.
Free access
Physicochemical properties of two calcium aluminosilicate materials after reducing in the hydrodynamic rotary generator in supercavitation mode were studied. The samples are the crystal ceramic foam based on Kansko-Achinsk lignite-ash and the porous glass material obtained from low-manganese nonmetallic feed. X-ray phase analysis, EPR-method, NPR-method (the Mossbauer Effect) and optical microscopy were used. It was found that the material is changing its stucrure in a hydrodynamic dispersion process caused by high-cavitation. The nature of the changes depends on its initial state.
Hydrodynamic dispersion, cavitation, crystal ceramic foam, porous glass material
Short address: https://sciup.org/146114819
IDR: 146114819 | UDC: 504.5:
Гидродинамическое диспергирование кальций-алюмосиликатных материалов из техногенного и нерудного сырья
Изучены физико-химические свойства двух кальций-алюмосиликатных материалов после измельчения в гидродинамическом генераторе роторного типа в режиме суперкавитации. Исследованы образцы - кристаллическая пенокерамика на основе зол бурых Канско-Ачинских углей и пористый стекломатериал, полученный из нерудного сырья с низким содержанием марганца. Для анализа были использованы методы РФА, ЭМР, ЯГР (эффект Мёссбауэра), оптическая микроскопия. Показано, что в процессе гидродинамического диспергирования за счет высокоэнергетического кавитационного воздействия в материалах происходят глубокие структурные изменения. Получено, что характер изменений зависит от исходного состояния исследуемого материала.
Text of the scientific article Hydrodynamic dispersion of calcium aluminosilicate from technogenic and nonmetallic materials
Currently, treatment processes of technogenic materials allowing not only to extract the most valuable components of the waste, but also to obtain new materials with desired properties are developed and implemented. However, these technologies are energy intensive, since more than 50 % of the energy consumed for cominution of the basic substance. Recent studies have shown that energetically low-cost technology of hydrodynamic dispersion (crushing in a liquid medium) can be successfully used for fine powdering [1-8]. In [8] it was shown that used rotary hydrodynamic generator of low productivity under specified modes for 1 minute of dispersion at the initial average ash size of 175 microns produces an particle with average size of 25 microns, i.e. ash particles are “grind down” by almost 7 times ( the concentrations less than 3 wt %). If dispersed ash with an average initial size of 25 microns under the same conditions, then the output can be obtained particles having an average particle size of 3,5 – 4 mkm. Thus, in two phases (2 min. dispersion) particle size can be reduced from 175 microns to 4 microns, i.e. by more than 40 times. At higher
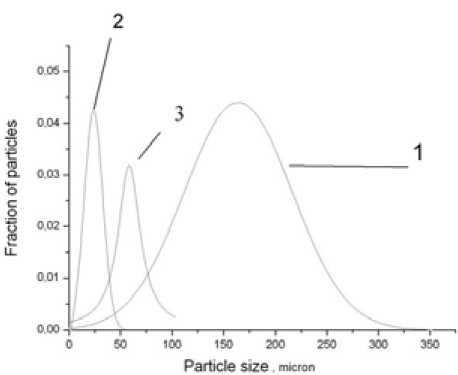
Fig. 1. The density function of particle size distribution: 1 – initial ash, 2 – ash after dispersion (concentration 3 %), 3 – ash after dispersion with increased (25 %) concentration concentrations (25 %) dispersion effect is considerably less. Ash can grind from 175 microns to 60 mkm (Fig. 1).
One of the main factors determining the efficiency of the technology is the cavitation effect (from Lat. Cavitas – emptiness), which occurs due to sudden sharp pressure reducing in the flow of a moving fluid (hydrodynamic cavitation). Cavities filled with gas, vapor or a mixture thereof (cavitation bubbles, cavities) are formed in a liquid. As a result, the concentration of mechanical energy of the fluid in very small volumes of cavitation bubbles, a high density of energy, according to some estimates up to 1015 J/m3 [9]. Crushing occurs at high energy exposing of cumulative fluid microjets and shock waves generated by the collapse of cavitation bubbles on the solid particles. The temperature and pressure near the collapsing bubbles can be above 2000 K and 100 MPa [9, 10].
Experimental technicues
Physical basis of cavitational effects are studied well, but the consequences to which they lead, are not always known. In view of the complexity of high-energy cavitation processes in the dispersion, theoretical and experimental research in this area is relevant for the development of efficient treatment processes for technogenic materials. A study was made of hydrodynamic dispersion of materials from industrial waste produced by the method of pyrometallurgical melting in a reducing medium [11]. Two kinds of calcium aluminosilicate powder of average dispersion (100 to 200 microns) were investigated:
-
1. The crystalline material was – ceramic foam. It is produced by a self-propagating crystallization during remelting of silica foam from Kansko-Achinsk lignite-ash. Ash composition (wt %): SiO 2 – 45-54; CaO – 15-33; A l2 O 3 – 5-12; C – 1-2; Fe [х] O [y] – 7-11; MgO – 3-6; Na 2 O – 0,1-1; SO 3 – 0,1-0,6; TiO 2 – 0,1-0,3; K 2 O – 0,8-1,5; it also contains impurities of transition metals such as Ti, Mn, Cr, etc. The ceramic foam consist of anorthite crystal structure, gehlenite, wollastonite, iron oxides, transition metals Ti, Mn, Cr, etc. in small quantities.
-
2. The porous glass material derived from the melt of nonmetallic materials low in of manganese by the thermal shock method. The composition is (wt %): SiO 2 – 44,41; CaO – 32,46; Al 2 O 3 – 7,82; Fe 2 O 3 – 1,14; MnO – 4,88; MgO – 0,71; Na 2 O – 0,16; SO 3 – 0,1-0,6; TiO 2 – 0,186; K 2 O – 1,82.
The dispersion was carried out in the hydrodynamic rotary generator with two-bladed wedge impeller in mode supercavitation. Engine power – 1 kW, volume of the working chamber – 3•10-4 m3. At supercavitation mode, the bubbles are located in the tail of nonstationary supercavities, generated behind the rotor and the stable cavitation effect on the dispersing phase without destroying the impeller is implemented [10]. Three-percent water suspension of the glass and the ceramic foam powders is processed for 2 minutes at the rotor speed 10 000 r/min.
That said the part of the dispersed phase precipitated, and another part remained in a state of stable suspension. The precipitate and the suspension was dried in a Petri dish at temperature of 250 °C for 72 hours. The study was carried out by method of optical microscopy, XRD (diffractometer SMART APEX II), NGR – Mossbauer Effect (MS1104Em spectrometer), EMR (X-band spectrometer SE/X-2544).
Intrpritation and discussion of research results
According to the data of optical microscopy particle size of the ceramic foam and glass ceramics decreased by an average almost an order – to a fineness state after dispersion [12]. XRD spectra of the initial sample ceramic foam (diffractometer SMART APEX II), are characteristic of crystalline material (Fig. 2). The spectra are well manifested phase lines of anorthite CaAl 2 SO 8 (d = 3,20; 2,95; 2,14 Å), gehlenite 2CaO SiO 2 Al 2 O 3 (d = 2,30; 2,04 Å), wollastonite Ca SiO 3 (d = 2, 97; 2,80; 1,83 Å), hematite Fe 2 O 3 (d = 2,69; 2,53; 2,20 Å).
We obtained sediment and suspension after the dispersion of the sample. The XRF spectrum profile of sediment is similar to spectrum of the initial sample, but changes were also observed. Along with the decrease in intensity of some lines until their disappearance there are new well resolved lines of such phases as Al (OH) 3 (d = 4,34; 2,23; 2,03; 1,67 Å), Al 2 O 3 * H 2 O (d = 3,99; 3,214; 2,558 Å), Al2 (OH)4Si2 (d = 7,17; 3,847; 3,37 Å), which wasn’t in the initial sample. In other words both partial destruction of the crystal structures of the material and synthesis of new compounds with the active participation of water is obtained.
The initial glass material is preferably an amorphous medium containing an amount of crystalline phase is not recorded by an X-ray method. Fig. 3 shows the XRD spectrum of the tested glass, whose form is characteristic of the X-ray amorphous material.
Under dispersing the porous structure of the sample is actively destroyed, it increases the degree of sample’s amorphousness. Degree of amorphous suspension (Fig. 4, line a) is greater than the sediment (Fig. 4, line b). Synthesis of new crystalline phases in this sample isn’t detected.
EMR spectra (electronic magnetic resonance) registered on EPR – spectrometer X-band SE/X-2544. EMR spectrum of initial ceramic foam sample is represented by line of complex shape which is formed by magnetic centers in the sample, which lines are overlapped with each other. Spectra simulation has allowed to allocate the three centers (Fig. 5). Paramagnetic (phase I), paramagnetic phase is formed apparently by iron salts. Parameters: g-factor = 1,8; linewidth ∆H = 46 mT. Phase II – magnetite (spinel) with parameters g = 2,13; ∆H = 108 mT. Hematite (phase III)) – g = 3,3; ∆H = 128 mT.
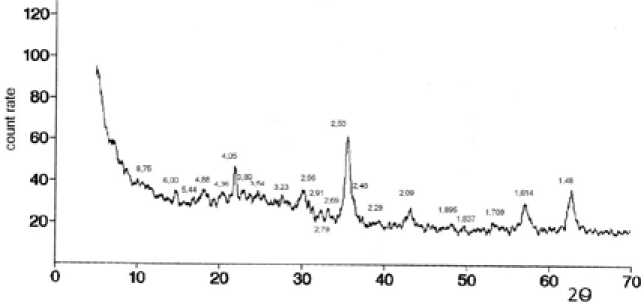
Fig. 2. XRD spectrum of the initial powder of ceramic foam
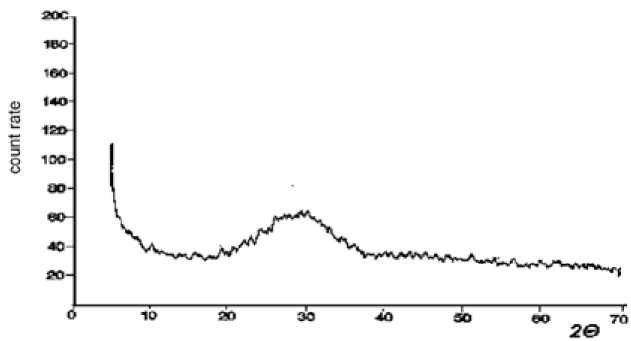
Fig. 3. XRD spectrum of the initial glass material powder
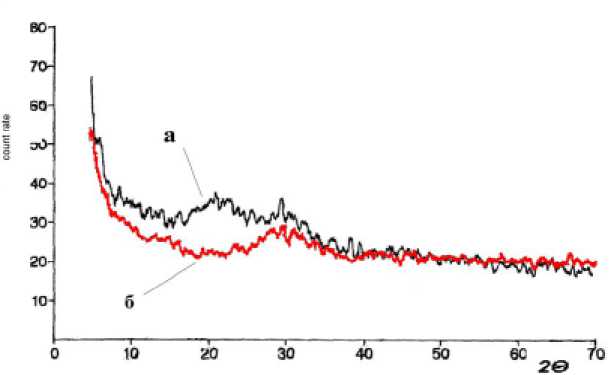
Fig. 4. XRD spectrum of glass material after dispersion (a – suspension, b – sediment)
Difference in g-factors values of considered phases from listed in [13] caused by complex structure of the ceramic foam that is also observed in other studies [14]. Obtained from EMR data on the magnetization in arbitrary units (given in brackets) allow determining the contribution to the magnetism of these phases (for the degree of increase): III (5177) – I (8567) – II (9472).
After dispersing the restructuring of the paramagnetic component ceramic foam associated possibly with change of iron valence is fixed by EMR spectra of sediment. Spectra simulation (Fig. 6b) allows to select the line with the parameters g = 2,02; ∆H = 79 mT, which value the same with the values of g and AH for magnetite particles [14] and the line g = 2,6; AH = 100 mT (hematite).
The temperature behavior of sediment magnetization is typical for samples superparamagnetic nanoparticles (Fig. 6a). With decreasing temperature, the lines displaced in lower field, the width
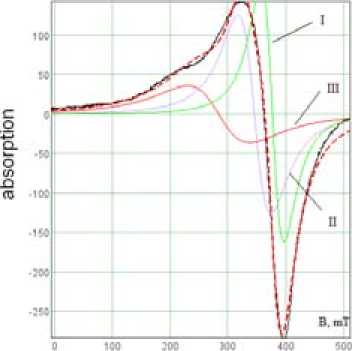
Fig. 5. Spectrum simulation of the initial sample EMR ceramic foam
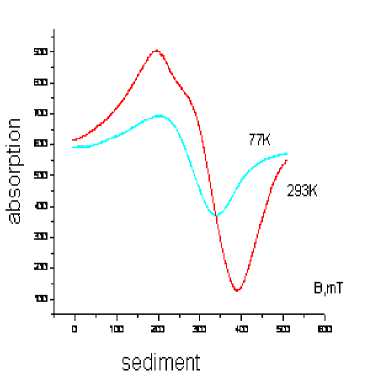
Fig. 6. a – EMR spectrum of ceramic foam sediment after dispersion, b – simulation of the EMR spectrum
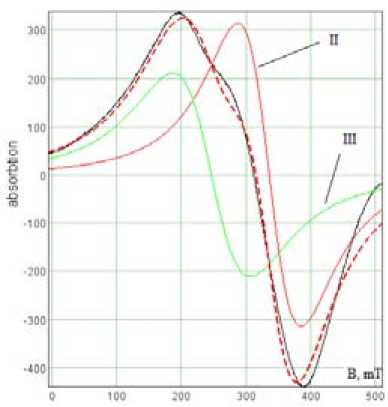
b
decreases. This can be related to increasing exchange interaction, narrowing line (Lorentz line shape) or structural changes. So for magnetite (phase II) at 293 K the magnetization value per unit is equal to 41112, at 77-10475, respectively. Hematite (phase III) at 293 K – 33800, at 77-15377, respectively. A sharp drop in the magnetization of hematite shows greater magnetic permeability for these particles compared with magnetite particles. The line broadening after dispersion can be related to an increase in the contribution of surface heterogeneity with decreasing particle size, or increasing the dimensional dispersion. The values of g-factors also a bit changed for these reasons.
Analysis of the EPR spectra of the initial sample glass material showed that it has a structure with a developed surface, contains manganese oxides (line 1, Fig. 7) and iron (low-field part of the spectrum, line 2, Fig. 7). The fraction containing manganese quantitatively dominates. Line parameters 1 at 293 К: g = 2,0075; ∆H = 49,2 mT. Temperature reduction to 77 K leads to a line shift in the lower field g = 2,015 and the broadening of the line to 62 mT. State of iron complexes is paramagnetic – signal increased with decreasing temperature, g-factor equal to 4,54, typical for low-symmetric state of iron.
After grinding the sample (sediment) contains manganese oxide (line 1, Fig. 8). Line parameters have changed slightly: g = 2,013, ∆H = 50,4 mT. Iron component in the EPR spectrum is almost unnoticeable. The component containing iron, it is shifted to lower field: g = 4,54 (line 2, Fig. 8) prevails in suspension EPR spectrum.
The manganese oxide is in much smaller amount than in the initial sample (line 1a, Fig. 8). Line parameters have changed: g = 2,038, ∆H = 53 mT, it can be associated with increasing in particle fineness and surface changing. Thus, as a result of glass material grinding accompanied by cavitation enrichment effect is observed: phase manganese prevails in the sediment, and iron phase in suspensions.
Mossbauer spectra were measured with a source Co57 (Cr) on the ceramic foam before and after the dispersion are shown in Fig. 9. Spectra represent the sum of several Zeeman sextets and quadrupole doublets caused by different states and positions of iron.
Probability of the hyperfine fields in the experimental spectrum, defined for different valence states of iron, show a wide the field distribution near the 510 and 470 kOe for Fe3 + with a characteristic chemical shift value of ~ 0.3 mm/s and near 440 kOe Fe 2,5 + with a characteristic chemical shift value
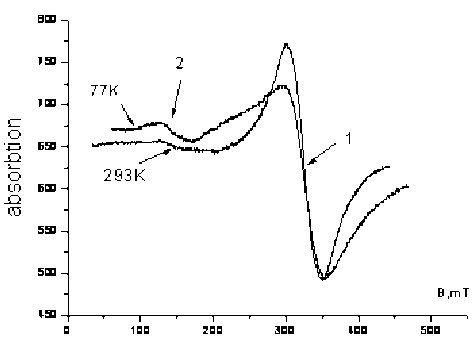
Fig. 7. EPR spectra of the glass material initial sample
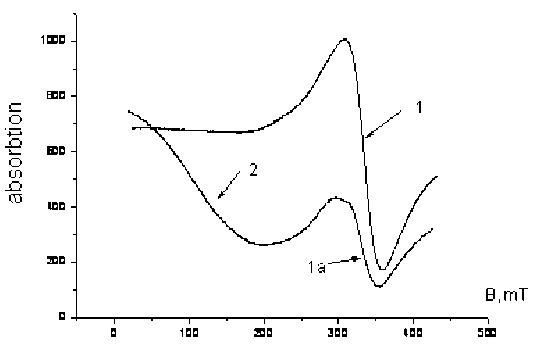
Fig. 8. EPR spectrum of sediment and glass material suspensions after dispersion
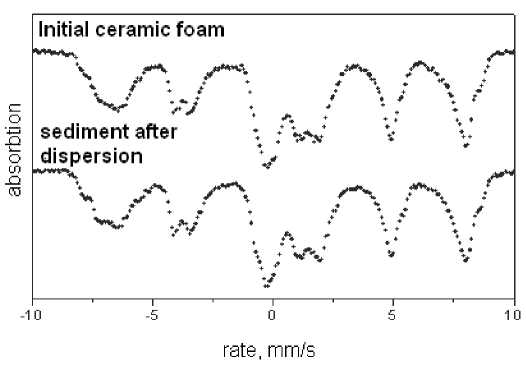
Fig. 9. Mossbauer spectra of the initial ceramic foam and sediment samples of ~ 0,7 mm/s. The appearance of mixed valence iron indicates that the sample contains magnetite. Deviation of the values of the hyperfine fields of 490 and 460 kOe inherent to stoichiometric magnetite indicates magnetite defects. Fitting model spectrum consisting of four sextets and two doublets to the experimental spectrum leads to Mossbauer parameters shown in Table 1.
Mossbauer spectroscopy results have shown that the samples contain three iron phases: hematite, magnetite and paramagnetic phase. Hematite phase has hyperfine field of ~ 510 kOe, which is less than 517 kOe in stoichiometric hematite. This decrease of the field probably related to the dilution of hematite by aluminum contained in the initial ceramic foam.
In the magnetite phase (spinel) identified tetrahedral positions Fe 3 + (A) and octahedral positions Fe3 + (B) and Fe2,5 + (B), in contrast to the stoichiometric magnetite, which are observed only two sextet: Fe 3 + (A + B) with a typical field H = 490 kOe and Fe 2,5 + (B) with a typical field 460 kOe. Initial ceramic foam contains appreciable amounts of CaO and Al2O3. Calcium and aluminum cations are capable of entering into the spinel lattice, thus Ca 2 + prefers tetrahedral and Al 3 + – octahedral spinel.
Table 1. Mossbauer parameters of iron cations in the samples of the initial ceramic foam and after dispersion (sediment)
|
IS, mm/s ±0,01 |
H, kOe ±3 |
QS, mm/s ±0,02 |
W, mm/s ±0,02 |
S, ±0,03 |
Phase |
|
|
Initial ceramic foam |
0,35 |
510 |
-0,44 |
0,26 |
0,03 |
α-Fe 2 O 3 |
|
0,28 |
476 |
-0,10 |
0,45 |
0,13 |
Fe3+(A) |
|
|
0,36 |
443 |
-0,37 |
0,93 |
0,18 |
Fe3+(B) |
|
|
0,69 |
437 |
0 |
1,08 |
0,38 |
Fe2.5+(B) |
|
|
0,28 |
0 |
1,33 |
0,78 |
0,16 |
Fe3+ |
|
|
0,97 |
0 |
1,98 |
0,95 |
0,12 |
Fe2+ |
|
|
Ceramic foam after dispersion (sediment) |
0,36 |
511 |
-0,49 |
0,30 |
0,05 |
α-Fe 2 O 3 |
|
0,30 |
475 |
-0,04 |
0,54 |
0,17 |
Fe3+(A) |
|
|
0,56 |
447 |
-0,22 |
0,66 |
0,19 |
Fe3+(B) |
|
|
0,58 |
415 |
0 |
1,36 |
0,33 |
Fe2,5+(B) |
|
|
0,29 |
0 |
1,31 |
0,77 |
0,15 |
Fe3+ |
|
|
1,03 |
0 |
2,01 |
0,89 |
0,10 |
Fe2+ |
IS – isomer chemical shift relative to α-Fe, N – hyperfine field at the iron nucleus, QS – quadrupole splitting, W – width of the absorption line, S – lobar population position.
This diamagnetic dilution of magnetite decreases the values of the hyperfine fields at the positions of the spinel and wide distribution of the fields due to the occurrence of non-equivalent positions of iron on the number of magnetic neighbors.
Cations Fe3 + and Fe2 + are found in the paramagnetic phase ceramic foam. Probably the paramagnetic phase formation is an aluminosilicate containing iron in two valence states.
Spinel formation by dispersing doesn’t experience any changes. There is only a decrease in mixed-valence cations, Fe 2,5 + and change Mossbauer parameters. This is probably due to the oxidation of magnetitethat can be the result of oxidation of the surface cations at reducing the size of spinel formation and the conversion of magnetite part to hematite.
Conclusion
Thus, studies have shown that the profound structural changes in the material occur in the process of hydrodynamic dispersion due to high energy cavitational influence. The character of changes depends on the initial state of matter. The structure of dispersible particles in the crystalline material is not similar to initial. There is not only the destruction of the initial structure, but also the formation of new crystallographic phases.
Manganese and iron in sediment and suspension of porous silica foam redistribute by grinding. The sediment contains manganese more than suspension. Potential application field of this effect is the foam exemption of transition metal impurities down to low concentrations (mass fraction %).
