Hydrothermal minerals mapping using based on remotely sensed data from Sentinel 2 sattelite: a case study in Vinh Phuc province, Northern Vietnam

Author: Trinh Le Hung
Journal: Горные науки и технологии @gornye-nauki-tekhnologii
Section: Технологическая безопасность в минерально-сырьевом комплексе и охрана окружающей среды
Article in issue: 4, 2019.
Free access
This paper presents the experiences obtained in the application of Principal Component Analysis (PCA) method to map hydrothermal minerals based on remotely sensed data. In this study, Sentinel-2B MultiSpectral Instrument (MSI) image is used to detect distribution of hydroxyl-bearing minerals in Vinh Phuc province, northern Vietnam. Four bands of Sentinel-2B image including blue band (band 2), Vegetation Red Edge band (band 8A) and SWIR bands (band 11 and 12) are used to calculate the Principal Components, thenand then select the Principal Component, which containing provides information on the hydrothermal minerals information. The obtained results findings show that the methodology and data are effective in detecting and mapping hydrothermal mineralization.
Remote sensing, hydroxyl-bearing minerals, principle component analysis, sentinel 2, vietnam, сентинель 2 (sentinel 2)
Short address: https://sciup.org/140248966
IDR: 140248966 | DOI: 10.17073/2500-0632-2019-4-309-317
Картирование гидротермальных минералов по данным дистанционного (спутникового) зондирования с использованием спектрозонального прибора Сентинель 2 на примере провинции Винь-Пхук, Северный Вьетнам
В данной статье представлен опыт, полученный при применении метода анализа главных компонентов (PCA) для картирования гидротермальных минералов на основе данных дистанционного зондирования. В этом исследовании изображения, полученные посредством дистанционного (спутникового) зондирования с использованием спектрозонального прибора Сентинель 2Б, используются для определения распределения минералов, содержащих гидроксил, в провинции Винь-Пхук, Северный Вьетнам. Четыре полосы (диапазона) изображения Сентинель 2Б, включая синюю полосу (полоса 2), полосу растительности (красный (длинноволновый) край спектра) (полоса 8A) и полосы SWIR (коротковолновая ИК область спектра, полосы 11 и 12), используются для расчета главных компонентов, а затем выбирается главный компонент, несущий информацию о гидротермальных минералах. Полученные результаты показывают, что рассматриваемые методология и данные эффективны при обнаружении и картировании гидротермальной минерализации.
Text of the scientific article Hydrothermal minerals mapping using based on remotely sensed data from Sentinel 2 sattelite: a case study in Vinh Phuc province, Northern Vietnam
Vinh Phuc province comprises many types of minerals resources, including those with significant reserves such as building stone, granite, kaolin, sand, gravel, and clay. These minerals are of great significance in development of construction industry and other sectors, contributing to the economic development in the province [19].
Remote sensing has been used for hydro-thermally altered mineral mapping and mineral prospecting [6]. The Landsat and ASTER data are the most widely used multispectral data for mapping iron oxides and hydroxyl-bearing minerals [1, 2, 4, 5, 8, 11, 12; 16]. There are many technique based on band ratio and Principal Component Analysis (PCA) applicable to detecting and mapping distribution of minerals [2, 17]. In general, these studies showed that the PCA method is able to detect and map hydrothermal minerals better than band ratio–based method.
Fraser and Green [5] developed DPCA (Directed Principal Component Analysis) method for monitoring hydrothermal minerals distribution. The DPCA method is based on the combination of advantages of the band ratio and PCA methods. Trinh and Zablotskii [17] have developed computer program RS-MINERALS to detect and map iron oxide and clay minerals from Landsat 8 OLI data.
Sentinel-2 (2 satellites: Sentinel-2A and Sentinel-2B) carried on-board high-resolution multispectral imager with 13 bands spanning VNIR through SWIR bands. Sentinel-2A data found the first use for geological applications by Van der Meer et al. in 2014 [18]. In study [18], the authors compared the performance of Senti-nel-2A MSI imager with that of the ASTER imager in mapping hydrothermal mineral areas. So far, there are a few studies on mapping and detecting minerals using Sentinel 2 MSI data [6, 9, 13, 15]. Spatial and spectral performance characteristics of the Sentinel-2 MSI are similar to those of Landsat data, and the band ratio and PCA methods can be also used to map hydrothermal minerals based on Sentinel-2 MSI data [6].
This study focuses on the application of Sentinel 2 MSI data to detect and map hydroxylbearing minerals in Vinh Phuc province, northern Vietnam. In this study, four Sentinel 2 MSI bands (band 2, 8A, 11 and 12) were used to calculate Principal Component (PC). The PC containing information concerning hydroxyl-bearing minerals was selected based on the comparison of eigenvector matrix values and then used to map hydroxyl-bearing minerals.
STUDY AREA
Vinh Phuc is the province in the Red river delta in northern Vietnam. The province is bordered to the north by Thai Nguyen and Tuyen Quang provinces, to the west by Phu Tho province, and to the south by Hanoi capital city (Fig. 1). According to the statistical yearbook 2018, Vinh Phuc province covers area of 1235.87 km2 with population of 1,092,424 people. The province is subdivided into 7 districts and 2 cities. The terrain features extend northwest – southeast, that is characteristic for the North and Northeast of Vietnam. The northern part of the province comprises Tam Dao mountain range with the highest peak of 1.592 m, and the southwestern part is surrounded by two large rivers (Red River and Lo River). The terrain altitude descends from northeast to southwest and is divided into 3 regions with characteristic topography: plains, hills, low and medium-altitude mountains [19].
MATERIALS
The Sentinel-2 mission comprises two satellites developed and launched to support vegetation, land cover, and environmental monitoring. The Sentinel-2A satellite was launched by ESA on June 23, 2015 and operates in sun-synchronous orbit at 10 day repeat cycle. The second identical satellite (Sentinel-2B) was launched on March 7, 2017. Together they cover the whole Earth’s land surface, large islands, and inland and coastal waters every five days. The Sentinel-2 MultiSpectral Instrument (MSI) acquires 13 spectral bands ranging from Visible and Near-Infrared (VNIR) to Shortwave Infrared (SWIR) wavelengths along the 290 km orbital swath. Characteristics of Sentinel 2 satellite bands are showed in Tab. 1 [14].

МИСиС
Национальный исследовательский технологический университет
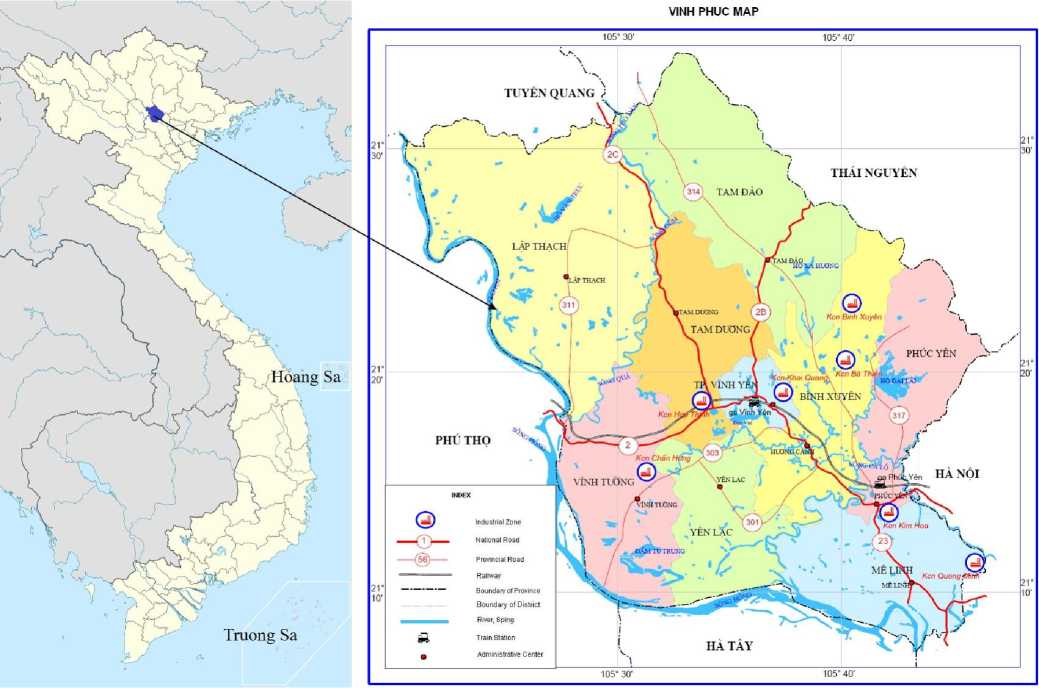
Fig. 1. Study area map, Vinh Phuc province, northern Vietnam
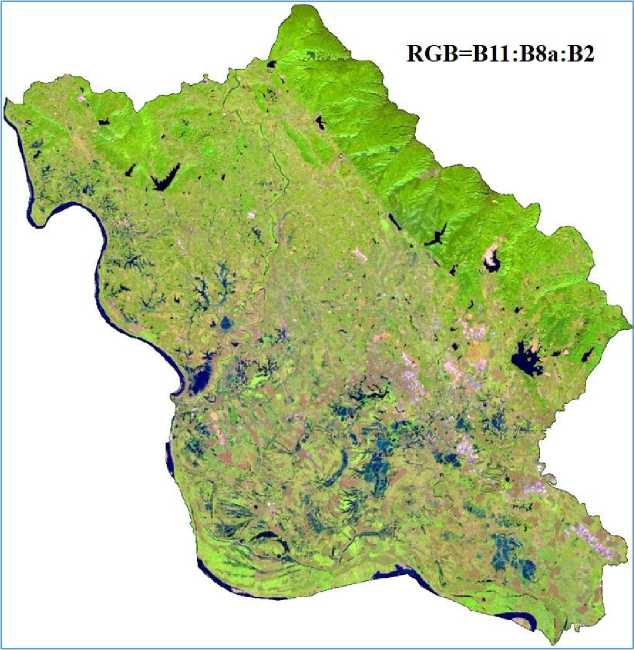
Fig. 2. Sentinel 2B multispectral image in Vinh Phuc province, RGB=B11:B8A:B2
Table 1
In this study, multispectral cloud-free Sen-tinel-2B images with spatial resolution of 10 m (bands 2, 3, 4, 8), 20 m (bands 5, 6, 7, 8A, 11, 12) and 60 m (bands 1, 9, 10), produced since December 5, 2019 in the Vinh Phuc province (northern Vietnam) were used for mapping hydroxyl-bearing minerals distribution (Fig. 2). The Sentinel-2B data presented the L2A level product, downloaded from Copernicus Open Access Hub ( https://scihub.copernicus.eu ) website. The Level-2A product provides Bottom Of Atmosphere (BOA) reflectance images derived from the associated Level-1C products. The comparison of the nominal band centers, bandwidths, and spatial resolution of Sentinel-2 MSI and Landsat 8 OLI bands is presented in Tab. 2 [14].
METHODS AND FINDINGS
The image processing started with radiometric and geometric correction. At the next step, the Sentinel-2B MSI images were subdivided into subsets for the study area. In this study, image processing was performed using ERDAS Imagine 2014 programs, and hydroxylbearing distribution map was created using ArcGIS 10 program.
The PCA method uses the Principal Components transformation technique for reducing dimensionality of correlated multispectral data [10]. The analysis is based on multivariate statistical technique, which selects uncorrelated linear combinations (eigenvector loadings) of variables in such a way that each successively extracted linear combination, or Principal Component
Sentinel-2 band characteristics
|
Sentinel - 2 Bands |
Central wavelength (µm) |
Resolution (m) |
|
Band 1 – Coastal aerosol |
0.443 |
60 |
|
Band 2 – Blue |
0.490 |
10 |
|
Band 3 – Green |
0.560 |
10 |
|
Band 4 – Red |
0.665 |
10 |
|
Band 5 – Vegetation Red Edge |
0.705 |
20 |
|
Band 6 – Vegetation Red Edge |
0.740 |
20 |
|
Band 7 – Vegetation Red Edge |
0.783 |
20 |
|
Band 8 – NIR |
0.842 |
10 |
|
Band 8A – Vegetation Red Edge |
0.865 |
20 |
|
Band 9 – Water vapour |
0.945 |
60 |
|
Band 10 – SWIR-Cirrus |
1.375 |
60 |
|
Band 11 – SWIR |
1.610 |
20 |
|
Band 12 – SWIR |
2.190 |
20 |
Table 2
Comparison of the nominal band centers, bandwidths, and spatial resolution of Sentinel-2 MSI and Landsat 8 OLI
Nominal band centers (nm)
|
MSI |
444 |
497 |
560 |
664 |
704 |
740 |
783 |
843 |
865 |
1613 |
2190 |
|
OLI |
443 |
482 |
561 |
665 |
NA |
NA |
NA |
NA |
865 |
1609 |
2201 |
|
Nominal bandwidths (nm) |
|||||||||||
|
MSI |
20 |
55 |
35 |
30 |
15 |
15 |
15 |
115 |
20 |
90 |
175 |
|
OLI |
20 |
65 |
60 |
40 |
NA |
NA |
NA |
NA |
30 |
85 |
190 |
|
Spatial resolution (m) |
|||||||||||
|
MSI |
60 |
10 |
10 |
10 |
20 |
20 |
20 |
10 |
20 |
20 |
20 |
|
OLI |
30 |
30 |
30 |
30 |
NA |
NA |
NA |
NA |
30 |
30 |
30 |
Table 3
The eigenvector matrix values and eigenvalues of PCA for 2, 8A, 11, 12 bands of Sentinel -2B MSI images
|
Principal Component |
Eigen matrix |
Eigenvalues (%) |
|||
|
B2 |
B8A |
B11 |
B12 |
||
|
PC1 |
0.1081 |
0.5628 |
0.6353 |
0.5176 |
67.442 |
|
PC2 |
-0.2599 |
0.7834 |
-0.2295 |
-0.5159 |
29.316 |
|
PC3 |
-0.9335 |
-0.1952 |
0.2980 |
0.0414 |
2.601 |
|
PC4 |
-0.2222 |
0.1774 |
- 0.6745 |
0.6813 |
0.941 |
(PC), has smaller variance [12]. The statistical variance in multispectral images is related to the spectral response of various surficial materials such as rocks, soils, and vegetation, and it is also influenced by the statistical dimensionality of the image data [10]. Eigenvalues provide information (using magnitude and sign) about spectral properties of vegetation, rocks and soils, which are responsible for statistical variance mapped into each PC [12].
Hydroxyl-bearing minerals, which have spectral diagnostic feature in the 2.10 – 2.28 μm [3, 7], can cause low reflectance in the Sentinel-2B MSI band 12 (2.180 – 2.200 µm). These minerals also have very high reflectance in the Sentinel-2B MSI band 11 (1.600 – 1.620 µm). Similar to Crosta technique using Landsat TM images, which adopts the association of bands 1, 4, 5 and 7, hydroxyl-bearing minerals are extracted by the combination of Sentinel-2B MSI bands 2, 8A, 11, 12.
The four Principal Components transformation on unstretched bands 2, 8A, 11, 12 of Sentinel-2B image of Vinh Phuc province are shown in Fig. 3. As can be seen, PC1 – the "albedo" image, is about 67.442 % of eigenvalue of the total variance for the unstretched data PCA. PC2 comprises 29.316 % information, PC3 comprises 2.601 % information and PC4 comprises 0.5 % information of four Sentinel-2B bands. In this study area, PC4 highlights hydrox-yl-containing minerals as dark pixels because of the greatest loading of band 11 ( - 0.6745) and
band 12 (0.6813) (Tab. 3). The hydroxylcontaining minerals are manifested as dark pixels because the positive loading at band 12, and the bands need to be reversed. Fig. 4 shows the PC4 reverse, in which the bright pixels represent hydroxyl-bearing minerals.
The anomalies for hydroxyl-bearing minerals are determined based on threshold of μ + 2σ, where μ and σ represent the mean value and standard deviation of the relevant Principal Component images, respectively [6]. In this study, the threshold value is 6439.928. Fig. 5 shows the final result for hydroxylbearing minerals derived from Sentinel-2B MSI data in Vinh Phuc province, in which the hydroxyl-bearing minerals are depicted by blue color. The results presented in this figure show that the hydroxyl-bearing minerals in Vinh Phuc province are concentrated in the central and northwestern parts. This is also consistent with the Vinh Phuc mineral distribution map at a scale of 1 : 200 000 [20].
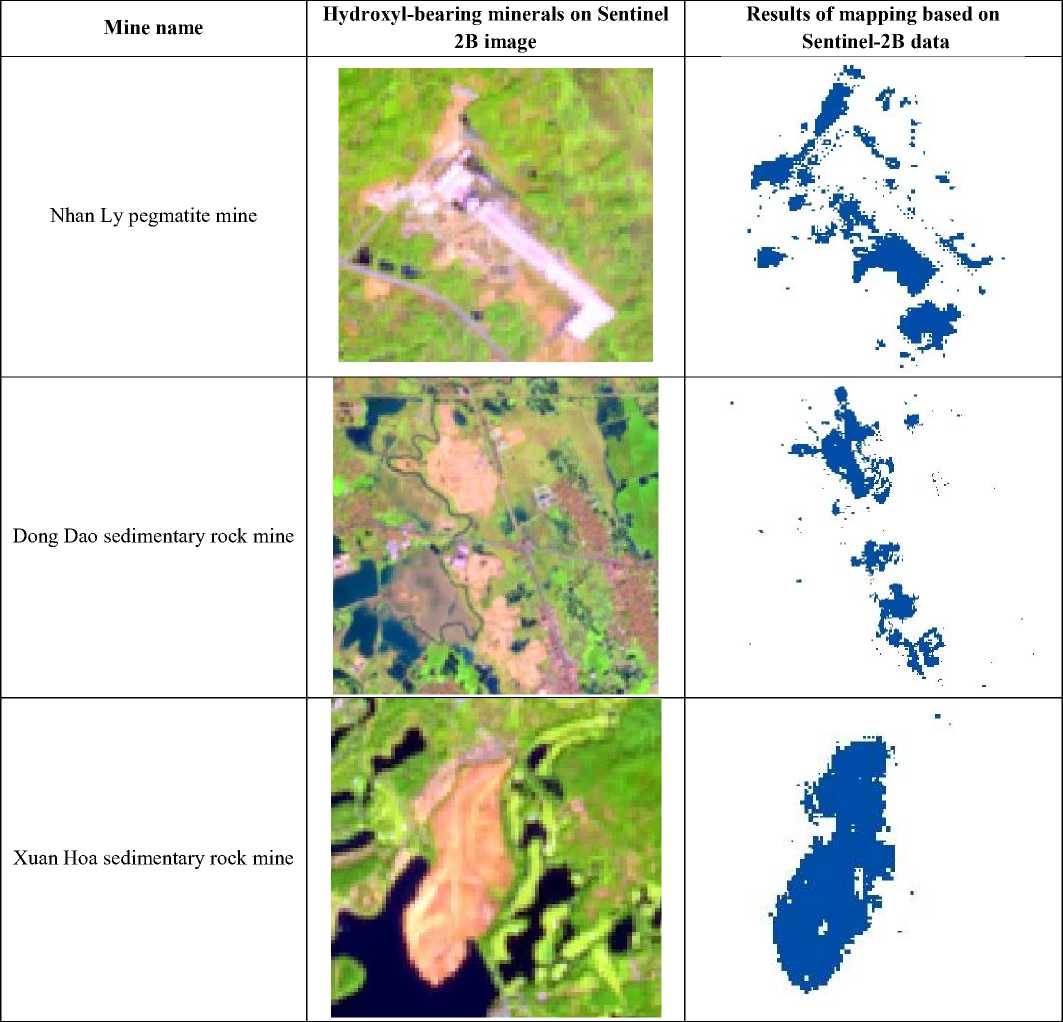
In this study, the authors also compared the results of mapping hydroxyl-bearing minerals in mines of Vinh Phuc province and their images based on the Sentinel-2B MSI data (Tab. 4). Tab. 4 shows that the mines bearing hydroxylcontaining minerals such as Nhan Ly pegmatite mine, Dong Dao and Xuan Hoa sedimentary rock mines have been correctly mapped based on the Sentinel-2B MSI data using PCA method.
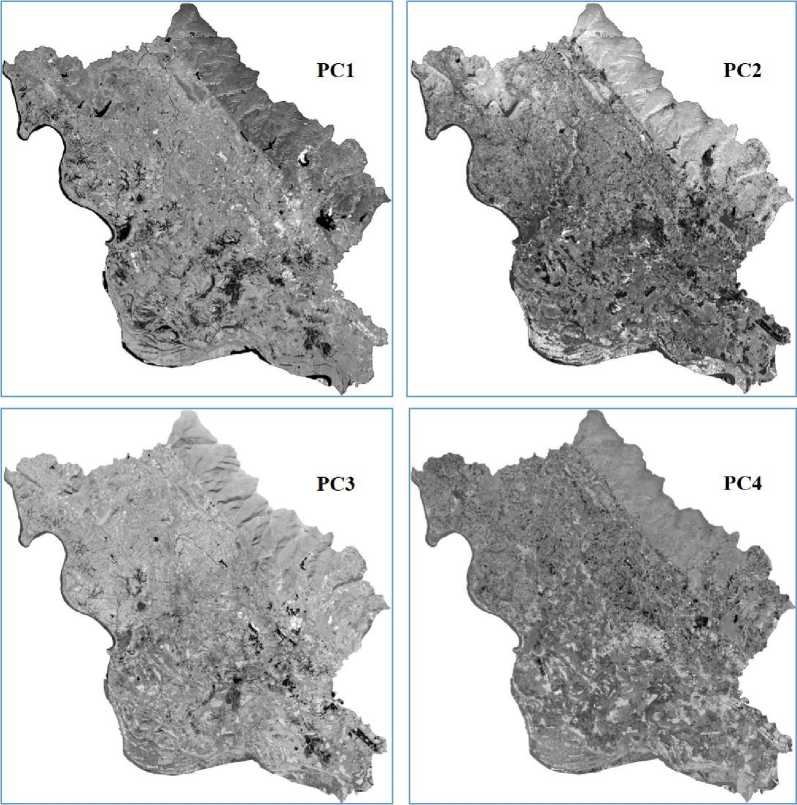
Fig. 3. Principal Component Analysis for mapping hydroxyl-bearing minerals in Vinh Phuc province, northern Vietnam
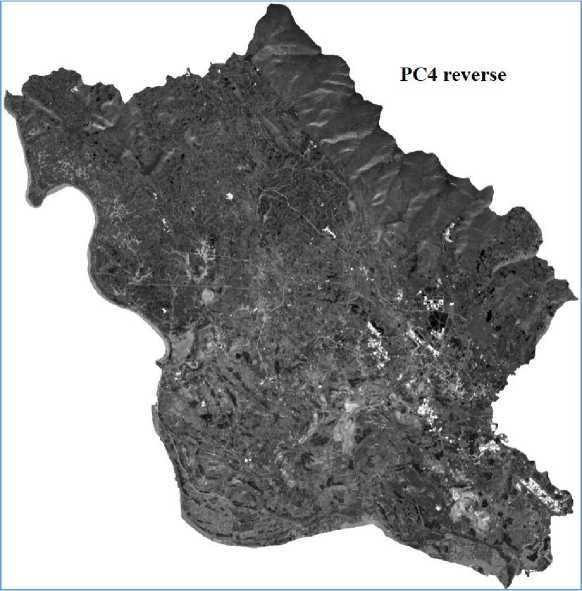
Fig.4. PC4 reverse, bright pixels represent the hydroxyl-bearing minerals
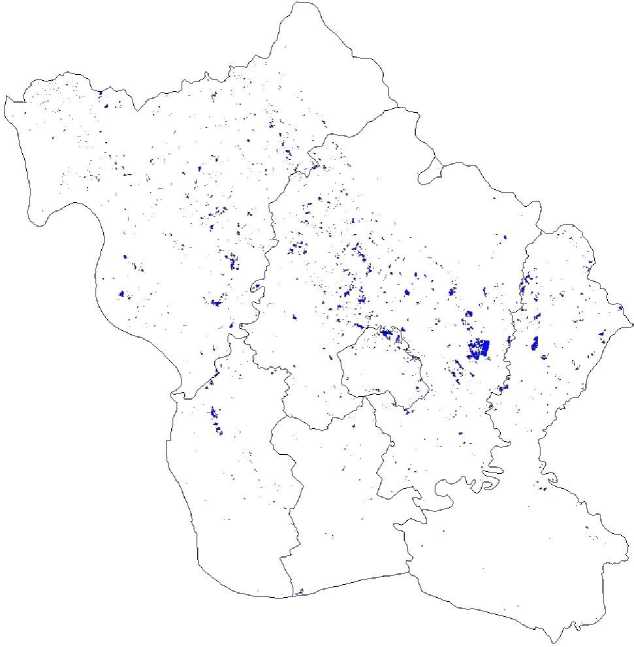
Fig. 5. Results of mapping the hydroxyl-bearing minerals (blue color) in Vinh Phuc province using Sentinel-2B image
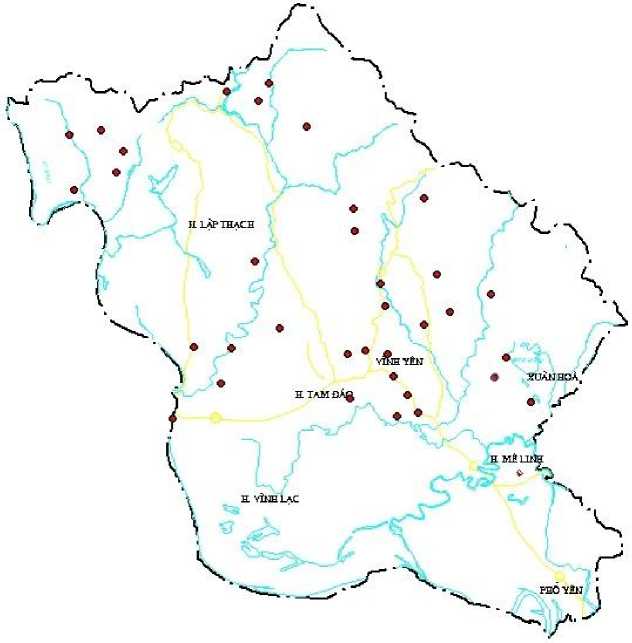
Fig. 6. Mineral distribution map of Vinh Phuc province [20]
Table 4
Hydroxyl-bearing minerals in mines of Vinh Phuc province (northern Vietnam) and results of mapping based on the Sentinel-2B data
CONCLUSION
This study attests to the significance and advantages of the application of Sentinel-2 MSI data to detect and map hydrothermal alteration zones. The Sentinel-2B MSI image produced on December 5, 2019 was analyzed to map spatial distribution of hydroxyl-bearing minerals in Vinh Phuc province (northern Vietnam). Four Sentinel-2B MSI bands (2, 8A, 11 and 12) were used to calculated Principal Components, and
then select the Principal Component which contains the basic information of hydroxyl-bearing minerals. The 4th Principal Component clearly identifies the area comprising hydroxylcontaining altered minerals in this region. The results obtained in this study show that the Sentinel-2 MSI image with spatial resolution exceeding that of Landsat image can be effectively used in mapping hydrothermal mineral distribution.
References Hydrothermal minerals mapping using based on remotely sensed data from Sentinel 2 sattelite: a case study in Vinh Phuc province, Northern Vietnam
- Abrams M. J. (1983). Remote sensing of porphyry copper in Southern Arizona, Economic Geology, 78, 591-604.
- Crosta A. P., Moore J. M. (1989). Enhancement of LANDSAT Thematic Mapper imagery for residual soil mapping in SW Minas Gerais State Brazil: a prospecting case history in greenstone belt terrain, Proceedings of the 9th Thematic Conference on Remote Sensing for Exploration Geology, Calgary (Ann Arbor, MI: Environmental Research Institute of Michigan), pp. 1173-1187.
- Clark R. N., Swayze G. A., Wise R., Livo K. E., Hoefen T. M., Kokaly R. F., Sutley S. J. (1989). USGS Digital Spectral library, USGS Open file Rep.
- Fongaro C., Dematte J., Rizzo R., Safanelli J., Mendes W., Dotto A., Vicente L., Franceschini M., Ustin S. (2018). Improvement of Clay and Sand Quantification Based on a Novel Approach with a Focus on Multispectral Satellite Images, Remote Sensing, 10, 1555, DOI: 10.3390/rs10101555
- Fraster S. J., Green A. A. (1997). A software defoliant for geological analysis of band ratio, International Journal of Remote Sensing, Vol.8, 525 - 532.
- Hu B., Xu Y., Wan B., Wu X., Yi G. (2018). Hydrothermally altered mineral mapping using synthetic application of Sentinel-2A MSI, ASTER and Hyperion data in the Duolong area, Tibetan Plateau, China, Ore Geology Reviews, 101, 384 - 397.
- Hunt G. R., Ashley R. P. (1979). Spectra of altered rocks in the visible and near infrared, Economic Geology, Vol. 74, 1613 - 1629.
- Kaufman H. (1988). Mineral exploration along the Agaba-Levant structure by use of TM-data concepts, processing and results, International Journal of Remote Sensing, 9: 1630-1658.
- Lobo F., Souza-Filho P., Novo E., Carlos F., Barbosa C. (2018). Mapping mining areas in the Brazilian Amazon using MSI/Sentinel-2 imagery (2017), Remote Sensing, 10, 1178, 15 pp.
- Loughlin W. P. (1991). Principal component analysis for alteration mapping, Photogrammetric Engineering and Remote Sensing, 57(g), 1163-1169
- Mahboob M., Genc B., Celik T., Ali S. Atif I. (2019). Mapping hydrothermal minerals using remotely sensed reflectance spectroscopy data from Landsat, Journal of the Southern African Institute of Mining and Metallurgy, Vol.119(3), 279 - 289.
- Mia M.B., Fujimitsu Y. (2012). Mapping hydrothermal altered mineral deposits using LANDSAT 7 ETM+ image in and around Kuju volcano, Kyushu, Japan, Journal Earth System Science, Vol. 121(4), pp.1049 - 1057.
- Mielke C., Bosche N., Rogass C., Segl K., Cauert C., Kaufmann H. (2014). Potential applications of the Sentinel-2 multispectral sensor and the Enmap hyperspectral sensor in mineral exploration, EARSeL e Proceedings 13, 93 - 102.
- Pahlevan N., Sarkar S., Franz B., Balasubramanian S., He J. (2017). Sentinel-2 MultiSpectral Instrument (MSI) data processing for aquatic science applications: Demonstrations and validations, Remote Sensing of Environment, Vol. 201, 47-56
- Pour A. B., Park T., Park Y., Hong J., Zoheir B., Pradhan B., Ayoobi I., Hashim M. (2018). Application of Multi-Sensor Satellite Data for Exploration of Zn-Pb Sulfide Mineralization in the Franklinian Basin, North Greenland, Remote Sensing, 10(8), 1186,
- DOI: 10.3390/rs10081186
- Trinh L.H. (2016). Application of remote sensing technique to detect and map iron oxide, clay minerals and ferrous minerals in Thai Nguyen province, Mining Science and Technology, Vol. 1, 60 - 66.
- Trinh L.H., Zablotskii V.R. (2019). The Method of Detection of Clay Minerals and Iron Oxide Based on Landsat Multispectral Images (as Exemplified in the Territory of Thai Nguyen Province, Vietnam), Mining Science and Technology, Vol.4(1), 65 - 75.
- Van der Meer F. D., van der Werff H. M. A., van Ruitenbeek F. J. A. (2014). Potential of ESA's Sentinel-2 for geological applications, Remote Sensing of Environment, 148, 124-133.
- www.vinhphuc.gov.vn.
- http://idm.gov.vn.
