Identification and Classification of Adenovirus Particles in Digital Microscopic Images using Active Contours

Author: Manjunatha Hiremath
Journal: International Journal of Modern Education and Computer Science (IJMECS) @ijmecs
Article in issue: 6 vol.6, 2014.
Free access
Medical imaging is the technique and process used to create images of the human body or medical science. Digital image processing is the use of computer algorithms to perform image processing on digital images. Microscope image processing dates back a half century when it was realized that some of the techniques of image capture and manipulation, first developed for television, could also be applied to images captured through the microscope. This paper presents semi-automated segmentation and identification of adenovirus particles using active contour with multi grid segmentation model. The geometric features are employed to identify the adenovirus particles in digital microscopic image. The min-max, 3 rules are used for recognition of adenovirus particles. The results are compared with manual method obtained by microbiologist.
Medical image processing, adenovirus, active contour multigrid, identification, classification
Short address: https://sciup.org/15014663
IDR: 15014663
Text of the scientific article Identification and Classification of Adenovirus Particles in Digital Microscopic Images using Active Contours
The digital revolution has touched most aspects of modern life, including entertainment, communication, and scientific research. Nowhere has the change been more fundamental than in the field of microscopy. Researchers who use the microscope in their investigations have been among the pioneers who applied digital processing techniques to images. Many of the important digital image processing techniques that are now in widespread usage were first implemented for applications in microscopy. At this point in time, digital image processing is an integral part of microscopy, and only rarely will one see a microscope used with only visual observation or photography.
Microscope imaging and image processing are of increasing interest to the scientific and engineering communities. Recent developments in cellular-, molecular-, and nanometer-level technologies have led to rapid discoveries and have greatly advanced the frontiers of human knowledge in biology, medicine, chemistry, pharmacology, and many related fields. The successful completion of the human genome sequencing project, for example, has unveiled a new world of information and laid the groundwork for knowledge discovery at an unprecedented pace.
Microscopes have long been used to capture, observe, measure, and analyze the images of various living organisms and structures at scales far below normal human visual perception. With the advent of affordable, high-performance computer and image sensor technologies, digital imaging has come into prominence and is replacing traditional film-based photomicrography as the most widely used method for microscope image acquisition and storage. Digital image processing is not only a natural extension but is proving to be essential to the success of subsequent data analysis and interpretation of the new generation of microscope images. There are microscope imaging modalities where an image suitable for viewing is only available after digital image processing. Digital processing of microscope images has opened up new realms of medical research and brought about the possibility of advanced clinical diagnostic procedures.
Over 400 years ago, the optical microscope has seen steady improvement and increasing use in biomedical research and clinical medicine as well as in many other fields. Today many variations of the basic microscope instrument are used with great success, allowing us to peer into spaces much too small to be seen with the unaided eye. More often than not, in this day and age, the images produced by a microscope are converted into digital form for storage, analysis, or processing prior to display and interpretation. Digital image processing greatly enhances the process of extracting information about the specimen from a microscope image. For that reason, digital imaging is steadily becoming an integral part of microscopy. Digital processing can be used to extract quantitative information about the specimen from a microscope image.
The object of interest is the specimen that is placed under the microscope. The instrument forms an optical image that represents that specimen. We assume that the optical image is well represented by a continuous image (which is an analytic function), and we strive, through the choices available in microscopy, to make this be the case. Further, the optical image is sampled and quantized in such a way that the information relevant to the problem at hand has been retained in the digital image. We can interpolate the digital image to produce an approximation to the continuous image or to make it visible for interpretation. We must now process the digital image, either to extract quantitative data from it or to prepare it for display and interpretation by a human observer.
A virus is an infectious agent too small to be seen directly with a light microscope. They are not made of cells and can only replicate inside the cells of another organism (the viruses' host). Viruses infect all types of organisms, from animals and plants to bacteria and archaea. Viruses are found in almost every ecosystem on Earth and these minute structures are the most abundant type of biological entity. Viruses consist of two or three parts: all viruses have genes made from either DNA or RNA, long molecules that carry genetic information; all have a protein coat that protects these genes; and some have an envelope of fat that surrounds them when they are outside a cell. Viruses vary from simple helical and icosahedral shapes, to more complex structures. Most viruses are about one hundred times smaller than an average bacterium. Viruses spread in many ways; plant viruses are often transmitted from plant to plant by insects that feed on sap, such as aphids, while animal viruses can be carried by blood-sucking insects. Influenza viruses are spread by coughing and sneezing.
Adenoviruses are medium–sized (90-100 nm), nonenveloped (without an outer lipid bilayer) icosahedral viruses composed of a nucleocapsid and a doublestranded linear DNA genome. There are 55 described serotypes in humans, which are responsible for 5–10% of upper respiratory infections in children, and many infections in adults as well.
Viruses of the Adenoviridae family infect various species of vertebrates, including humans. Adenoviruses were first isolated in 1953 from human adenoids. They are classified as group I under the Baltimore classification scheme, meaning their genomes consist of double stranded DNA.
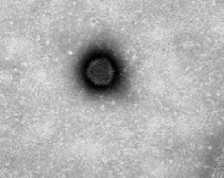
Fig 1: Transmission electron micrograph image of adenovirus particles
Segmentation of cell regions is an important step in computer-aided analysis of adenovirus particle images in microbiology. Accurate and reliable segmentation is an essential step in determining valuable quantitative information on size, shape and texture, which may assist microbiologists in their diagnoses. Parametric algorithms were recently introduced for segmentation of cell images with elliptically shaped cells or cells whose contours were relatively smooth. The snakes or active contours, are used extensively in computer vision and image processing applications, particularly to locate object boundaries. Nonparametric algorithms can generally be categorized as region-based, edge-based, histogram-based, clustering and neural network based algorithms[1-3].
Automated image analysis of adenovirus particles will play an important role to identify adenovirus particles by using digital image processing techniques. In the past decades, many researchers have already investigated the segmentation and identification rotavirus particles using statistical analysis have been carried out by Venkataraman, et al. [4]. Active contours without edges based on Mumford-Shah segmentation techniques and the level set method has been investigated by Tony F. Chan[8]. The object identification by using snakes, shapes and gradient vector flow has been performed by Chenyang Xu and Jerry[9]. Edge segmentation and feature extraction using snakes active contour models has been done by Michaels Kass[10]. Multigrid geometric active contour models for segmenting and tracking object in image analysis and computer vision has been proposed by George Papandreou and Petros Maragos[12], Automated identification and classification of Rotavirus-A particles using marker controlled watershed algorithm is investigated by Hiremath et al.[7]. In this paper, the objective is to propose a method to segment and identify the Adenovirus particles in digital microscopic images using active contour model. Geometric features are used to identify the Adenovirus particles.
-
II. Materials and Methods
Adenovirus particle images from Transmission Electron Microscopy are acquired by using different types of staining methods. Negative staining is an established method, often used in diagnostic microscopy, for contrasting a thin specimen with an optically opaque fluid. For bright field microscopy, negative staining is typically performed using a black ink fluid such as nigrosin. The specimen, such as a wet bacterial culture spread on a glass slide, is mixed with the negative stain and allowed to dry. When viewed with the microscope the Adenovirus particles, and perhaps their spores, appear light against the dark surrounding background. Acquisition of Adenovirus particle images is usually done using a CCD camera mounted in the optical path of the microscope. The camera may be full colour or monochrome. Very often, very high resolution cameras are employed to gain as much direct information as possible. Often digital cameras used for this application provide pixel intensity data to a resolution of 12-16 bits. We have considered 100 color images of Adenovirus particles (non-overlapping) with x92,000 (80kv, 200nm) magnification for present study and these are converted into grayscale images[2,3][18].
-
III. Proposed Method
Snakes or active contours, are curves defined within an image domain that can move under the influence of internal forces coming from within the curve itself and external forces computed from the image data. The internal and external forces are defined so that the snake will conform to an object boundary or other desired features within an image. Snakes are widely used in many applications, including edge detection, shape modeling, segmentation, and motion tracking.
The basic idea in active contour models or snakes is to evolve a curve, subject to constraints from a given image u0, in order to detect objects in that image. For instance, starting with a curve around the object to be detected, the curve moves towards its interior normal and has to stop on the boundary of the object.
Let Ω be a bo u nded open subset of R2, with ∂Ω its boundary. Let u0: Q^ R be a given image, and C(s) : [0,1] -> R2 be a parameterized curve.
In the classical snakes and active contour models[12-15], an edge-detector is used, depending on the gradient of the image u0, to stop the evolving curve on the boundary of the desired object. The snake model is :infC J1(C), where
J1(C) =aJ01|C'(s)|2ds + eJ01|C"(s)l2ds...(1) - Xjo1|Vuo(C(s))|2ds
Here α , β and λ are positive parameters. The first two terms control the smoothness of the contour(the internal energy), while the third term attracts the contour toward the object in the image (the external energy). Observe that, by minimizing the energy (1), we are trying to locate the curve at the points of maxima | V u0|, acting as an edge-detector, while keeping a smoothness in the curve (object boundary).
A general edge-detector can be defined by a positive and decreasing function g, depending on the gradient of the image u0, such that
lim g(z) = 0
П^Ю
For instance
'■■ = „|v6,(„),Uo(„,)|„ , Pi1
Where G O * u0, a smoother version of u0, is the convolution of the image u0 with the Gaussian G O (x,y)= о -1/2е- 1 ж2+у2 1/ 4 0 . The function g(| V u0|) is positive in homogeneous regions, and zero at the edges[14].
The proposed method for the segmentation and identification of adenovirus particles using multigrid active contour is given below:
Algorithm 1: Training phase
Step 1: Input the adenovirus colour image.
Step 2: If the given image is color then convert it into gray scale image and adjust the image intensity values.
Step 3: Perform multigrid geometric active contour model upto N iterations to obtain segmented image, where N is the number of iterations required for the snake curve to reach the object boundary and does not move thereafter.
Step 4: Binarize the segmented image of Step 3.
Step 5: Remove the border touching cells obtained in binary image and then perform labeling the segmented binary image.
Step 6: For each labeled segment, compute geometric shape features x i , i=1,2,...,7 (i.e, Area,
Eccentricity, Perimeter, Circularity, Tortuosity, Length/Width ratio, Compactness, respectively), for each particle.
Step 7: Repeat steps 1 to 6 for all the training images.
Step 8: Compute minimum minx i and maximum maxx i of feature values xi, i=1,2,...,7, of adenovirus particle and store them as knowledge base.
Algorithm 2: Testing phase
Step 1: Input the adenovirus colour image.
Step 2: If the given image is color then convert it into gray scale image and adjust the image intensity values.
Step 3: Perform multigrid geometric active contour model upto N iterations to obtain segmented image, where N is the number of iterations required for the snake curve to reach the object boundary and does not move thereafter.
Step 4: Binarize the segmented image of Step 3.
Step 5: Remove the border touching cells obtained in binary image and then perform labeling the segmented binary image.
Step 6: For each labeled segment, compute geometric shape features xi, i=1,2,...,7 (i.e, Area, Eccentricity, Perimeter, Circularity, Tortuosity, Length/Width ratio, Compactness, respectively), for each segment.
Step 7: Apply min-max rule for identification of the adenovirus particles: A segmented region is of adenovirus, if its feature values lie in their corresponding min-max range, i.e., x i lies in [minx i , maxx i ], i=1,2,...,7.
Step 8: Repeat the Steps 6 and 7 for all labeled segments and output the identified Adenovirus particles.
The value of N, the number of iterations, is empirically determined and depends upon the image set in general. For the experimental data set considered in the present study, N is found to be 300.
3 σ classification rule:
The above algorithm for training phase can be modified to compute the mean and standard deviation of feature values x i , i=1,2,...,7, for known adenovirus particles and store them as the knowledge base, x i and O i , i=1,2,...,7. The algorithm for classification phase can be modified to apply the following classification rule in the
Step 7 : A segmented region is adenovirus particle if its feature values lie in the 3 o interval, i.e., x i lies in [3orX , , 3 o i +X i ], i=1,2,...,7.
-
IV. Experimental Results
For the purpose of experimentation, 100 digital images of adenovirus particles (non-overlapping) with x92,000 (80kv,200nm) magnification are considered and these are taken from transmission electron microscopy. The implementation is done on an Intel core 2 duo processor @ 2.83GHz machine using MATLAB® 7.9. In the training phase, the input Adenovirus particle image is converted into grayscale and adjust the image intensity values using MATLAB® function (Fig .2(a)). The resultant image is segmented using active contour multigrid model initiated by multigrid circular masks (Fig .2(b)) on whole image(Fig .2(c)) to obtain binary image(Fig .2(d)). Then, the segmented image is labeled and for each segmented region (known particles), the geometric features are extracted.
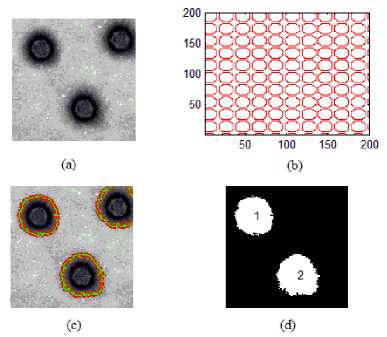
Fig 2: (a) Original Adenovirus TEM image, (b) Initializing circular multigrid, (c) Image shown after 300 iterations, (d) Global region based segmentation.
The Table 1 presents the geometric feature values computed for the segmented Adenovirus particle regions of the image in Fig 2(d). The minimum and maximum values of geometric features and also their mean and standard deviation obtained from the training sample images are stored in the knowledge base of the Adenovirus particle, which is presented in the Table 2. Some sample training images of Adenovirus are shown in the Fig.3.
In the testing phase, the test image is segmented by the proposed method, and the feature extraction for each segment is done. If the feature values lie in the corresponding min-max ranges of feature values in the knowledge base of Adenovirus particle, the labeled segment is identified as a Adenovirus particle; otherwise, it is not a Adenovirus particle. The classification experiments are also done using 3 σ rule. The proposed method, based on min-max classification rule, is computationally less expensive and yet yields comparable identification rate of 91% for Adenovirus particles. However, the proposed method yields 93.5% classification rate using 3 σ classification rule.
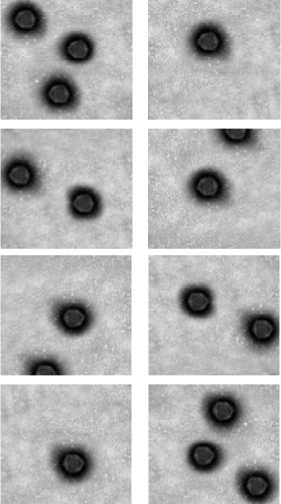
Fig 3: Some sample training images of Adenovirus particles.
-
V. Conclusion
In this paper, we have proposed a method for segmentation and identification of Adenovirus particles in transmission electron microscope images using multigrid geometric active contour model. The geometric features of Adenovirus particles are considered. The experimental results are confirmed by visual inspection conducted by microbiological experts. The proposed method is more reliable and computationally less expensive. It yields an identification rate of 91% for Adenovirus particle for min-max rule. However, the proposed method yields 93.5% classification rate using 3 σ classification rule. It could be improved further by better pre-processing methods, feature sets and classifiers. This algorithm may also use for other virus particles in future work.
References Identification and Classification of Adenovirus Particles in Digital Microscopic Images using Active Contours
- Rafel C. Gonzalez and Richard E. Woods, Digital image processing, Pearson Education Asia (2002).
- M. A. Hayat, Principles and techniques of electron microscopy: biological applications. Cambridge University Press. pp. 45-61. ISBN 0521632870 (2000).
- Bozzola, John J.; Russell, Lonnie D. Specimen preparation for transmission electron microscopy. Jones and Bartlett. pp. 21–31. ISBN 9780763701925 (1999).
- S. Venkataraman, D.P. Allison, H. Qi, J.L. Morrell-Falvey, N.L. Kallewaard, J.E. Crowe Jr. and M.J. Doktycz. Automated image analysis of atomic force microscopy images of rotavirus particles. Ultramicroscopy, Elsevier, Vol. 106, 2006, pp. 829-837.
- P.S. Hiremath and ParashuramBannigidad , Automatic classification of bacterial cells in digital microscopicimages, Intl. Jl. of Engg. and Tech. (IJENGG), Vol.2, No.4, Dec. 2009, pp. 09-15.
- Dennis Kunkel Microscopy, Inc, Science Stock Photography, http://www.denniskunkel.com.
- P.S.Hiremath, Parashuram Bannigidad, Manjunath Hiremath, Automated Identification and Classification of rotavirus-A particles in digital microscopic images, Nat.Conf. on Recent Trends in Image Processing and Pattern Recognition (RTIPPR-2010), February 15-16,2010,Bidar, pp 69-73(2010).
- Tony F Chan, Luminita A. Vese, Active contours without edges, IEEE Transaction on Image Processing, Vol. 10, No. 2, February 2001, pp266-277.(2001).
- ChenyangXu, Jerry L Prince, Snakes, Shapes, and Gradient Vector Flow, IEEE Transactions on Image Processing, Vol. 7, No. 3, March 1998, pp 359-369.
- Michael Kass, Andrew witkin and demetri, Snakes: Active contour models, Intl. J. of Computer Vision, pp. 321-331.(1998).
- S.Osher and J.A.Sethian , Fronts propagating with curvature dependent speed : Algorithm based on Hamilton Jacobi Formulation, J. Compact Phy, Vol. 79, 1988, pp.12-49.
- George Papandreou and Petros Maragos, Multigrid Geometric Active Contour Model, IEEE transactions on image processing, Vol., 16, No XX. 2007, pp1-11.
- V.Caselles, R. Kimmel and G Sapiro, Geodesic active contours, Int'l J. Comp. Vision Vol.22 No.1, pp 61-69.(1997).
- Yezzi, S.Kichenassamy, A.Kumar, P. Olver and A. Tannenbaum, A geometric snake model for segmentation of medical imagery, IEEE Trans. Med. Imag., Vol 10, No 2,pp 199-209(1997).
- Brandt, Multi-level adaptive solutions to boundary – value problems, Math. Comp. Vol. 31 No.138,pp 333-390(1977).
- P.S.Hiremath, Parashuram Bannigidad, Manjunath Hiremath, Segmentation and Identification of rotavirus-A in digital microscopic images using active contour model, International Conference on Contours of Computing Technology (ThinkQuest-2010), 13-14 March 2010, Mumbai, India, pp 192-196(2010).
- Robinson CM, Singh G, Henquell C, Walsh MP, Peigue-Lafeuille H, Seto D, Jones MS, Dyer DW, Chodosh. Computational analysis and identification of an emergent human adenovirus pathogen implicated in a respiratory fatality. J. Virology. 2011 Jan 20; 409(2):141-7. doi:10.1016/j.virol.2010.10.020.
- QiangWu, Fatima Merchant, K.R.Castleman, "Microscope Image Processing",Elsevier Academic Press(2008).
