Identification of a Better Laptop with Conflicting Criteria Using TOPSIS

Author: T. Miranda Lakshmi, V. Prasanna Venkatesan, A. Martin
Journal: International Journal of Information Engineering and Electronic Business(IJIEEB) @ijieeb
Article in issue: 6 vol.7, 2015.
Free access
Multi Criteria Decision Making (MCDM) methods are useful for evaluating several complex factors of multiple selection problems. The Multi-Objective problems are an extension of Single-Objective problems. The goal of MCDM is to help the decision maker to make a choice among a finite number of alternatives or to sort or rank a finite set of alternatives in terms of multiple criteria. Among the MCDM methods, the most widely applied method is TOPSIS. It is applied for different kinds of MCDM problems. In laptop selection process, it is difficult to select better laptop because relatively all laptops are seems to be same. By applying the TOPSIS method to the alternatives it is simple to differentiate the laptops from one another. The better laptop has been selected using TOPSIS based on conflicting criteria such as warranty, size, battery life, specification and others. This methodology also has been evaluated by MCDM evaluation metrics such as Time and Space Complexity, Sensitivity Analysis, ranking reversal and relative closeness coefficient.
Multi Criteria Decision Making (MCDM), TOPSIS, evaluation metrics, laptop selection, ranking efficiency
Short address: https://sciup.org/15013378
IDR: 15013378
Text of the scientific article Identification of a Better Laptop with Conflicting Criteria Using TOPSIS
Published Online November 2015 in MECS DOI: 10.5815/ijieeb.2015.06.05
-
I. I ntroduction
Decision-making can be regarded as the cognitive process resulting in the selection of a belief or a course of action among several alternative possibilities. It is the study of identifying and choosing alternatives based on the values and preferences of the decision maker. Multicriteria decision making (MCDM) is the process of finding the best alternative from all of the feasible alternatives where all the alternatives can be evaluated according to a number of criteria or attribute (Tan & Chen, 2010). It refers to screening, prioritizing, ranking, or selecting a set of alternatives under usually independent, incommensurate or conflicting attributes
(Hwang & Yoon, 1981) [1].
The goal of MCDM is to help the decision maker (DM) to make a choice among a finite number of alternatives or to sort or rank a finite set of alternatives in terms of multiple criteria. The widely used MCDM methods are Analytic Hierarchy Process (AHP), Grey Relational Analysis (GRA), ELECTRE (Elimination EtChoix Traduisant la REalite, Technique for the Order of Prioritization by Similarity to Ideal Solution (TOPSIS), VIKOR, etc. Among the different MCDM techniques, the most widely applied method is TOPSIS [2]. It is one of the widely applied MCDM techniques to solve multi criteria decision making problem (Hwang and Yoon, 1981). It is based on the principle that the chosen alternative should have the longest distance from the negative-ideal solution, i.e. the solution that maximizes the cost criteria and minimizes the benefits criteria, and the shortest distance from the positive-ideal solution, i.e., the solution that maximizes the benefit criteria and minimizes the cost criteria. It is applied to find the better alternative when more number of conflicting criteria is available.
In this research, TOPSIS has been applied to find the better laptop. Today different kinds of laptops are available. Identification of difference between this laptop is very difficult. In this research Cost, Warranty, Size, Battery life, Specification (RAM, Processor, graphics card, speed), genuine operating system, weight of the laptop, Wi-Fi and Touch pad are considered as criteria to find the better laptop. It is difficult to select better laptop because relatively all laptops are seems to be similar. By applying TOPSIS method to the alternatives based on the criteria the laptops can be differentiated. In this research, MCDM evaluation metrics are applied to evaluate the laptop selection problem.
The rest of the paper is organized as section 2 describes about literature review on different application developed using TOPSIS. Section 3 describes the research proposal; section 4 describes the research methodology, section 5 describes about experimentation details, section 6 discusses the results and section 7 concludes the research.
-
II. L iterature R eview
Selection the right vendor for a long term relationship is a relevant procurement issue that demands judicious attention. The finding of a most suitable supplier is one of the most important issues to establish an effective supply chain system [3]. Indeed, supplier selection and evaluation represents one of the significant roles of purchasing and supply management function. Tracey and Tan (2001) note that one of the key elements essential to supply chain success is effective purchasing function [4]. Lee et al. (2001) and Kumara et al. (2003) emphasize that selection of the best supplier is an essential strategic issue imperative for supply chain effectiveness and efficiency. Kumara et al. (2003) contend that strategic partnership with the right supplier must be integrated within the supply chain to contain costs, improve quality and flexibility to meet end-customers' value and reduce lead time at different stages of the supply chain (Chris I., Bell-Hanyes, 2010) [5].
A study by Moynihan et al. (2006), states that about 60% of the manufacturer's sales dollars are paid to the supplier for purchased materials [6]. Most of those costs occur in the first stage of supply chain i.e., supplier selection. As mentioned by Venkata Rao (2007), supplier performance is a key issue which affects the success or failure of organizations. Any supply chain is initiated with the selection of right suppliers for the raw materials (Parthiban et al. 2010).
Supplier selection decisions are complicated by the fact that various criteria must be considered in the decision making process. The analysis of criteria for selection and measuring the performance of suppliers has been the focus of many academicians and purchasing practitioners since 1960s [7]. (Weber, Current, Benton, 1991) Based on Dickson's (1966) empirical study, 23 criteria were identified which purchasing managers generally consider when selecting a supplier. Dempsey (1978) identified quality, delivery capability, and technical capability as imperative in supplier selection. Ellram (1990) emphasized the need not only to base supplier selection decision on the traditional price and quality criteria but also on longer term and qualitative attributes such as strategic match and evaluation of future manufacturing capabilities [8].
-
III. R esearch P roposal
From the literature it has been found that very limited metric such as time and space complexity has been applied for TOPSIS. These metrics are applied to evaluate different kinds of TOPSIS applications. In this research, in addition to existing metric sensitivity analysis and ranking reversal are defined to evaluate the TOPSIS applications. In this research better laptop is identified using TOPSIS. This proposed application is evaluated using MCDM parameters. In this research, better laptop is identified using TOPSIS. This proposed application is evaluated using MCDM parameters.
-
IV. D esign O f R esearch M ethodology
MCDA is a sub-discipline of operations research that explicitly considers multiple criteria in decision-making environments [9]. In our daily lives or in professional settings, there are typically multiple conflicting criteria that need to be evaluated in making decisions. Cost or price is usually one of the main criteria [10]. Some measure of quality is typically another criterion that is in conflict with the cost.
The Technique for Order of Preference by Similarity to Ideal Solution (TOPSIS) is a multi-criteria decision analysis method, which was originally developed by Hwang and Yoon in 1981 with further developments by Yoon in 1987, and Hwang, Lai and Liu in 1993 [11]. This method considers three types of attributes or criteria
-
• Qualitative benefit attributes/criteria
-
• Quantitative benefit attributes
-
• Cost attributes or criteria
In this method, two artificial alternatives are hypothesized [12]:
Ideal alternative: the one which has the best level for all attributes considered.
Negative ideal alternative: the one which has the least attribute values.
TOPSIS selects the alternative that is the closest to the ideal solution and farthest from negative ideal alternative. The idea of TOPSIS can be expressed in a series of steps [13-15].
-
(1) Obtain performance data for n alternatives over k criteria. Raw measurements are usually standardized; converting raw measures xij into standardized measures sij.
-
(2) Develop a set of importance weights wk , for each of the criteria. The basis for these weights can be anything, but, usually, is ad hoc reflective of relative importance. Scale is not an issue if standardizing was accomplished in Step 1.
-
(3) Identify the ideal alternative (extreme performance on each criterion) s + :
-
(4) Identify the nadir alternative (reverse extreme performance on each criterion) s¡:
-
(5) Develop a distance measure over each criterion to both ideal ( D +) and nadir ( D¡ ).
-
(6) For each alternative, determine a ratio R equal to the distance to the nadir divided by the sum of the distance to the nadir and the distance to the ideal, R = D¡, D¡ + D +
-
(7) Rank order alternatives by maximizing the ratio in Step 6.
In this research, the new metric is defined from the result of ranking the laptops by using the general TOPSIS method in MCDM. The data set collected from the laptop users and the students who belong to different institute and different designation. The data set values will be applied to the each step in TOPSIS and it produces the ranking results. The new metric is defined from that ranking result. The sensitivity analysis is performed in different forms of result by changing the original values and the weights [13]. The weights are set as 1 and the weights are exchanged this will be applied in the TOPSIS method and find the different ranking. The rank is get from the user to know the alternative which is belongs to the rank. The new metric is defined by the Relative closeness coefficient Relative Coefficient values to be reduced.
-
V. E xperimentation
The various alternatives, criteria which are collected from different laptop vendors have been described in Table 1.
Table 1. List of Alternatives
|
Sl.No. |
DELL |
|
1. |
LENOVO |
|
2. |
APPLE |
|
3. |
HCL |
|
4. |
HP |
|
5. |
SAMSUNG |
|
6. |
ACER |
|
7. |
LG |
|
8. |
SONY |
|
9. |
TOSHIBA |
Criteria
The criteria are chosen based on the users requirements and how they need the product to buy. Criteria are also referred to as “attributes” or “goals”. Each Decision Making problem is associated with more than one attribute or criteria. Criteria are generally known as parameters or characteristics. Alternatives can be viewed in different dimensions by means of using Criteria. The criteria that are considered in this research are described in Table 2.
-
Table 2. List of criteria
Cost
Specification (RAM, Processor, graphics card, speed)
Warranty
Size
Battery life
With or without OS
Weight
Keyboard and Touch pad
Wi-Fi
Data Collection
The data collected from the laptop users are entered in these following tables for each kind criteria and alternative. The user preference is described in Table 3.
Table 3.User preference on different laptops
|
(Z) Ы ti н |
CRITERIA |
||||||||
|
о и |
я о у Q. (/) |
в ^ |
(/) |
5 М |
(/) О О О л S |
2 S |
-75 л Он Я О Н -75 55 "75 |
fo S |
|
|
to |
2.9 |
2.9 |
2.8 |
2.6 |
2.7 |
2.5 |
2. 5 |
2.5 |
2.6 |
|
о о ы |
2.7 |
2.2 |
2.3 |
2.3 |
2.4 |
2.2 |
2. 2 |
2.1 |
2.3 |
|
й to Рч < |
2.5 |
2.9 |
2.6 |
2.6 |
2.6 |
2.4 |
2. 4 |
2.4 |
2.4 |
|
и я |
2.6 |
2.7 |
2.6 |
2.5 |
2.5 |
2.5 |
2. 4 |
2.3 |
2.3 |
|
to щ |
2.5 |
2.5 |
2.7 |
2.5 |
2.3 |
2.5 |
2. 6 |
2.4 |
2.4 |
|
0 сл |
2.9 |
2.7 |
2.5 |
2.7 |
2.4 |
2.4 |
2. 6 |
2.5 |
2.5 |
|
Я Ы < |
2.2 |
2.4 |
2.3 |
2.5 |
2.4 |
2.2 |
2. 3 |
2.1 |
2.6 |
|
0 |
2.4 |
2.6 |
2.3 |
2.2 |
2.3 |
2.1 |
2. 2 |
2.4 |
2.1 |
|
О |
2.3 |
2.5 |
2.5 |
2.4 |
2.5 |
2.3 |
2. 5 |
2.3 |
2.1 |
|
< О н |
2.2 |
2.4 |
2.3 |
2.2 |
2 |
2.1 |
2. 5 |
1.9 |
2 |
The experiment is conducted in MATLAP using the dataset described in Table 3
The General TOPSIS method is performed by changing all the weights of the criteria to 1. The result of sensitivity analysis is shown in Table 4 when all the weights have changed to 1.
-
VI. R esults and D iscussion
In order to identify the better laptop, based on various conflicting criteria the MCDM method TOPSIS has been applied. In this research, to evaluate this application the widely applied MCDM evaluation parameters such as time complexity, space complexity, sensitivity analysis and rank reversal are applied. The time complexity and space complexity of this application are measured directly. The other evaluation parameters such as sensitivity analysis and rank reversal are also applied to evaluate this MCDM application. In sensitivity analysis, all the criteria are assigned same weight and in another method the weights are exchanged between the alternatives. This application is evaluated using the above mentioned MCDM evaluation parameters. The results are described in the next sub section.
-
A. Time and Space Complexity
Time Complexity
Time complexity of an algorithm quantifies the amount of time taken by an algorithm for its execution. It is commonly estimated by counting the number of elementary operations performed by the algorithm, where an elementary operation takes a fixed amount of time to perform. Thus the amount of time taken and the number of elementary operations performed by an algorithm differs by a constant factor. The efficiency of these algorithms can be determined by the computational time required by the algorithm. Time complexity taken for the TOPSIS method is 0.061059 seconds .
Space Complexity
The better the time complexity of an algorithm is, the faster the algorithm will carry out the work in practice. Apart from time complexity, space complexity is also important. This is essentially the number of memory cells which an algorithm needs. A good algorithm keeps this number as small as possible. Space complexity taken for the TOPSIS method is 1440 bytes .
-
B. Sensitivity Analysis
Sensitivity analysis measures the impact on the outcome by changing one or more key input values. It is used to investigate how sensitive the ranking of alternatives when changes in weights and belief degrees for certain attributes (Alinezhad & Amini, 2011). The weights are change in two different methods and the efficiency is checked.
-
■ Assign all attributes a weight value of 1, called basic weight.
-
■ Sensitivity analysis on exchanging each criterions weight with another criterions weight (Chen et al., 2014)
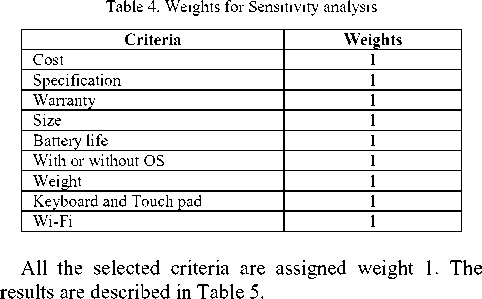
Table 5. Sensitivity analysis in TOPSIS when all the weight as 1
|
H |
SENSITIVITY ANALYSIS |
|||
|
GENERAL TOPSIS |
||||
|
BEFORE |
AFTER |
|||
|
Relative Closeness Coefficient |
5 |
Relative Closeness Coefficient |
||
|
DELL |
0.6656 |
2 |
0.4350 |
7 |
|
LENOVO |
0.3224 |
10 |
0.4553 |
4 |
|
APPLE |
0.7408 |
1 |
0.4383 |
6 |
|
HCL |
0.5966 |
3 |
0.9057 |
1 |
|
HP |
0.5623 |
5 |
0.4282 |
9 |
|
SAMSUNG |
0.5612 |
6 |
0.4310 |
8 |
|
ACER |
0.5816 |
4 |
0.8961 |
2 |
|
LG |
0.4487 |
8 |
0.4606 |
3 |
|
SONY |
0.5080 |
7 |
0.4048 |
10 |
|
TOSHIBA |
0.3793 |
9 |
0.4550 |
5 |
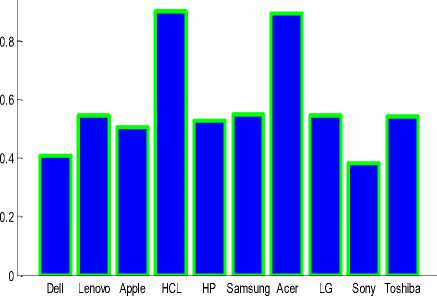
Fig. 1. Sensitivity Analysis on changing weights to 1
From the experimentation results, APPLE is the best laptop according to the selected criteria. The next selected laptop is DELL with RCC of 0.6656. The least preferred laptop is LENOVO. To this experimentation results sensitivity analysis is performed. It has been performed in two ways. In the first type all the weights are changed into 1 and second method the weights are exchanged between the alternatives. To perform the sensitivity analysis the weights of the criteria are assigned the equal weight of 1. The results of sensitivity analysis is represented in Fig.1
In this sensitivity analysis, the ranking of the alternatives have not been changed. For the same application is sensitivity analysis is conducted by exchanging weight as described in Table 6.
Table 6. Exchanging weight to perform Sensitivity analysis
|
CRITERIA |
ORIGINAL WEIGHT |
EXCHANGING WEIGHT |
|
COST |
0.8 |
0.8 |
|
SPECIFICATION |
1.0 |
0.4 |
|
WARRANTY |
0.4 |
1.0 |
|
SIZE |
0.2 |
0.7 |
|
BATTERY LIFE |
0.7 |
0.2 |
|
WITH OR WITHOUT OS |
0.6 |
0.6 |
|
WEIGHT |
0.5 |
0.3 |
|
KEYBOARD AND TOUCH PAD |
0.3 |
0.5 |
|
WI-FI |
0.9 |
0.9 |
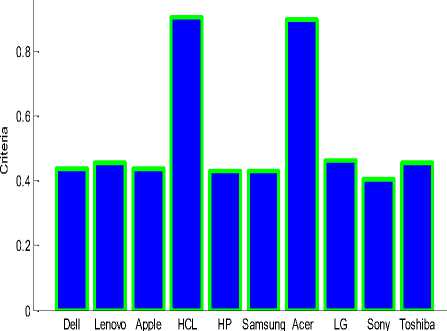
Fig.2. Sensitivity Analysis on exchanging weights
The Sensitivity Analysis is conducted in two different ways where the ranking result from TOPSIS method is changing. In TOPSIS, all ranks are getting changed when Sensitivity analysis is conducted by changing all the weights to 1. Similarly, sensitivity analysis is conducted by exchanging weights between the criteria. In this case, all ranks are changed. The changes in the ranking order of the alternative are described in Table 8.
The sensitivity analysis to exchange each criterion weight with another criterion weight is conducted. Table 7 shows the result of sensitivity analysis on exchanging weights. The weights are exchanged which is shown in Table 6. Then the sensitivity analysis is performed on TOPSIS method. The obtained result has been shown in Table 7. In this analysis, the ranking order of the alternatives is changed.
Table 7. Sensitivity analysis when the weights are exchanged
|
н |
SENSITIVITY ANALYSIS |
|||
|
GENERAL TOPSIS |
||||
|
BEFORE |
AFTER |
|||
|
Relative Closeness Coefficient |
5 |
Relative Closeness Coefficient |
||
|
DELL |
0.6656 |
2 |
0.4073 |
9 |
|
LENOVO |
0.3224 |
10 |
0.5449 |
4 |
|
APPLE |
0.7408 |
1 |
0.5041 |
8 |
|
HCL |
0.5966 |
3 |
0.9014 |
1 |
|
HP |
0.5623 |
5 |
0.5267 |
7 |
|
SAMSUNG |
0.5612 |
6 |
0.5496 |
3 |
|
ACER |
0.5816 |
4 |
0.8930 |
2 |
|
LG |
0.4487 |
8 |
0.5436 |
5 |
|
SONY |
0.5080 |
7 |
0.3805 |
10 |
|
TOSHIBA |
0.3793 |
9 |
0.5420 |
6 |
From the Table 7 it has been found that ranking order of the alternatives is changed. The ranking order of the alternative APPLE has been changed from position 1 to position 8. The ranking order of the alternative “DELL” has been shifted to 9. The least alternative “LENOVO” ranking order is changed into 4th position. The altered ranking order of alternatives has been described in Fig. 2.
Table 8. Changes in alternatives
|
> 1 И ы н < |
SENSITIVITY ANALYSIS |
|||
|
GENERAL TOPSIS |
||||
|
BEFORE |
AFTER |
|||
|
Relative Closeness Coefficient |
Relative Closeness Coefficient |
|||
|
DELL |
0.6656 |
2 |
0.4350 |
7 |
|
LENOVO |
0.3224 |
10 |
0.4553 |
4 |
|
APPLE |
0.7408 |
1 |
0.4383 |
6 |
|
HCL |
0.5966 |
3 |
0.9057 |
1 |
|
HP |
0.5623 |
5 |
0.4282 |
9 |
|
SAMSUNG |
0.5612 |
6 |
0.4310 |
8 |
|
ACER |
0.5816 |
4 |
0.8961 |
2 |
|
LG |
0.4487 |
8 |
0.4606 |
3 |
|
SONY |
0.5080 |
7 |
0.4048 |
10 |
|
TOSHIBA |
0.3793 |
9 |
0.4550 |
5 |
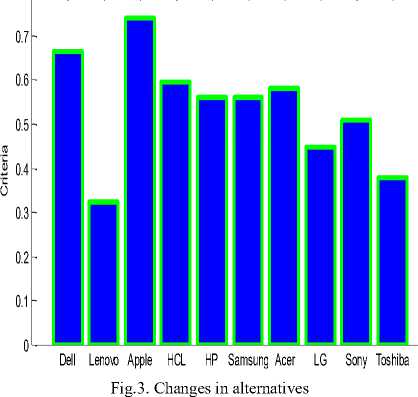
In this case, the most preferred alternative “APPLE” ranking order has been changed into sixth position. The second preferred alternative “DELL” has been shifted into 7th position. The least preferred laptop “LENOVO” has been shifted to 4th position. These changes are represented in the graph depicted in Fig.3.
To conduct the sensitivity analysis the value of the data set has been changed. The change in dataset is described in Table 9.
Table 9.Changes in data set for most suitable laptop selection
|
(Z) ti < H |
CRITERIA |
||||||||
|
о и |
я о у Q. (/) |
в ^ |
(/) |
5 М |
(/) О О О л S |
2 S |
-75 я Q. Я О Н -75 55 "75 |
fo S |
|
|
to |
2.9 |
2.9 |
2.8 |
2.6 |
2.7 |
2.5 |
2.5 |
0 |
2.6 |
|
о о z Ы |
2.7 |
2.2 |
2.3 |
2.3 |
2.4 |
2.2 |
2.2 |
0 |
2.3 |
|
Й Ph Ph < |
2.5 |
2.9 |
2.6 |
2.6 |
2.6 |
2.4 |
2.4 |
0 |
2.4 |
|
и я |
2.6 |
2.7 |
2.6 |
2.5 |
2.5 |
2.5 |
2.4 |
2.3 |
2.3 |
|
Рн S |
2.5 |
2.5 |
2.7 |
2.5 |
2.3 |
2.5 |
2.6 |
0 |
2.4 |
|
0 (Z СЛ |
2.9 |
2.7 |
2.5 |
2.7 |
2.4 |
2.4 |
2.6 |
0 |
2.5 |
|
Я Ы < |
2.2 |
2.4 |
2.3 |
2.5 |
2.4 |
2.2 |
2.3 |
2.5 |
2.6 |
|
0 |
2.4 |
2.6 |
2.3 |
2.2 |
2.3 |
2.1 |
2.2 |
0 |
2.1 |
|
Z О |
2.3 |
2.5 |
2.5 |
2.4 |
2.5 |
2.3 |
2.5 |
0 |
2.1 |
|
О н |
2.2 |
2.4 |
2.3 |
2.2 |
2 |
2.1 |
2.5 |
0 |
2 |
From this modified data set, sensitivity analysis is conducted to find the change in the ranking order of the alternatives. The value obtained for the alternatives has been described in Table 10.
Table 10. Changes in ranking order of the alternatives
|
to < н |
SENSITIVITY ANALYSIS |
|||
|
GENERAL TOPSIS |
||||
|
BEFORE |
AFTER |
|||
|
Relative Closeness Coefficient |
5 |
Relative Closeness Coefficient |
||
|
DELL |
0.6656 |
2 |
0.3728 |
3 |
|
LENOVO |
0.3224 |
10 |
0.1831 |
10 |
|
APPLE |
0.7408 |
1 |
0.3555 |
4 |
|
HCL |
0.5966 |
3 |
0.7691 |
1 |
|
HP |
0.5623 |
5 |
0.2816 |
6 |
|
SAMSUNG |
0.5612 |
6 |
0.3016 |
5 |
|
ACER |
0.5816 |
4 |
0.7592 |
2 |
|
LG |
0.4487 |
8 |
0.2399 |
8 |
|
SONY |
0.5080 |
7 |
0.2709 |
7 |
|
TOSHIBA |
0.3793 |
9 |
0.2327 |
9 |
These changes are represented in graph depicted in Fig.4.
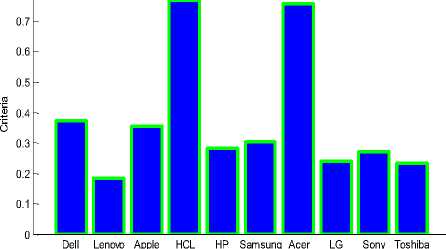
Fig.4. Ranking order of the alternatives
From this graph, it has been found that ranking order of the alternatives has been changed. The ranking order of the most preferred alternative and least preferred alternative has been changed. These changes should be measured to find the impact of the sensitivity analysis. To evaluate the ranking order of the alternatives ranking reversal has been conducted. The result of the ranking reversal is described in the next section.
-
C. Ranking Reversal
Rank reversal means that the ranking between two alternatives might be reversed after some variation occurs to the decision problem, like adding a new alternative, dropping an old alternative or replacing a non-optimal alternative by a worse one etc. Usually such a rank reversal is undesirable for decision-making problems. If a method does allow it to happen, the validity of the method could be questioned. Rank reversal of adding and removing the alternatives are taken for evaluation (Wang & Luo, 2009). And they are applied in TOPSIS method to check the efficiency.
Adding an alternative
An identical copy of a best alternative is introduced to check and validate the ranking order of the alternatives. This method validates the changes that occur due to the introduction of the best alternative. To perform this, the
Table 11. Data set considered to rank reversal
to н | SENSITIVITY ANALYSIS | |||
GENERAL TOPSIS | ||||
BEFORE | AFTER | |||
Relative Closeness Coefficient | 5 | Relative Closeness Coefficient | S | |
DELL | 0.6656 | 2 | 0.6090 | 2 |
LENOVO | 0.3224 | 10 | 0.2873 | 11 |
APPLE | 0.7408 | 1 | 0.6060 | 3 |
HCL | 0.5966 | 3 | 0.5139 | 7 |
HP | 0.5623 | 5 | 0.6193 | 1 |
SAMSUNG | 0.5612 | 6 | 0.5251 | 6 |
ACER | 0.5816 | 4 | 0.5263 | 5 |
LG | 0.4487 | 8 | 0.5436 | 10 |
SONY | 0.5080 | 7 | 0.4430 | 8 |
TOSHIBA | 0.3793 | 9 | 0.3484 | 9 |
ASUS | - | - | 0.5463 | 4 |
From the Table 12 it has been found that introduction of a new alternative has made a change in the ranking order of the alternatives. In rank reversal the ranking order of the best alternative “APPLE” position has been changed into third position. The newly introduced alternative “ASUS” has got the 4th rank. The least alternative 10th position has been shifted into 11th position. These changes are reflected in the graph depicted in Figure 5.
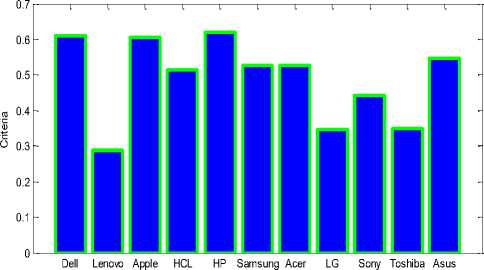
Fig.5. Rank Reversal for adding alternative
These ranking orders have been validated using removing an alternative from the selected the alternatives described in the next sub section.
Removing an Alternative
A least alternative is removed in order to check the ranking order is changed or not. To perform this, the least alternative is selected and removed from the original data. From Table 12, it has been found that alternative 16 is the least alternative. This least alternative has been removed from the Table. The relative closeness coefficient has been calculated before removing an alternative and similarly it is calculated after removing the alternative from the table. The Relative Closeness Coefficient and ranking order obtained before and after rank reversal is described in the Table 13.
Table 13. Rank Reversal for removing the least alternative
н | SENSITIVITY ANALYSIS | |||
GENERAL TOPSIS | ||||
BEFORE | AFTER | |||
Relative Closeness Coefficient | $ | Relative Closeness Coefficient | ||
DELL | 0.6090 | 2 | 0.6025 | 2 |
LENOVO | 0.2873 | 11 | - | - |
APPLE | 0.6060 | 3 | 0.5996 | 3 |
HCL | 0.5139 | 7 | 0.5069 | 7 |
HP | 0.6193 | 1 | 0.6171 | 1 |
SAMSUNG | 0.5251 | 6 | 0.5193 | 6 |
ACER | 0.5263 | 5 | 0.5277 | 5 |
LG | 0.5436 | 10 | 0.3400 | 10 |
SONY | 0.4430 | 8 | 0.4411 | 8 |
TOSHIBA | 0.3484 | 9 | 0.3491 | 9 |
ASUS | 0.5463 | 4 | 0.5431 | 4 |
In this methodology, the ranking order of alternatives has not been changed. The most suitable alternative is “HP” and its ranking order is one. After performing the rank reversal the ranking order of the alternatives has not been changed. The result of rank reversal is represented in graph shown in Fig.6.
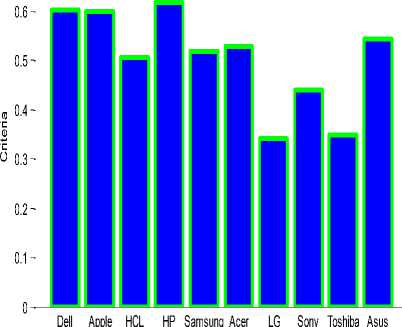
Fig.6. Change in ranking order after removing an alternative
This section discusses the results obtained on conducting sensitivity analysis, rank reversal, time and space complexity. These parameters are applied in the General TOPSIS method to evaluate the proposed application. The Sensitivity analysis is conducted by changing all the weights to 1 and exchanging of weights. The Ranking Reversal is conducted by adding and removing an alternative. To find the efficiency, Sensitivity analysis and Rank reversal are performed in general TOPSIS. The results obtained before and after sensitivity analysis and rank reversal are compared and found that proposed work attains better result. In this research, it has been found that ranking order of the MCDM application is evaluated using time and space complexity, sensitivity analysis and rank reversal. However, these evaluation parameters have not been measured. Hence, MCDM evaluation metrics have to be designed to evaluate the MCDM applications.
VII. Conclusion
In any decision making problem, decision can be made quickly when there are only one criteria is considered. But it is very difficult to make decisions when there are many criteria is available. It will be very worse when there is approximation in data. For these kinds of multi criteria decision making problems MCDM techniques can be applied. In this research, to identify a better laptop according to different criteria TOPSIS has been applied. This technique identifies a better laptop based on different criteria and identifies a better laptop. The performance this application has been evaluated using MCDM evaluation parameters such as time complexity, space complexity, sensitivity analysis and rank reversal. From the literature, it has been found that very limited evaluation parameters are applied to evaluate the MCDM application. This research has designed simple evaluation parameters which will be useful for researchers to design different kinds of evaluation parameters to evaluate the various functionalities of the TOPSIS. In this research, evaluation parameters are designed for TOPSIS. This research further extended to design evaluation parameters for other kinds of MCDM techniques such as AHP, GRA, ELECTRE, VIKOR, (Preference Ranking Organization Method for Enrichment Evaluation) PROMETHEE, COmplex PRoportional Assessment (COPRAS) and other MCDM techniques.
References Identification of a Better Laptop with Conflicting Criteria Using TOPSIS
- Chris I. E., Bell-Hanyes J., (2010), "a model for quantifying strategic supplier selection: evidence from a generic pharmaceutical firm supply chain", international journal of business, marketing, and decision sciences, vol. 3, no. 2.
- Jiang J., Chen Y.W., Tang D.W., Chen Y.W, (2010), "Topsis with belief structure for group belief multiple criteria decision making", international journal of Automation and Computing, vol.7,no.3, pp 359-364.
- Kasirian M.N., Yusuff R.M., (2009), "determining interdependencies among supplier selection criteria", European Journal of Scientific Research, vol.35, no.1, pp 76-84.
- Mohammady Garfamy R., (2005) "supplier selection and business process improvement", doctoral thesis, univesitat autonoma de Barcelona.
- Parthiban P., Mathiyalagan P., Punniyamoorty M., (2010), "optimization of supply chain performance using MCDM tool-a case study", int. J. value chain management, vol 4, no. 3.
- Shirouyehzad H., Dabestani R., (2011) "Evaluating Projects Based on Safety Criteria; Using TOPSIS", 2011 2nd International Conference on Construction and Project Management IPEDR vol.15 Singapur.
- Tahriri, F., Osman, M. R., Ali, A., & Mohd, R., (2008), "A review of supplier selection methods in manufacturing industries", Suranaree Journal of Science and Technology, vol.15, no.3, pp 201-208.
- Toloei Eshlaghy A., Kalantary M., (2011), "Supplier selection by Neo-TOPSIS", applied mathematical sciences, vol.5, no. 17, pp 837-844.
- Wang YM, Elang TMS, (2006), "Fuzzy TOPSIS method based on alpha level sets with an application to bridge risk assessment", Expert Systems, vol.31, pp 309-319.
- Weber C.A., Current J.R., Benton W.C., (1991) "Vendor selection criteria and methods", European Journal of Operational Research 50, pp 2-18.
- Zarbini-Sydani A.H., Karbasi A., Atef-Yekta E., (2011), "evaluating and selecting supplier in textile industry using hierarchical fuzzy TOPSIS", Indian Journal of Science and Technology, vol.4, no. 10, 1322-1334.
- Li Chunhui, Li Aizhen. The Application Of TOPSIS Method To Comprehensive Assessment Of Environmental Quality. Jorunal of Geological Hazard and Environmental Preservation, 1999, 10 (2): 9-13.
- Hu Yonghong. The Improvement of the Application of TOPSIS Method to Comprehensive Evaluation [J]. Mathematics in Practice and Theory. 2002.32 (4) : 572-575.
- H. Li, H. Adeli, J. Sun and J.G. Han. Hybridizing principles of TOPSIS with case-based reasoning for business failure prediction. Computers & Operations Research, 38(2011), 409-419.
- N.Y. Secme, A. Bayrakdaroglu and C. Kahraman. Fuzzy performance evaluation in Turkish banking sector using Analytic Hierarchy Process and TOPSIS. Expert Systems with Applications, 36(2009), 11699-11709.
