Identification of technosols formed from industrial dust in the area of Yazd city (Central Iran) by ground-based radiometry
 by ground-based radiometry")
Author: Akhavan Ghalibaf M., Masoodi S., Shirazi-chalashtary M., Delavarkhalafi A.
Journal: Бюллетень Почвенного института им. В.В. Докучаева @byulleten-esoil
Section: Статьи
Article in issue: 119, 2024.
Free access
Intensive industrial development in the form of metallurgical plants and quarries for mining of mineral resources in the vicinity of the city of Yazd resulted in significant dustiness of the ground layer of atmosphere and accumulation of industrial dust on the soil surface. At the locations of alloy steel production facilities, dust composition was dominated by particulate matter less than 1 μm (PM1), while near sand quarries, dust particles less than 10 μm (PM10) were predominant. The dust from these sources also differs in chemical composition (iron/silicon content ratio, pH). Registration with a pyranometer with a dark green filter with transmittance at a wavelength of 550 nanometers with a time interval of 20 seconds at a speed of 30 km/h during the movement along the specified routes allowed authors to identify zones with a stable increased content of particles of different sizes in the near-surface atmosphere. Sampling soil pits in these zones confirmed the presence on their surface of layers of dust deposits with a thickness of more than 5 cm, which allows them to be attributed to Technosols in accordance with the WRB soil classification. The soil map of the research area was compiled at a scale of 1 : 25 000 with the reflection of Technosols participation in the soil patterns. According to the map, more than three quarters of the study area are soil complexes including Technosols. Arid climatic conditions of the region lead to the accumulation of dust on the soil surface, which are practically not transformed and not removed from the soil, which results in their degradation and deterioration of the environmental conditions. Dust accumulation on the soil surface affects the state of vegetation cover of the region, which serves as a basis for indirect satellite indication of dusting zones. The method of revealing the dust layer on the soil surface based on the assessment of dustiness of the near-surface atmosphere using pyranometer can serve as a good complement to remote sensing methods.
Industrial dusts, pyranometer, yazd city, desert, technosols
Short address: https://sciup.org/143183303
IDR: 143183303 | DOI: 10.19047/0136-1694-2024-119-242-260
Выявление техносолей, сформировавшихся из промышленной пыли в районе города Йезд (Центральный Иран), с помощью наземной радиометрии
Интенсивное развитие промышленности в виде металлургических предприятий и карьеров по добыче полезных ископаемых в окрестностях города Йезд привело к значительной запыленности приземной атмосферы и накоплению промышленной пыли на поверхности почв. В местах расположения предприятий по производству легированной стали, в составе пыли преобладали твердые частицы размером менее 1 мкм (PM1), в то время как около песчаных карьеров - частицы пыли размером менее 10 мкм (PM10). Пыль от этих источников отличается также и по химическому составу (соотношению содержания железа и кремния, pH). Регистрация пиранометром с темно-зеленым фильтром с пропусканием на длине волны 550 нанометров с временным интервалом в 20 секунд на скорости 30 км/час во время движения по заданным маршрутам позволила выделить зоны с устойчивым повышенным содержанием в приземной атмосфере частиц разного размера. Выборочные разрезы почв в этих зонах подтвердили наличие на их поверхности слоев пылевых отложений мощностью более 5 см, что позволяет их отнести, согласно классификации WRB, к техносолям (Technosol). Построена почвенная карта района исследований в масштабе 1 : 25 000 с отражением участия в почвенном покрове техносолей. В соответствии с картой, более трех четвертей исследуемой территории составляют почвенные комплексы, включающие техносоли. Засушливые климатические условия региона приводят к накоплению пылевых выбросов на поверхности почв, которые практически не трансформируются и не удаляются из почвы, что приводит к их деградации и ухудшению экологической обстановки. Накопление пыли на поверхности почв влияет на состояние растительного покрова региона, что служит основанием для косвенной спутниковой индикации зон запыления. Метод выявления слоя пыли на поверхности почв по оценке запыленности приземной атмосферы с использованием пиранометра может служить хорошим дополнением к дистанционным методам.
Text of the scientific article Identification of technosols formed from industrial dust in the area of Yazd city (Central Iran) by ground-based radiometry
Crossroads of Research (Pajoohesh), 8915818411 Yazd, Iran, *, e-mail: , **e-mail: ,
Dust absorbs solar radiation and scatters it to space and the balance between dust absorption and scattering (Fraser, Kaufman, 1985) determines its ability to counteract greenhouse warming and atmospheric heating, but at present the amount of radiation to be absorpted by dust is uncertain (Sokolik, Toon, 1996; Alpert et al., 1998). According to Kaufman et al. (2001), dust absorption is expressed by its imaginary index of refraction, which had been recommended by the world meteorological organization (WMO, 1983). Cattle et al. (2009) in a semiarid zone of Australia, at the central location, where a Calcisol has formed in lacustrine lunette sediment, found that local dust of the same size as the dominant silt of the topsoil continues to be deposited, while minor topsoil is represented by very fine-grained silt matching regional and long-distance dust deposited at the site. Any suspended material with different size and shape in the air has defined as particles. Among all particles suspended in the atmosphere, the particles with diameters of 10, 2.5 and 1 micron and less are considered as air pollutants and environment health threat (DEQ, 2014). Zia-Khan et al. (2015) during the experiment found that dust deposits could block the stomata on the top of the leaf surface of a cultivated cotton, and, in addition, the canopy temperature of the dust-covered leaves was always higher than the control treatment. There are many factors provoking the emergence of the phenomenon of dust, so they can be classified into two major categories: natural and human factors. Natural factors include climate change, volcanic activity etc., and human or man-made factors include drying up of wetlands, desertification, the loss of underground water and industrial activities such as metal and non-metal industries, mining, urban activities like as civil engineering and road construction. Due to the important influence of the dust pollution on soil, which is an essential parameter of environment, and on human health, identification and control of dust pollution is necessary. According to the report of Beine et al. (2017) ambient particulate matter is a major health hazard, causing ∼3 million premature deaths annually. It is also widely known that PM affects incoming solar radiation, and hence, it is routinely included in assessment of climate change. It logically follows that PM will also affect solar energy generation, yet there have been only a few local studies of the effect of PM deposited on solar panel surfaces, and none that have explored the impact of ambient and deposited PM, including dust and anthropogenically produced particles. According to International Standard ISO 9060:1990 and the World Metorological Organisation (WMO) a pyranometer is the designed type of instrument of hemispherical form to measure global or diffuse solar radiation integrated over the wavelengh range from 0.3 to 3 μm (300 to 3 000 nm) (Kipp, Zonen, 2016). Gu et al. (2019) studied the perturbation of phosphorous emements from dust sediments to soil surface, and according to their study, dust contained abundant amount of Ca-P, which is consistent with its alkaline and calcareous nature and with previous studies on dust, derived from dry-lands. Karta (2020) after experiment showed the impacts of soil disturbances by human activities on the soil aggregation and dust fluxes and provided quantitative estimates of soil loss over time, thus, substantial loss of PM10 (particulate matter, that is less than 10 micrometers in diameter) was recorded in most experimental conditions. According to Giltrap et al. (2021), harmful emissions from soil can be increased or decreased by anthropogenic activity, while climate change is likely to modify future emissions patterns, both directly and in response to human mitigation and adaption actions. It corresponded to the scattering albedo (ratio of scattering to scattering + absorption). Khalesi Doost and Akhlaghi (2014) in estimation and comparison of solar radiation intensity by some models in a region of Iran mentioned the effect of factors such as altitude above sea level, the number of dusty days during month and seasonal changes of Sun–Earth distance. Eger (2011) in the research on the super humid and tropical soils revealed, that the increase of ecosystem fertility in correlation with aeoli- an processes was reflected by an increase of fertility-demanding species with dust flux, which was, however, not capable of maintaining vegetation suites characteristic of earlier stages of dust-free succession. Rashki (2012) emphasized the role of dust aerosols in atmospheric processes, i. e. the Earth’s radiation balance and cloud microphysics, that strongly depends on a variety of physico-chemical parameters, such as size distribution and dust sources. Javadi and Moeini (2019) in Iran, by using the pyranometric stations solar radiation data and the daily sunshine hours and also by Angström equations classified five climate regions, that in our research the area related to the total solar radiation (TSR) according to sunshine hours located in the highest class of TSR. Mohammadi et al., Aghasi et al. (2019) in relationships of soil physical and chemical properties with seasonal and annual dust deposition rate in Gavkhouni swamp sub-basin, Central Iran, found areas with high ecological complexity and complex nonlinear relationships among input and output data, the nonlinear methods were superior to linear methods. Adebiyi et al. (2021) showed that the cement dust particles entering the soil increased the pH of the soil, it is more alkaline on a forest tropical topsoil. Mohammadi et al. (2022) in their research aimed to identify and prioritize suitable locations for constructing photovoltaic power plants from the perspective of dust in some of the cities in Iran. Due to the geographical location and cold and dry climate of Mashhad, the city is exposed to the dust of the deserts of Turkmenistan. But due to high temperature in Abadan, as one of the tropical regions in Iran, the dust affects the performance of solar systems and significantly reduces the output power. Also, Mohammadi et al. (2022) reported that in Rasht city, near the Caspian Sea, with a temperate and humid climate the dust was negligible and in Sanandaj, in north-west of Iran, due to its cold and humid climate and with significant number of snowy days, dust load was low and insignificant. This study was conducted to investigate the effect of dust on the soils in the industrial zone of Yazd with desert and semidesert climate.
MATERIALS AND METHODS
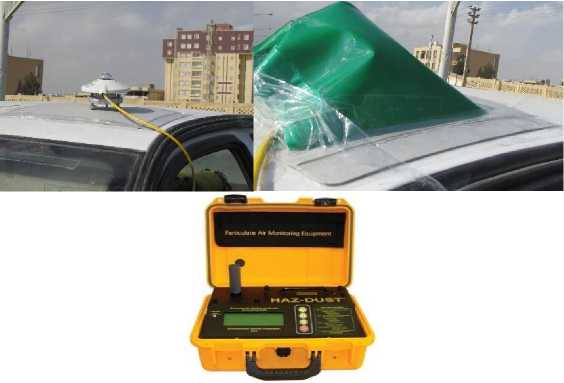
Fig. 1. Pyranometer installation on the car and the used Haz-Dust instrument .
On the collected dust from topsoils, x-ray imagery and total elements analyses were performed with scanning emission microscopy (SEM) with a SEM TESCAN instrument and combination with EDS mapping, Bruker X Flash. The location of study area, about 400 km2, was shown in Figure 2. Soil description in the field included morpho- logical parameters and such routine physical and chemical analyses as vegetation status, soil color, soil structure, soil texture, soil reaction and organic matter percentage. The soils were classified according to WRB 2014 (FAO, 2015).
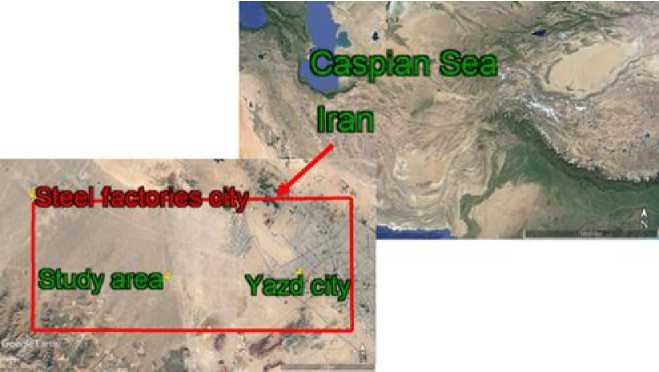
Fig. 2. The red rectangle shows research area in southwest of Yazd City.
According to Schad (2018), the Technosols as a Reference Soil Group in the WRB, after the version in 2014/15, seem to have provided a satisfactory scheme for classifying technogenic soils. In 2014 version of WRB, only little changes were made to the definition of the artefacts: “deposits in an environment, where they do not commonly occur” and “properties” were changed into “chemical and mineralogical properties”. Also, in third version of WRB, related to its previous version, the technic hard rock was renamed technic hard material, because it is substantially different from natural rock.
RESULTS AND DISCUSSION
In Figures 3 and 4 Google images in the time series from 2005 till 2023 and an exponential curve of spatial expansion of steel town in the northwest of the study area were shown.
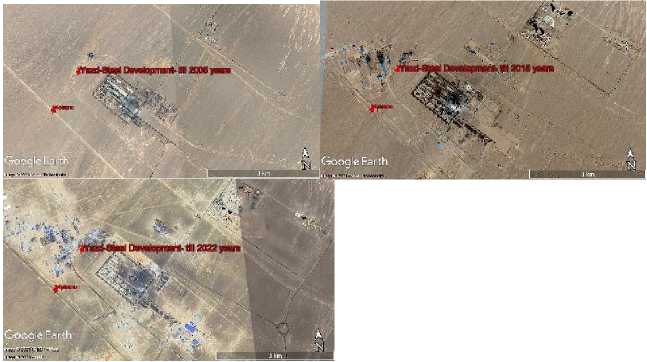
Fig. 3. The monitoring of steel town development on the Google images in 2005, 2015 and 2022.
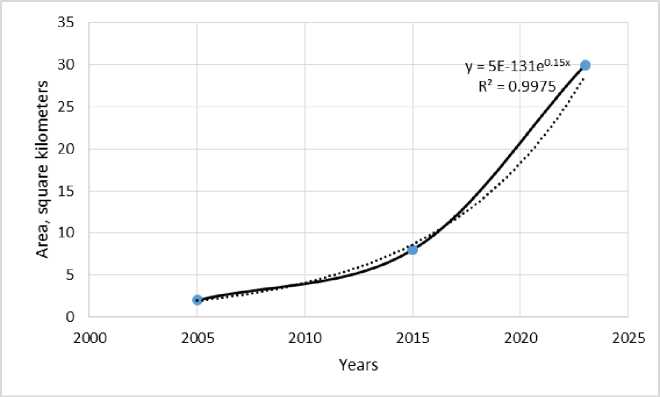
Fig. 4. The curve of steel town development from 2005 till 2023.
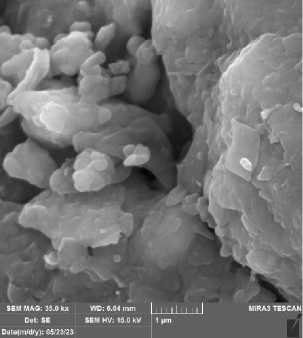
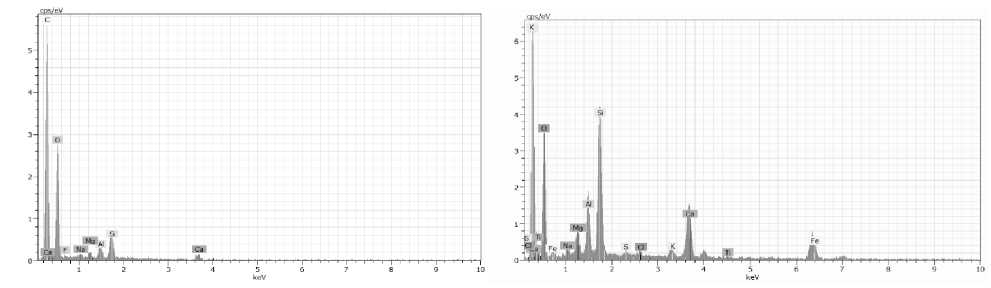
For comparison of two types of dust derived from steel and gravel industries the SEM images of dust, collected from topsoils, were shown in Figure 5. The left image in Figure 5 showed PM of bigger size in gravel mining areas in relation to the right image, demonstrating dust formed near steel combination industries. The EDS analyses of dust revealed that the samples taken near steel industries contained more Fe and less Si compared to the ones taken near gravel industies (Figure 6).
Moreover, dust quantitative analyses, performed by means of Haz-Dust portable instrument (Figure 7), confirmed the increase in fine particles (PM1) content near steel industries, where the ratio of Fe/Si (based on EDS analyses) increased as well.
The location of dust sampling points and track line of irradiance data using mobile pyranometer within the study area are shown in Figure 8.
-
Figure 9 shows variation of the irradiance intensity at track points with a Max. 619.44, a Min. 362.27, an Ave. 587.32 and a St. Dev. 26.62 values.
The results of Kriging analysis in Arcmap 10.4.1 of recorded pyranometer data are shown in Figure 10.
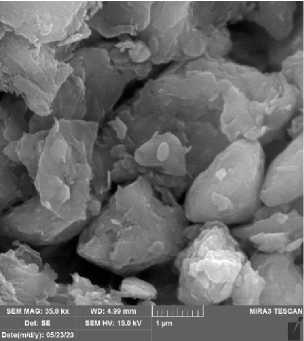
Fig. 5. SEM images of dust derived from two sources: steel (right) and gravel (left) industries.
|
El AN Series unn. [wt., %] |
C norm. [wt., %] |
C Atom. [at., %] |
C Error (1 Sigma) [wt., %] |
El AN Series unn. [wt., %] |
C norm. [wt., %] |
C Atom. [at., %] |
C Error (1 Sigma) [wt., %] |
|
C 6 K-series 54.50 |
54.50 |
62.10 |
8.86 |
C 6 K-series 69.40 |
49.16 |
60.22 |
11.62 |
|
O 8 K-series 41.96 |
41.96 |
35.89 |
7.89 |
O 8 K-series 51.67 |
36.60 |
33.65 |
9.32 |
|
F 9 K-series 1.59 |
1.59 |
1.15 |
0.93 |
Ca 20 K-series 4.75 |
3.37 |
1.24 |
0.21 |
|
Si 14 K-series 0.78 |
0.78 |
0.38 |
0.08 |
Fe 26 K-series 4.72 |
3.34 |
0.88 |
0.23 |
|
Ca 20 K-series 0.73 |
0.73 |
0.25 |
0.09 |
Si 14 K-series 4.70 |
3.33 |
1.74 |
0.25 |
|
Al 13 K-series 0.32 |
0.32 |
0.16 |
0.06 |
Al 13 K-series 2.57 |
1.82 |
0.99 |
0.18 |
|
Mg 12 K-series 0.06 |
0.06 |
0.03 |
0.04 |
Mg 12 K-series 1.49 |
1.06 |
0.64 |
0.15 |
|
Na 11 K-series 0.06 |
0.06 |
0.03 |
0.04 |
K 19 K-series 0.71 |
0.50 |
0.19 |
0.07 |
|
Total: |
100.00 |
100.00 |
100.00 |
Na 11 K-series 0.67 |
0.48 |
0.30 |
0.11 |
|
Cl 17 K-series 0.24 |
0.17 |
0.07 |
0.05 |
||||
|
S 16 K-series 0.21 |
0.15 |
0.07 |
0.05 |
||||
|
Ti 22 K-series 0.03 |
0.02 |
0.01 |
0.03 |
||||
|
Total: |
141.16 |
100.00 |
100.00 |
Fig 6. EDS analyses of dust derived from two sources: steel (right) and gravel (left) industries.
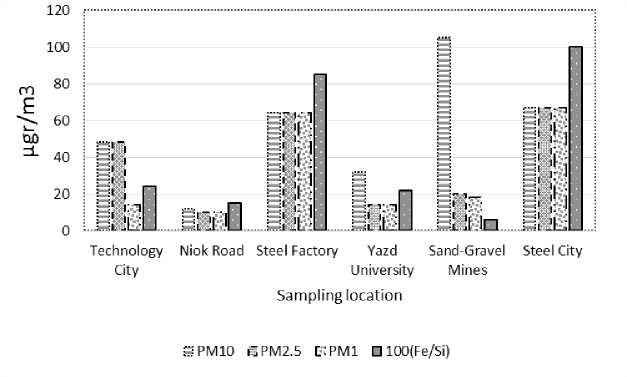
Fig. 7. Dust quantitative results, obtained by means of Haz-Dust portable instrument, and Fe/Si ratio resulting from EDS analyses.
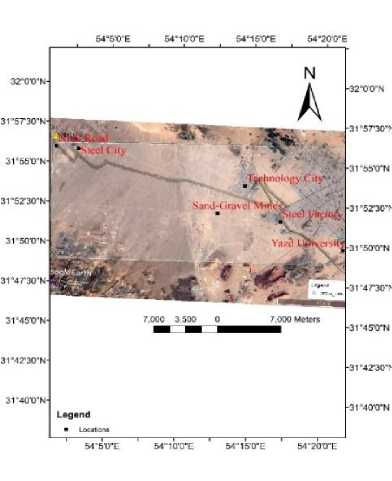
Fig. 8. The study area with location of dust analyses points and the track line of pyranometery.
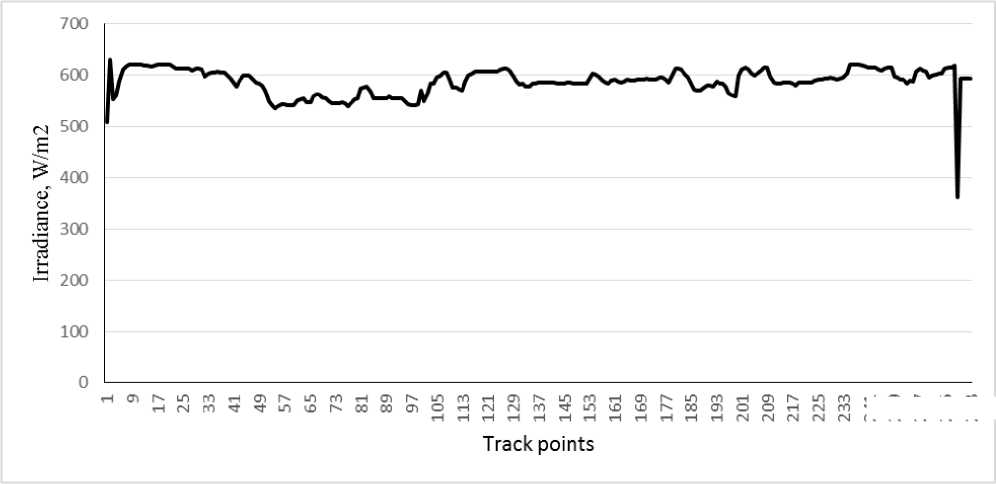
Fig. 9. Variation of the irradiance intensity at track points in study area.
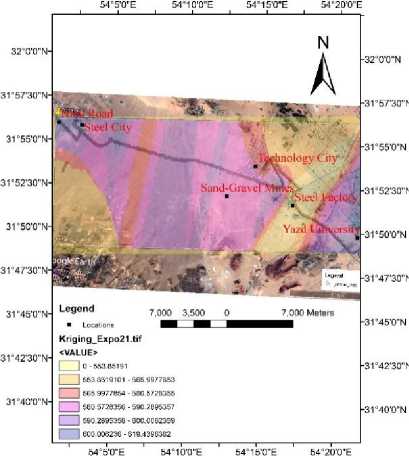
Fig. 10. Geostatistical analysis of radiation fluxes (W/m2) by Kriging method in Arcmap 10.4.1, recorded by pyranometer on the tracking GPS line.
Due to the changes in the chemical composition of the sediments that came from the dust of metal industries or sand mines, the color of the soil surface had also changed. All soils had the same Munsell Hue 10YR. All natural soils had Munsll color of 10Y/R 6/3 or pale brown. In the area affected by sand and gravel mines, color value 1 degree increased and Munsell color changed to 10YR 7/3 or very pale brown. The steel and complex industries changed Munsell color of topsoils to 10YR 7/1 or light gray. The semidesert plant coverage, where affected by industrial and mining activities, decreased to 50% (from 30% on the natural soils to 15% on the Technosols). The surface horizon of the soils near the metal industries had a slightly acidic soil reaction (pH = 6.5) in contrast to the soil reaction of other natural or sand mine areas (pH = 7.5). This difference in hydrogen ion concentration of the soil could be due to acid rain or the presence of acid chemical com- pounds in the dust of these areas. The percentage of organic matter in the surface horizon of industrially affected soils was reduced to less than 0.1%, compared to organic matter content in the surface horizon of natural desert soils, wich is about 0.6–0.8%. The texture of all surface soils was sandy loam, and noticeable changes were not observed in them. The structure of the soils in the areas affected by the industry had changed from a weak medium size blocky to a massive unstructured soils. The usual natural soil great groups were: Fluvisols on the alluvial depositions in desert zone with gentle slope (4–8%); and at upper slopes: Leptosols on highlands to the pedimonts direction in semidesert (Sirezems) zone with moderate slope (8–12%). In study area consolidated and relatively continuous material was found, resulting from industrial process, and identified as technic hard material called ‘Technogenic diagnostic materials of WRB (2015)’. Therefore, according to the definition of Ekranic (ek): having technic hard material starting ≤ 5 cm from the soil surface (in Technosols only); in Figure 11 it is possible to determine the Ekran layer on the soil surface, which confirm the identification of Technosols in the study area.
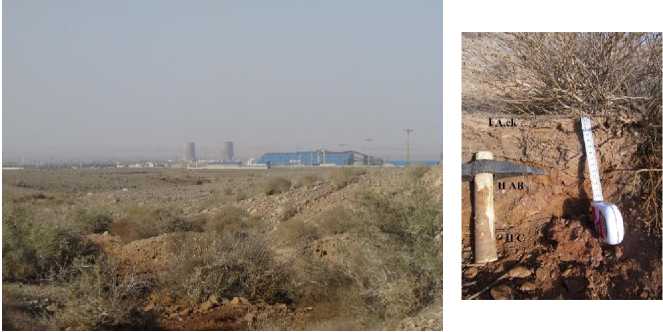
Fig. 11. The example of profile of Technosol (soil pit) nearby the steel factory in the study area.
In the study area the soil great groups (Table 1) were classified according to WRB (FAO, 2015).
Table 1. The soil great groups in the study area (FAO, 2015)
|
Soil code |
Description |
|
FL |
Fluvisols |
|
TCFLCI |
Technosols-Fluvisols-Complex industry |
|
TCFLGI |
Technosols-Fluvisols-Gravel industry |
|
TCFLSI |
Technosols-Fluvisols-Steel industry |
|
TCLPGI |
Technosols-Leptosols-Gravel industry |
|
TCLPSI |
Technosols- Leptosols -Steel industry |
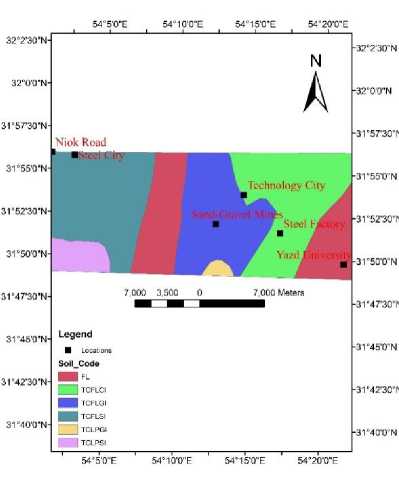
Fig. 11. The soil great groups, formed after industrial activities in the desert to semidesert areas, Yazd, Iran.
According to the dust (Figure 7) and irradiation (Figure 10) data the industry affected soils were classified (Table 1 and Figure 11).
Although the industrial sediments have had a chemical and physical effect on the surface horizon, it is not possible to determine the thickness of a new horizon layer, which is supposed to bury the underlying profile. The reason for this can be due to the wind erosion, which takes place at the same time as the wind blown materials are accumulated in the studied area. The main indicators, which helped to distinguish metal industry dust from sand mines one, were smaller size of the particles and greater Fe/Si ratio recorded near metal industries. These differences can be due to the escape of smaller dust particles from the filters of metal industries and the type of processes carried out in alloy steel industries compared to sand mines. However, the dust formed in the air remained suspended and with light breezes from the plain to the mountain during the day and from the mountain to the plain at night covered the entire area. The role of fine dust in reducing the emission of solar radiation to the earth in Iran was also reported by Rashki (2012) and Javadi and Moeini (2019). Yazd, belonging to subtropical and dry climate, could be a region with high potential for dusty air similar to Abadan in the research of Mohammadi et al. (2022). Although the pyranometer is designed to be installed at synoptic meteorological stations, in this research it was used as a mobile device to perform the relative comparison of radiation levels around polluting industries. Because of a variety of physico-chemical parameters such as size distribution (PM10 and PM 2.5 vs PM1) and dust sources, adapted to Rashki (2012), a dark green filter (550 nm) was used in the pyranometer to distinguish and separate relatively the areas with different types of dust in the study area (Figure 10). Dust deposits on native vegetation may reduce the percentage of green cover, which was found by Zia-Khan et al. (2015), becuse dust can block the stomata on the top of leaves. As far as vegetation is one of the main factors of soil formation and evolution, this effect can lead to changes in the type of soil compared to its natural state. Also, acording to the research of Adebiyi et al. (2021) about dust effects on the chemical properties of soils, the soils of the study area were classified on the basis of the collected radiation data (Figure 11). As a result, in the area affected by the industry, more than three quarters of soil cover is represented by soil complexes, including
Technosols. Finally, the soil map was designed at the scale 1 : 25 000, where the accuracy of soil groups boundaries was ensured and verified by the field study results.
CONCLUSIONS
The rapid industrial development in the study area has exceeded the environmental capacity in the desert and semi-desert regions of Yazd. The use of a mobile pyranometer contributed to distinguishing high-risk areas from low-risk areas in terms of environmental pollution, including soils affected by industry. It is necessary to prevent the intensity of pressure on the environment through industrial development or even to relocate it to other areas, characterized by lower risks. If the industrial dust in some regions have been able to increase the vegetation by increasing some nutrients concentration (Eger, 2011), but in the same regions, the change in the environmental conditions has led to a change in the type of vegetation, and, as a result, they have transformed the natural soils into Technosols. The relative increase of Technosols area, like what happened in Yazd, is a proof of unsustainable development in the considered region, because with the reduction of natural soil areas, the plant and animal species dependent on them are likely to be destroyed. This method can be used as a supplementary one to the satellite remote sensing method. For example, Landsat 9 satellite is able to image the entire Earth every 16 days, and when combined with Landsat 8 the entire planet can be scanned in 8 days. Therefore, when there is an information gap in the high-resolution satellite remote sensing data, additional information can be obtained through pyranometer as a complementary method. Using this method, it will be possible to be informed about the state of fine dust in the protected areas every hour of a sunny day under the supervision of an environmental expert.
References Identification of technosols formed from industrial dust in the area of Yazd city (Central Iran) by ground-based radiometry
- Adebiyi A.P., Adigun H.O., Lawal K.J., Salmai K.D., Adekunle V.A.J., Oyekakin J.A., Impact of Cement Dust on Physical and Chemical Nutrients Properties of Forest Topsoil, J. Appl. Sci. Environ. Manage., 2021, Vol. 25(5), pp. 695-700.
- Bahareh Aghasi B., Jalalian A., Khademi H., Besalatpour A.A., Relationship between dust deposition rate and soil characteristics in an arid region of Iran, Atmósfera, 2019, Vol. 32, No. 2., pp. 115-128, https://doi.org/10.20937/atm.2019.32.02.03.
- Alpert P., Kaufman Y.J., Shay-El Y., Tame D., Da Silva A., Schubert S., Joseph Y.H., Quantification of Dust-Forced heating of the Lower Troposphere, Nature, 1998, Vol. 395, pp. 367-370.
- Bergin M.H., Goroi C., Dixit D., Schauer J.J., Shindell D.T., Large Reductions in Solar Energy Production Due to Dust and Particulate Air Pollution, Environ. Sci. Technol. Lett., 2017, Vol. 4, pp. 339−344.
- Cattle S.R., Mctainsh G.H., Elias S., Aeolian dust deposition rates, particle-sizes and contributions to soils along a transect in semi-arid New South Wales, Australia, Sedimentology, 2009, https://doi.org/10.1111/j.1365-3091.2008.00996.x.
- Eger A., The effectiveness of actively accumulating dust in rejuvenating soils and ecosystems in a super-humid, high weathering and leaching environment, West Coast, South Island, New Zealand, PhD thesis, 2011, Lincoln University, 204 p.
- World Reference Base for soil resources 2014, International soil classification system for naming soils and creating legends for soil maps, FAO, Rome, 2015, 203 p.
- Fraser R.S., Kaufman Y.J., The Relative Importance of Aerosol Scattering and sorption in Remote Sensing, IEEE J. Geosc. Rem. Sens., 1985, GE23, pp. 525−633.
- Giltrap D., Cavanagh J., Stevenson B., Ausseil A-G., The role of soils in the regulation of air quality, Phil. Trans. R. Soc., 2021, B 376: 20200172, https://doi.org/10.1098/rstb.2020.0172.
- Gu C., Hart, S.C., Turner B.L., Hu Y., Meng Y., Zhu M., Aeolian dust deposition and the perturbation of phosphorus transformations during long-term ecosystem development in a cool, semi-arid environment, Geochimica et Cosmochimica Acta, 2019, Vol. 246, pp. 498-514.
- Javadi S., Moeini S., A new solar radiation models for Iran, Conference paper, 2019, URL: https://www.researchgate.net/publication/262172482.
- Karta I., Soil Erosion by Wind and Dust Emission in Semi-Arid Soils Due to Agricultural Activities, Agronomy, 2020, Vol. 10(1), 89, https://doi.org/10.3390/agronomy10010089.
- Kaufman Y.J., Dubovik A., Karnieli L., Remer A., Absorption of sunlight by dust as inferred from satellite and ground-based remote sensing, Geographical research letters, 2001, Vol. 28, No. 8, pp. 1479-1482.
- Khalesi Doost A., Akhlaghi M., Estimation and Comparison of Solar Radiation Intensity by Some Models in a Region of Iran, Journal of Power and Energy Engineering, 2014, Vol. 2, pp. 345-351.
- Kipp & Zonen B.V., Instruction manual, 2016, Manual document number: V1610, Netherland, 44 p.
- Mohammadi F., Hajinezhad A., Kasaeian A., Moosavian S.F., Effect of dust accumulation on performance of the photovoltaic panels in different climate zones, International Journal of Sustainable Energy and Environmental Research, 2022, Vol. 11, No. 1, pp. 43-56.
- Prospero J.M., Eolian transport to the world ocean, The sea: Vol VII, The Oceanic Lithosphere, Ed. Emiliani, C. Wiley, New-York, 1981, pp. 801-874.
- Rashki A., Seasonality and mineral, chemical and optical properties of dust storms in the Sistan region of Iran, and their influence on human health, PhD thesis, University of Pretoria, 2012, 197 p.
- Schad P., Technosols in the World Reference Base for Soil Resources - history and definition, Soil Science and Plant Nutrition, 2018, Vol. 64, No. 2, pp. 138-144.
- Sokolik I.N., Toon O.B., 2Direct radiative forcing by anthropogenic airborne mineral aerosol, Nature, 1996, Vol. 381, pp. 681-683.
- WMO, Radiation commission of IAMAP meeting of experts on aerosol and their climatic effects, WCP55, Williamsburg VA, 1983, pp. 28-30.
- Zia-Khan S., Spreer W., Pengnian Y., Zhao X. Othmanli H., He X., Effect of Dust Deposition on Stomatal Conductance and Leaf Temperature of Cotton in Northwest China, Water, 2015, Vol. 7(1), pp. 116-131, https://doi.org/10.3390/w7010116.
