Identifying Influential Nodes in the Spread of Criminal Information in Social Networks

Author: Shynar Mussiraliyeva, Gulshat Baispay, Ihor Tereikovskyi
Journal: International Journal of Computer Network and Information Security @ijcnis
Article in issue: 4 vol.17, 2025.
Free access
The purpose of this work is to develop an algorithm and a method for identifying key nodes involved in the dissemination of criminal information within social networks. This study focuses on social network analysis (SNA) metrics that facilitate the detection of influential actors in organized groups, particularly activists who serve as primary disseminators of criminal content. The research objects include both the textual content and metadata of users on social media platforms such as "Vkontakte" and "YouTube." To achieve this goal, an algorithm for detecting nodes that distribute criminal information has been developed. A conceptual model has been constructed, integrating network analysis principles with computational techniques to assess influence. This model introduces a novel framework for evaluating social network nodes based on a combination of structural, semantic, and emotional factors. Specifically, it incorporates influence assessment metrics that consider the heterogeneous nature of content, including its linguistic features, sentiment, and patterns of engagement. Additionally, the model accounts for the emission dynamics of criminal content, allowing for a more precise determination of high-risk nodes within the network. A method for quantifying the influence of social network nodes engaged in criminal content dissemination has been formulated. This method utilizes centrality measures along with content analysis techniques to improve accuracy in detecting key actors. Experimental validation conducted on multiple real-world datasets (including VKontakte groups and known extremist networks) demonstrated that the proposed method achieves an accuracy of up to 80% in identifying the most influential criminal nodes. Compared to baseline centrality-based methods, our approach provides more reliable detection due to the integration of semantic-emotional metrics and emission indicators. The results confirm the practical value of the method in operational scenarios such as the early detection of criminal activity and the prioritization of threat actors for monitoring. These findings have strong implications for real-world applications in law enforcement and cybersecurity. By leveraging advanced algorithmic techniques for social network monitoring, authorities can proactively detect and mitigate the spread of criminal information.
Information Security, Crime, Social Networks, Social Network Analysis (SNA), Influence Detection, Centrality Measures, Criminal Information Dissemination, Cybercrime
Short address: https://sciup.org/15019886
IDR: 15019886 | DOI: 10.5815/ijcnis.2025.04.06
Text of the scientific article Identifying Influential Nodes in the Spread of Criminal Information in Social Networks
With the development of information and communication technologies and the growing popularity of social networks, the exchange of information between users has become faster and more accessible than ever before. This, in turn, has led to a number of new challenges related to security and regulation of information in the online space. One of these challenges is the dissemination of criminal information on social networks, which may include illegal content, propaganda of violence, extremism, dissemination of fake news and other illegal activities.
In the last ten years, the popularity of social networks has increased dramatically. Platforms such as Twitter, Facebook and VKontakte are actively used by individuals, companies and media for discussions, promotion of services, distribution of news and political positions. At the same time, many organized groups, including terrorist organizations and activists, have begun to use these platforms to promote their ideas, discuss plans or demonstrate their actions, including criminal acts. According to criminologists, the influence of cybercriminal communities in the online space is rapidly growing. While social media pro-vides such groups with a platform to express their ideas, it also allows law enforcement and researchers to monitor their activities and study their behavior patterns [1].
Social networks are complex and branched structures in which information can spread instantly, covering huge audiences. A key role in this process is played by nodes (users or user groups), which are able to significantly accelerate the spread of information due to their activity, large number of subscribers and authority in certain communities. Identifying such nodes and monitoring their activities are critical to identifying and preventing the spread of criminal information. Currently, there are many approaches to identifying nodes that influence the spread of information in social networks. However, most of them do not sufficiently take into account the specifics of the spread of criminal content and require revision to improve their accuracy and reliability. In this regard, there is a need to develop a new method that will effectively identify key nodes involved in the spread of criminal information, and thereby help reduce the risks associated with information security threats.
The purpose of this work is to develop an algorithm and a method for identifying nodes of distribution of criminal information in social networks. To achieve this goal, methods of network analysis will be used to create more accurate and reliable models for identifying potentially dangerous nodes.
The structure of this paper is organized as follows: Section 1 introduces the study, outlining the main objectives, motivation, and significance of the research. Section 2 presents a comprehensive literature review, analyzing existing studies related to social network analysis, criminal content detection, and graph-based visualization techniques. Section 3 details the development of an algorithm for graphical visualization of user connections in social networks, explaining the methodologies and computational techniques used. Section 4 introduces an algorithm for identifying key nodes responsible for criminal information distribution within social networks, providing a step-by-step breakdown of its implementation. Section 5 discusses the experimental verification of the proposed algorithms, evaluating their effectiveness in assessing the influence of social network nodes distributing criminal content. Finally, Section 6 concludes the study, summarizing key findings and suggesting directions for future research.
2. Related Works
In the myriad landscapes of Online Social Networks (OSNs) and their consequential impacts on societal constructs, researchers have profoundly delved into analyzing patterns [2], structures [3], and behavioral dynamics [4] inherent within these digital platforms. This section aims to synthesize pertinent works that have pioneered research in OSN analysis, cyber-criminology, influence identification, and information spread within digital spheres, providing a foundational context for the current study.
A crucial thematic strand within related research pertains to Analyzing Patterns of Information Dissemination in OSNs. One study in this area has been seminal in investigating the spread of information through networks utilizing the Influence Maximization problem, probing into selecting initial seed nodes to maximize information spread via contagion models [5]. This work is cardinal in under-standing the macro-dynamics of information proliferation within networks and forms an algorithmic foundation upon which subsequent studies have built. Moreover, the Identification and Analysis of Influential Entities within OSNs has garnered substantial academic attention [6]. Authors probed into measuring and comparing the influence of users on Twitter, elucidating that traditional metrics such as the number of followers do not necessarily correlate with the actual influence a user exerts in terms of information spread. The dichotomy between perceived and actual influence within digital platforms is paramount to comprehending the nuanced structures of influence within OSNs.
Crime report and crime data analysis is an important area that plays a key role in making cities and societies safer. Based on the collected data, predictive models can be developed to prevent crime, identify crime zones, and create safer conditions for citizens. To achieve these goals, various data analysis methods and tools are used, as well as open cases and datasets available in the public domain. One of the key areas in the study of crime reports is spatiotemporal analysis of crimes, which allows you to deter-mine the relationship between the location, time, and frequency of incidents. In particular, such studies are often conducted for large metropolitan areas, where population density and the dynamics of urban processes contribute to changes in crime rates.
One such study was conducted in Chicago, where a dataset with detailed information on the location and types of crimes, as well as time data, was used to analyze the dynamics of crimes. The study used clustering and hotspot analysis methods. The results showed that certain areas of the city have consistently high crime activity during certain time periods, which allows for the prediction of future incidents and more efficient allocation of police resources [7]. In addition, similar studies were conducted in London, where machine learning methods were used to predict areas with increased crime rates. Algorithms such as K-means and DBSCAN were used to cluster areas based on criminal activity. It was found that crime clustering allows for more accurate identification of risk areas, which can be useful for developing crime reduction measures [8].
Recently, studies related to the use of social networks as sources for monitoring crime reports and predicting crimes have become popular. Such studies pay special attention to the analysis of content published by users on platforms such as Twitter, VKontakte, and YouTube. One of the major studies in this area was conducted on Twitter data, where public tweets were used to identify regions with increased crime activity. The study showed that an increase in mentions of certain crime-related keywords often correlates with actual incidents in certain areas. This approach allows one to monitor changes in crime rates almost in real time [9,10].
Crime prediction models have become an important area in crime report analytics. Machine learning algorithms are actively used here, which allow one to predict the likelihood of a crime being committed in the future based on historical data. One such method is Random Forest, which has been used in studies to create predictive models. In one case study in New York City, researchers developed a model that analyzes parameters such as crime type, time, location, and demographic characteristics to predict the likelihood of a crime occurring in a particular neighborhood. The accuracy of such models varies, but they generally show good performance in identifying potentially dangerous neighborhoods [11]. Collection of published cases and datasets. Access to high-quality datasets is necessary for successful analysis and development of crime prediction models. There are several large open datasets in global practice that are widely used in academic and applied analytics. San Francisco Police Department Incident Reports: This dataset contains information on crimes in San Francisco since 2018. It includes types of crimes, time and location of the incident, and investigation results. This dataset is used to analyze criminal activity in one of the largest cities in the United States and is a useful tool for predicting incidents. Another well-known dataset provided by the New York City police. Contains information on crimes in New York City since 2006. The dataset includes parameters such as crime type, time and lo-cation of the incident, and indictment data [11,12].
In the study [13], the authors present a method for shortlisting key participants in criminal organizations and identifying their important communication channels. According to the researchers, small-time criminals are usually caught while the leaders of the network remain out of reach. To improve the efficiency of identifying high-ranking criminals, the authors developed a forensic system called IICCC. It helps to identify influential participants in an organization by analyzing a short list of communication channels. The authors calculated metrics such as χ2 (chi-square test) and Betweenness centrality using their own algorithm. Each of the datasets was transformed into a network model reflecting the interactions between defendants in crimes. The authors then compared the influential nodes identi-fied by their system with the results of traditional metrics such as Betweenness, Closeness, OutDegree, and InDegree centrality.
In [14,15], the authors explore ways to identify key participants in online activist communities on the social network Facebook, using social network analysis (SNA) methods to study the structure and dynamics of interactions between participants in activist groups. In particular, the authors focused on metrics such as Network Diameter, Network Density, Centrality, and Average Degree to better under-stand the nature and intensity of interactions. These metrics allow us to assess which users are the most influential in the network, how closely participants are connected to each other, and how ideas and in-formation are disseminated in activist communities.
The paper by Garcia and Rodriguez provides a comparative overview of centrality metrics that are used in network analysis to identify key nodes and understand the structure of networks. The study covers various centrality measures, such as degree, betweenness, closeness, and eigenvector centrality, to demonstrate how each metric describes the roles and influence of nodes in a network. The authors con-sider both theoretical and practical aspects of the application of these metrics, highlighting their relevance for network analysis in various contexts, including criminal and social networks [16]. In the paper, the authors also explore the application of network analysis to understanding the relationships in social networks, focusing on methods for measuring, modeling, and mapping networks. In their paper, they use the NodeXL platform to visualize networks and calculate key metrics, such as network diameter, density, and node centrality. These methods help in the study of social networks, including the analysis of in-formation dissemination and the identification of key players in digital communities [17].
Identification of influence spreading nodes in social networks, which studies how to identify important individuals in human society, has attracted increasing attention from the physical and computer science, social science and economics communities. Algorithms for identifying influence spreading nodes can be used to estimate the influence of spreading, describe the position of a node and identify interaction centers. The study conducted in [18] focuses on methods for identifying key spreaders of information and infections in complex networks. The work aims to evaluate the effectiveness of different network analysis methods in identifying the most influential nodes that play a decisive role in the spread of infectious diseases. The authors use a combination of metrics such as degree centrality, betweenness and eigenvector to identify nodes with high spreading potential, which helps to estimate which nodes in the network can contribute to the faster and larger spread of infections. This study highlights the importance of identifying such nodes for developing effective epidemic control and prevention strategies by applying network analysis to epidemiology and public health problems.
In Russia and Kazakhstan, access to crime data is often limited, but there are some initiatives and projects aimed at collecting and analyzing such data. In some Russian regions, it is possible to find crime data provided by local authorities. An example is the Moscow Open Data project, which contains in-formation on crimes registered in the capital. However, this data often requires additional processing and normalization [19]. In Kazakhstan, the availability of such data is also limited, but some projects are beginning to develop in the area of collecting information on criminal activity based on news feeds and social media posts. One direction could be the use of natural language processing (NLP) methods to analyze media reports and identify hidden patterns of criminal activity. According to EurAsia Daily, 16 cases of violent extremism have been recorded in Kazakhstan over the past nine years. More than 500 citizens of the country have joined terrorist groups in Syria and Iraq, of whom about 100 have died. More than 1,000 Kazakhstanis have been sentenced to prison for crimes related to terrorism and extremism, and this figure has continued to rise over the past five years [20]. According to the Committee on Legal Statistics and Special Accounts of the Prosecutor General's Office, in the first nine months of 2019, 300 cases were in production under seven articles of the Criminal Code related to extremism and terrorism, of which 172 reached the court. The list of the Ministry of Finance of Kazakhstan, which includes individuals and organizations involved in the financing of terrorism and extremism, currently contains 1,565 names [21].
During the analysis of the conducted research on the topic of the work and in the collection of published cases and datasets on crime reports, several datasets were found and studied to identify nodes of criminal information dissemination, such as Krebs’s 9/11 dataset, Caviar dataset and How ISIS Uses Twitter. Krebs’s 9/11 Hijackers Dataset. This dataset includes a network analysis of the connections between the 19 terrorists who participated in the attack on September 11, 2001, and their environment in the United States of America. The dataset has 62 nodes representing both the terrorists themselves and their contacts, and 153 links (edges) that describe social and operational connections, including joint visits to training camps, participation in the same flights and financial transactions. The data is presented in the form of a binary adjacency matrix, where each element reflects the presence or absence of a specific connection between two participants [22].
Caviar Gang Network Data. This dataset is a network analysis of telephone interactions among members of the Caviar gang, which operated from 1994 to 1996 to illegally import and sell hashish and cocaine in Montreal, Canada. The network structure consists of 110 nodes representing individual members, represented by code points for anonymity (e.g., N1, N12). Key nodes reflect hierarchy, with N1 heading the hashish operations, N12 controlling the cocaine trade, and N3 serving as an intermediary, connecting the leaders to the network and providing channels of communication [23].
How ISIS Uses Twitter Dataset. This dataset contains information about the terrorist organization’s activities on the Twitter platform. The data includes tweets, timestamps, hashtags used, user and follower characteristics, and links to visual materials. The main goal of data collection and analysis was to identify ISIS recruitment and propaganda dissemination methods, as well as to analyze the structure and density of the network of accounts supporting terrorist activity. The dataset reflects the mechanism of ideology dissemination through social networks and analyzes the intricacies of algorithmic detection of content related to extremism [24].
Further, in the domain of Cybersecurity and OSNs [25], Ficara et al. (2022) embarked on explorations into understanding the morphologies of cyber-attacks facilitated through social media platforms, reflecting upon the vulnerabilities and exploits that permeate within OSNs. Such endeavors present a crucial framework through which one can comprehend the multi-faceted vectors through which cyber-criminals operate within digital social networks. In a more specific vein, works that have analyzed Criminal Activity within OSNs provide an essential framework for understanding the mechanisms and structures through which illicit actors operate within digital platforms. Kumar et al., 2023 forayed into exploring the dynamics within stolen data markets on social media, shedding light upon the structures and operational mechanisms of digital criminal networks [26]. These insights are pivotal in understanding the socio-economic structures that underpin criminal endeavors within OSNs. A synthesis of Machine Learning (ML) and Network Analysis in investigating OSNs provides a modern and technologically-advanced lens through which to probe into digital networks. Different researchers explored the utilization of ML algorithms to predict and analyze cyberbullying within social media platforms, leveraging technological advancements to comprehend, predict, and potentially mitigate undesirable activities within OSNs [27,28]. The amalgamation of machine learning and network analysis is especially poignant given the vast and complex data structures inherent within digital platforms.
The analysis shows that there are a large number of available cases and datasets that allow for in-depth analysis of crime reports and the development of effective crime forecasting methods. In the future, it is possible to integrate data from various sources, including social networks, and more actively use machine learning methods to accurately forecast criminal activity.
3. Development of an Algorithm for Graphic Visualization of User Connections in Social Networks
Social networks are complex systems consisting of many nodes (users) and connections (subscriptions, friendships, messaging). Social Network Analysis (SNA) is a widely used method to analyze such structures. This method allows you to identify key nodes, determine the structure of communities, and understand the influence of individual participants in the network. Visualization of SNA data plays an important role in presenting the analysis results, making them more visual and understandable. The main stages of developing a visualization algorithm are: collecting and preprocessing data, building a graph, and using SNA libraries.
Before starting to find Identifying Influential Nodes in the Spread of Criminal Information in Social Networks, the authors of the article studied and worked with texts with destructive content. The article [29] presents a comprehensive analysis of machine learning methods applied to classify crime-related text data, with a special emphasis on the comparison of traditional algorithms and deep neural network models. The authors demonstrate that the BiLSTM model outperforms other methods in the accuracy of detecting and classifying criminal texts, which confirms the effectiveness of deep neural networks in forensic analysis tasks. The paper [30] presents a unique semantic analysis model for detecting extremist texts in the Kazakh language, specifically designed to account for the linguistic characteristics and challenges of natural language processing in this context. A significant achievement of the study is the creation of the first-ever corpus of extremist texts in the Kazakh language, enabling the training and evaluation of machine learning models in this domain. The authors introduced an innovative approach that integrates TF-IDF for bigrams with a preceding stemming algorithm in the word embedding layer of an LSTM network, significantly improving the accuracy of extremist text classification.
Collecting and preprocessing data. Data about users and their connections can be obtained using the API of social networks such as Twitter, VKontakte, and YouTube. For example, the Twitter API allows you to retrieve data about subscribers and tweets through the followers/list and statuses/user_timeline methods. The VKontakte API provides methods such as friends.get to get a list of friends and information about communities. Social Network Analysis provides a broad toolkit for studying social network structures. The main objectives of SNA include: identifying key participants, detecting communities and groups, identifying intermediaries and anomalies. SNA uses centrality metrics to determine the influence of nodes in the network. The main metrics are Degree Centrality, Betweenness Centrality, Closeness Centrality, and Eigenvector Centrality [31].
Chi squared is calculated in the following steps: for each vertex, all paths from the neighbors of this vertex are found until the attractor is found. At each step, when choosing the next vertex in the path, the vertex with the highest betweenness centrality value is selected; then for each vertex, the maximum value at each path level is found. Here, the path level means the path depth (i.e. the vertex itself has level 0, and the neighbor has level 1); for each path, its betweenness centrality is found, which is the sum of the betweenness centrality of its vertices; then for each path, its local Chi Squared is found; the Chi Squared of all paths is summed up, and the sum is assigned to the vertex [32].
For graphical visualization of user connections in social networks, data was collected, a graph was made from the data, the next step was visualization and analysis of the constructed graph. An algorithm for graphical visualization of user connections in social networks was developed. User graphs were built based on posts in groups and graphs based on comments under the posts. To implement the algorithm, the VK API methods used to implement graphical visualization were considered: groups.get, groups.isMember, groups.search, wall.get, wall.getComments, wall.getReposts, wall.search. As a re-search group, data was collected from the ZTB Bake group. The group has 1,069,489 subscribers. Data for analysis was collected from June 1 to June 30, 2023. The number of unique users who left comments during the selected period is 1336, the number of edges is 2960.
Building a user graph based on posts in groups. By entering a comma-separated list of groups and specifying a time interval containing target posts from criminal groups, a user graph can be built. To do this, posts from the specified groups were collected during the specified time period, as well as information about users who left comments. For each group in the list, the get_posts_if_reply method was called, which extracted the required data. Compilation of a graph based on comments under posts. In this case, each user is represented as a graph vertex, and the total number of their comments under posts reflects the vertex weight. The weight of the edges between vertices is determined by the number of user interactions in the comments. A force algorithm was used to visualize the graph, which ensures a dense arrangement of connected vertices, which allows for a more efficient display of the network structure.
The graph was visualized in a web application format, using HTML, CSS, and JavaScript to render the graph. The d3.js library was used for the visualization itself, which allowed for an interactive and visual representation of the data. The graph was built using the NetworkX library for graph analysis (Figure 1).
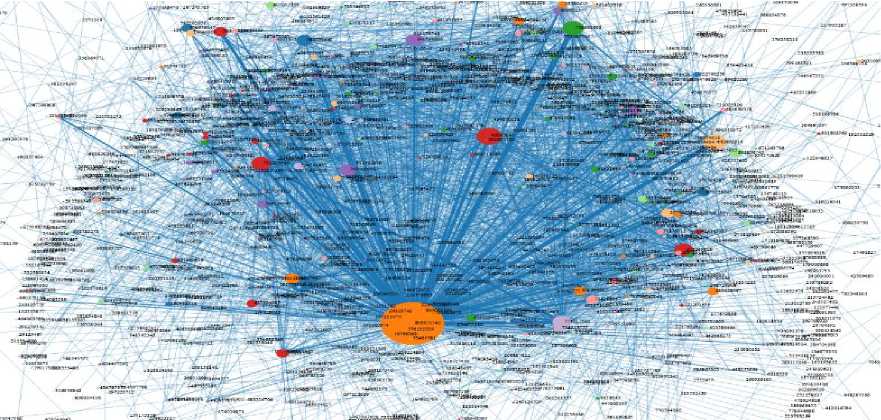
Fig.1. User graph
During the graph analysis, various graph properties such as chi-square, closeness centrality, close-ness centrality and PageRank, number of vertices, number of edges, and density were calculated. To test the efficiency of developing an algorithm for graphic visualization of user connections in social networks, studies were conducted with real datasets Caviar dataset, How ISIS Uses Twitter and Krebs’s 9/11 dataset. The accuracy of identifying key users of Caviar dataset showed 85% [32]. To evaluate the effectiveness of the proposed method, we conducted an experiment using a dataset related to ISIS-affiliated users. As a baseline, we computed traditional centrality-based metrics including degree centrality, closeness centrality, betweenness centrality, and chi-squared values. Based on these standard indicators, the accuracy of identifying influential nodes reached approximately 50% (Table 1). In contrast, the proposed method, which integrates semantic, emotional, and behavioral indicators, achieved a significantly higher accuracy of 80% in detecting key actors involved in the dissemination of extremist content. These results demonstrate the advantage of our approach over purely topological analyses and highlight its potential for more accurate influence detection in criminal networks. A more detailed analysis and the results of applying the proposed influence metrics to the VKontakte dataset are provided in the Experimental Results section.
Table 1. How ISIS Uses Twitter dataset metrics indicators
|
Node ID |
Indicators |
|||
|
degree_centrality |
closeness_centrality |
betweenness_centrality |
chi_squared |
|
|
RamiAlLolah |
10 |
0.28 |
0.18 |
0.39 |
|
Uncle_SamCoco |
4 |
0.20 |
0.066 |
0.28 |
|
WarReporter1 |
4 |
0.24 |
0.058 |
0.58 |
|
mobi_ayubi |
5 |
0.25 |
0.08 |
0.55 |
|
Nidalgazaui |
4 |
0.20 |
0.08 |
0.25 |
Experimental verification of the influence of social network nodes distributing criminal content was carried out in VK groups. The social significance indicators of these nodes given in Table 2 were calculated according to generally accepted approaches. In order to preserve the anonymity of the data, the nodes were identified using abstract identifiers.
Table 2. Indicators of social significance metrics of the studied social network nodes
|
Node ID |
Indicators |
|||
|
degree_centrality |
closeness_centrality |
betweenness_centrality |
chi_squared |
|
|
N1 |
0,27 |
0,48 |
0,47 |
32,38 |
|
N2 |
0,09 |
0,40 |
0,09 |
31,38 |
|
N3 |
0,06 |
0,37 |
0,06 |
45,08 |
|
N4 |
0,05 |
0,38 |
0,06 |
38,67 |
|
N5 |
0,05 |
0,38 |
0,05 |
37,63 |
|
N6 |
0,05 |
0,35 |
0,05 |
26,12 |
|
N7 |
0,04 |
0,38 |
0,05 |
54,52 |
|
N8 |
0,03 |
0,36 |
0,02 |
29,18 |
|
N9 |
0,03 |
0,36 |
0,04 |
35,52 |
|
N10 |
0,03 |
0,36 |
0,03 |
21,22 |
|
N11 |
0,03 |
0,37 |
0,03 |
25,53 |
|
N12 |
0,02 |
0,36 |
0,02 |
23,12 |
|
N13 |
0,03 |
0,36 |
0,03 |
37,39 |
The development of an algorithm for graphical visualization of user connections using SNA methods and centrality metrics provides a powerful tool for analyzing network data. Visualization simplifies understanding of complex structures, allows identifying key nodes and communities, and detecting anomalies in the data. The use of these algorithms and metrics opens up new possibilities for analyzing social networks in such areas as criminology, marketing, and social research.
4. Development of an Algorithm for Identifying Nodes of Criminal Information Distribution in Social Networks
Based on generally accepted approaches to the development of a conceptual model of the applied research area, as well as some contradictory opinions regarding the determination of the level of influence of a social network node, in the first approximation, a conceptual model for determining the level of influence of social network nodes distributing criminal content can be presented as a black box, the input of which is a tuple of parameters describing the nodes of the social network - 〈 Node 〉 , and the output of which is a tuple of parameters describing the influence of these nodes -
〈 Inf 〉 :
of
(Node) — (Inf)
where — is the operator for determining the level of influence of social network nodes distributing criminal content.
The proposed method for evaluating the influence of social network nodes disseminating criminal content consists of four key stages. First, core metric values are identified for each node based on their activity and the nature of shared content, including text, images, audio, and video. Second, these metrics are used to construct influence assessment profiles that reflect semantic, emotional, and behavioral characteristics. Third, aggregated metrics are calculated to summarize the influence potential of each node across multiple dimensions. Finally, a comprehensive evaluation is performed using the aggregated values to determine the overall influence level and generate a ranking of nodes involved in criminal content dissemination. This stepwise structure improves clarity and allows for the detection of nodes that may not be structurally central but play a significant role in information propagation.
To eliminate the above-mentioned shortcomings, a number of principles have been proposed that provide a basis for improving the technology for assessing the influence of social network nodes that distribute criminal content.
Principle 1. Metrics for assessing the influence of nodes should take into account:
-
• The main topics of messages and comments of the assessed node.
-
• The degree of criminal focus of messages and comments of the social network node.
-
• The degree of support for criminal content in messages and comments of the assessed node.
-
• The level of expression when assessing support for or condemnation of criminal content in messages and comments of the assessed node.
-
• The range of emotions expressed in messages and comments supporting or condemning criminal con-tent.
-
• The emission of messages of criminal content from the assessed node.
Principle 2. The subject matter of messages and comments should be assessed based on the se-mantic analysis of text content, images, audio and video materials, taking into account the degree of support for criminal content, the level of expression and the range of emotions.
Principle 3. It is advisable to develop tools for analyzing the text content of social network nodes taking into account the possibility of using proven and available systems for intelligent processing of text information.
Principle 4. The emission of messages of criminal content from the node being assessed can be correlated with the amount of forwarding of such content from the node being studied by other nodes. When developing tools for determining the presence of forwarding, it is necessary to first of all take into account the increased requirements for their efficiency and resource intensity, which predetermines the advisability of using methods based on comparing the hash codes of graphic and audio messages for comparing the original and forwarded messages. In accordance with principles 1, 2 and 4, it is proposed to supplement the methodological base of the technology for assessing the influence of a social network node with aggregated metrics, for the determination of which the metrics presented in Table 3 are used. 1 basic metrics that are used to evaluate the semantic content of messages and comments.
Table 3. Basic metrics of semantic content of messages and comments of social network nodes
|
№ |
Metric notation |
Description of the metric |
|
1 |
Ц 1 |
The degree to which content belongs to a certain topic |
|
2 |
Ц 2 |
Degree of criminality of the content |
|
3 |
Ц з |
Degree of support for criminal appeals in the assessed content |
|
4 |
Ц 4 |
Content expression level |
|
5 |
Ц 5 |
The degree of expression of the emotion of joy in the content |
|
6 |
Ц 6 |
The degree of expression of the emotion sadness in the content |
|
7 |
Ц 7 |
The degree of expression of the emotion fear in the content |
|
8 |
Ц 8 |
The degree of expression of the emotion anger in the content |
|
9 |
Ц 9 |
The degree of expression of the emotion of surprise in the content |
|
10 |
Ц10 |
The degree of expression of the emotion of disgust in the content |
|
11 |
Ц11 |
Degree of expression of emotion neutrality in content |
|
12 |
Ц12 |
The emission level is related to the amount of criminal content sent by other nodes |
To compute the semantic metrics μ₁ and μ₂ for texts in the Kazakh language, authors developed and implemented custom machine learning models trained to classify user-generated content into predefined categories of criminal discourse. The classification taxonomy includes the following categories: Noncrime, Assault, Burglary, Drugs, Homicide, Sex Offence, and Extremist. The development, training, and evaluation of these models are described in our prior studies, which explored the application of long short-term memory (LSTM) networks for detecting extremist content in Kazakh [30], as well as broader machine learning approaches for crime-related text classification [29]. For English-language content, analogous machine learning techniques have also been widely adopted to detect criminal and extremist narratives. Studies [33] and [34] highlight the effectiveness of deep learning and artificial intelligence methods in identifying hate speech and radical content in online environments, supporting the applicability of similar classification frameworks in multilingual and cross-cultural settings. As an alternative to supervised models [35], large language models (LLMs) can be leveraged via prompt engineering to infer topic relevance and criminal intent. In both approaches, class probabilities are normalized to the [0,1] interval to yield interpretable and comparable metric values.
Subsequent semantic and emotional metrics (pj-pu ), which capture the affective dimensions of the content, are computed using publicly available natural language processing libraries and multimodal analysis tools. These include open-source frameworks such as TextBlob, VADER, NLTK, Transformers, Torchaudio, and OpenCV, which facilitate the automated extraction of sentiment, emotional tone, and multimedia features necessary for influence metric computation.
Note that, according to the results, the metrics ц 1 -ц 11 are dimensionless since they describe relative indicators, and the metric ц 12 is measured in the number of forwards of the node's messages. The range of possible values of the metrics ц 1 , ц 2 , ц 4 -ц 11 is between 0 and 1. At the same time, the degree of support for criminal calls in the assessed content (ц3) can be between -1 and 1, and the range of values of the metric ц 12 varies from 0 to +w, since theoretically the number of forwards of the node's messages can be arbitrarily large. Note that to determine the correlation of the metrics ц 1 - ц 11 with a message or a comment, it is proposed to use the indices "mes" and "com". Thus, if the i-th metric refers to a message, it is denoted as цте', and in the case of a comment - ц™™ . Although the metric ц12 is used only to evaluate node messages and is not used to evaluate comments, but to maintain the generality of the formulations, it is proposed to denote this metric as ц^ .
It is proposed to take into account that the content of a social network node can be presented in the form of text, images, audio or video materials using the indices "t", "p", "a", "v" . For example, if the i-th metric refers to a text message, then it is designated as ц™1’1. The definition of the basic metrics presented in Table 2 made it possible to form a set of aggregated metrics, the description of which is presented in Table 4. The aggregated metrics, denoted as M₁–M₅, are then computed using the formal expressions provided in equations (2–20), enabling a structured and reproducible transition from low-level content descriptors to high-level influence indices. Note that metrics M 1 — M 3 provide a representation of the node in a three-dimensional space of coordinates associated with the influence assessment, and metric M 4 is an integral metric for assessing the influence of a social network node distributing criminal content.
Table 4. Aggregated metrics for assessing the influence of social network nodes distributing criminal content
|
№ |
Metric notation |
Description of the metric |
|
1 |
M 1 |
Expression of the main thematic focus of the node |
|
2 |
M 2 |
The degree of criminal orientation of the node |
|
3 |
M 3 |
The level of emission of criminal content of the node |
|
4 |
M 4 |
Node Crime Influence Index |
|
5 |
M 5 |
Comprehensive index of thematic and criminal influence of a node |
The calculation of the aggregated metrics for assessing the influence of social network nodes distributing criminal content presented in Table 3 can be implemented using expressions (5.2-5.16). In this case, it is proposed to use expressions (2-7) to calculate the metric M 1 .
mes цт^,^—^Т^=1 smew
rzmes x'T'P ™mes к — Lj=i Kj
com
^0™^—^!^^ ц^ю
com
Ц^,^—^Т^к=1 P^s)
M 1 (s,At) = a1mesц™^es(s,Дt) + a 1O0m ц 1^ o ^l(s,^t)
M i (s n ,^t) — max(M 1 (s 1 ,^t),M 1 (s 2 ,^t),^,M 1 (s N ,^t)) ^ (M i — M i (s n ,At),s main — s^
where ц^5 (s, M), цЮ™ (s, M) is the degree of belonging of the content of messages and comments of the node to the sth topic over the time interval At; pm^'' (s') is the degree of belonging of the k-th message presented in the j-th format to the s-th topic; p™™'! (s) is the degree of belonging of the k-th comment presented in the j-th format to the s-th topic; Kjmes, K™es is the number of messages and comments in the j-th format for all topics; Tp is the number of data presentation formats; j is the data presentation format (1 – text, 2 – image, 3 – audio materials, 4 – video materials); Kmes, K^m is the total number of messages and comments presented in all formats for all topics; а"ие', a1om - weight coefficients that determine the significance of messages and comments when assessing the thematic focus of a node, where ames + a“m = 1; M1(s, At) - the expression of the s-th topic in messages and comments of the node; s_main -the main thematic focus of the node; N – the number of topics of the node.
Since the initial messages of the node are the source of the initial information and set the initial topic of discussion, and the comments only develop the initial topic, the weight of the messages can be considered greater than the weight of the comments to these messages. In the basic version, it is determined that a mes = 0,7, a a 1om = 0,3, which correlates with the results.
It is proposed to implement the calculation of the aggregated metric M2 (the degree of criminal orientation of the node) using expressions (3, 5, 8-16). The basis for the calculation is the presentation of the assessment of the social network node using the metric M 2 as a vector in a three-dimensional coordinate system, the axes of which are associated with the basic metrics p 2 , p 3 and the aggregated metric p. 4 11 , which allows taking into account the heterogeneity of the characteristics of the social network node described using the specified metrics. In this case, the aggregated metric p 4 11 is related to the emotional coloring and expression of the content of the social network node.
mes pmil^At)^^^ erne (8)
n mes
P kJ
„mes^ „mess'2 „mess \2
^(a ^2 ^ 2ikj ) +(a ЦЗ ^ З'kj ) +\a ^4-11 ^ 4 11,k,j )
mes _ ..mss v ,,mss p 4_11,k,j = p 4,k,j * p 5_11'kj
mes _ „ ..mss _ ..mss _ ..mss _ ..mss । ..mss _ ..mss ..mes /1
p 5_11'k'j = a ^5 p 5'k'j a ^6 p 6'kJ a ^7 p 7,k,j a ^8 p 8'kJ +a ^9 p 9'kJ a ^10 p 1Q,k,j +a ^11 p 11,kJ (11)
22 2
, c°m _ fa^oim) +(*^) +^1^^
' k'j = V3
c°m _ ..oom ..oom p4_11,k,j = p4,k,j * p5_11,k,j
com com com com com com com com p5_11,k,j = a^5p5,k,j a№p6,k,j a^7p7,k,j a№p8,k,j + a^9p9,k,j a^10p10,k,j +a^11p11,k,j (15)
M 2 = am^pm^At) + a m p, m (\t)
where p^S^At), p^ ll^ At) is the degree of criminal orientation of messages and comments of the node; ft™jS , ft™™ is the degree of criminal orientation of one message and comment of the node; p mil , p™™ is a combined metric for assessing the influence of basic emotions on the perception of a message and comment of the node; a^, a^, a^ 11 are weight coefficients that determine the significance of the p4-11, where aa^ + a ^3 + a^ 11 = 1; a ^s — a ^11 - weight coefficients that determine the significance of metrics p 5 — p 11 , where a^ + a ^6 + a ^7 + a ^8 + a^ + a ^10 + a ^11 = 1; a^1^'a 2°°m - weight coefficients that determine the significance of messages and comments when determining the degree of criminal orientation of a node, where a™es + a 2 om = 1.
Based on the results, it was determined that the weighting coefficients determining the significance of the metrics p 2 , p 3 , p 411 have the following values: a^ = 0,4 , a^ = 0,4 , a ^4 11 = 0,2 . The weighting coefficients used in expressions (11, 15) to determine the severity of positive or negative emotions in messages and comments in the basic version have the following values: a ^s = 0,25, a ^6 = 0,2, a ^7 = 0,1, a ^8 = 0,1, a ^9 = 0,15, a ^10 = 0,1, aM11 = 0,1. In this case, by analogy with expression (5.6), a™es = 0,7, a a 2om = 0,3.
It is proposed to implement the calculation of the aggregated metric M 3 (the level of emission of criminal content of the node) as follows:
mss p ■„ x- X' x. pm^At)
M 3
1 1+e ~^12£
where G is the search depth for messages with criminal content forwarded from the node under study; / 12 s is the absolute number of all forwarded messages with criminal content.
To determine the fact of forwarding a message with criminal content from the node under study, it is proposed to evaluate the degree of similarity of such content with the content that is forwarded by another node. At the same time, in accordance with principle 4, to determine the degree of similarity of forwarded images, audio and video materials, it is advisable to use tools based on comparing the hash codes of the original and forwarded content, which is explained by high efficiency, low resource intensity and availability of tools for developing such tools. To determine the similarity of the base and forwarded text message, in accordance with principle 3, it is proposed to use available text information processing systems, for example, ChatGPT.
It should be noted that the use of expression (18) is explained by the need to reduce the possible values of M 3 to the range [0,1], which simplifies the analysis of the visual interpretation of the evaluation of the nodes of the social network, and also provides the possibility of further use of this metric for calculating the integral metric M 4 . Also, when calculating (2-5, 8, 12, 17), the possibility of limiting the analyzed data presentation formats should be taken into account. For example, in the case of limiting the data presentation formats in the form of text and a picture Tp =2. In this case, messages and comments presented only in the form of text and a picture should be taken into account.
It is proposed to determine the metrics M4, M 5 based on the integration of metrics M 1 — M 3 using an expression of the following type:
M 4 — CC m 4 ,M 2 M 2 + а М4,М3 M 3
M 5 — а М 5 , M 1 M 1 + а М5,М2 M 2 + а М 5 ,M3 M 3
where а М4,щ is the weight coefficient of the metric Mi when calculating the aggregate metric M 4 ; а^щ is the weight coefficient of the metric M i when calculating the aggregate metric M 5 .
Using the results, taking into account that а М4,М2 + а М4,Мз — 1 а а мМ1 + а ММ2 + а ММ3 — 1, the following is proposed in the basic version:
а М4,М2 — 0,6, а М4,М3 — 0,4.
а М5,М 1 — 0,3, а М 5 М2 — 0,4, а М 5 ,М3 — 0,3.
Such values of weight coefficients are due to the emphasis on identifying criminally significant nodes of the social network. In case of shifting the emphasis to preventing the dissemination of criminal content, the values of weight coefficients should be adjusted.
It should be emphasized that the metric M4 (the index of criminal influence of the node) is intended to assess the influence of the node from the standpoint of the criminal orientation of its content and the level of emission of criminal content from this node, which is of interest to analysts in the field of security and law enforcement agencies. The metric M5 (complex index of thematic and criminal influence of the node) is more generalized due to the consideration of the main topic and can be used to analyze the influence of the social network node on the audience in the context of both general and criminal content.
Taking into account the specifics of calculating the proposed metrics for assessing the influence of the j-th node of the social network disseminating criminal content, the components of expression (1) can be detailed as follows:
(Node) — ((ident),(mes),(com),(mes iink ),(ident iink )) (21)
(Inf) — (M i ,M 2 ,M 3 ,M 4 ,M3) (22)
where (ident) is a tuple of parameters that identify the j-th node of the social network, (mes),(com) are tuples of parameters of messages and comments of the j-th node of the social network, (ident iink) is a tuple of parameters that identify the nodes of the social network associated with the j-th node of the social network, (mes iink) is a tuple of parameters of messages of the nodes of the social network associated with the j-th node of the social network.
In this case, the operator — , which is used to describe the process of transforming (Node) into (Inf), specified by expressions (21,22), assumes the execution of operations specified by expressions (2-20).
Based on the proposed conceptual model for determining the level of influence of social network nodes distributing criminal content, it was determined that in the general case, the analytical model of the method for assessing the influence of nodes distributing criminal content can be specified using expression (23), obtained by substituting the right-hand sides of expressions (21, 22).
Df
((ident), (mes), (com), (mes Link) , (ident Link)) — MM 2 , M 3 , M 4 , M s) (23)
In the practical implementation, content analysis is carried out in three stages. Thematic classification of messages is performed through semantic matching with predefined categories of criminal discourse based on keyword patterns and expert-defined criteria. Emotional tone is identified using lexicon-based methods that detect the presence and intensity of emotion-related expressions. The degree of support for unlawful content is assessed using structured prompts submitted to a large language model, enabling the quantitative assignment of metric μ. The resulting values are automatically associated with each message and comment, serving as the foundation for subsequent aggregation into influence metrics.
Thus, as a result of the conducted research, a conceptual model was constructed, which, due to the proposed principles, made it possible to form metrics for assessing influence, taking into account the semantic and emotional component of the heterogeneous content of the node, the emission of messages of criminal content from the assessed node, and also due to determining the feasibility of analyzing the text content of the node using available systems of intelligent processing of text information and comparison of graphic and audio messages based on comparison of hash codes, provides the possibility of developing an effective method for assessing the influence of social network nodes distributing criminal content.
5. Discussion and Experimental Verification of Algorithm for Assessing the influence of Social Network Nodes Distributing Criminal Content
The next stage of the research corresponds to the second stage of the proposed method and is associated with determining the values of basic metrics for the semantic content of messages and comments of social network nodes. Queries were formed based on the proposed model for forming queries to assess the semantic content of messages and comments of social network nodes. The accuracy of determining the metrics is dictated by the capabilities of modern tools for analyzing the semantic content and emotional coloring of text messages.
To evaluate the effectiveness of the proposed algorithm for assessing the influence of social network nodes engaged in the dissemination of criminal content, a comprehensive experimental study was conducted using both publicly available and custom-designed datasets. As an initial validation step, the algorithm was applied to the publicly accessible dataset "How ISIS Uses Twitter," which comprises user profiles and tweet histories associated with ISIS-related online activity. This stage was aimed at verifying the algorithm’s capability to accurately identify influential actors involved in the propagation of extremist narratives. The experimental results confirmed the algorithm's effectiveness in detecting the top five most influential users within the network. These users were characterized by a high semantic correlation with predefined criminal content categories and exhibited structural prominence within the network topology, consistent with influence-related metrics. Aggregated influence metrics and main thematic focus of social network nodes disseminating criminal content are presented in Table 5.
Table 5. Aggregated metrics and themes of influential criminal nodes
|
Node |
Primary thematic focus of the node |
M1 |
M2 |
M3 |
M4 |
M5 |
|
RamiAlLolah |
Military operations and security |
0,75 |
0,16 |
0,70 |
0,29 |
0,46 |
|
mobi_ayubi |
Dissemination of criminal content |
0,67 |
0,23 |
0,60 |
0,34 |
0,44 |
|
Nidalgazaui |
Military operations and security |
0,60 |
0,26 |
0,50 |
0,36 |
0,43 |
|
Uncle_SamCoco |
Military operations and security |
0,72 |
0,15 |
0,50 |
0,29 |
0,43 |
|
WarReporter1 |
Military operations and security and dissemination of criminal content |
0,66 |
0,15 |
0,50 |
0,29 |
0,41 |
Table 6. Values of basic metrics of semantic content of messages and comments of a social network node
|
Main topic of the text |
Basic metric |
||||||||||
|
M l |
M 2 |
М з |
M 4 |
M s |
М б |
М 7 |
М в |
М ч |
М10 |
М11 |
|
|
Israel-Palestine conflict |
0,7 |
0,8 |
0,9 |
0,8 |
0,1 |
0,7 |
0,2 |
0,6 |
0,1 |
0,5 |
0,3 |
|
Attitude towards the leader |
0,7 |
0,2 |
0,1 |
0,3 |
0,1 |
0,2 |
0,3 |
0,1 |
0,2 |
0,1 |
0 |
|
Domestic violence |
0,9 |
0,8 |
0 |
0,2 |
0 |
0,7 |
0,6 |
0,4 |
0,3 |
0,5 |
0,1 |
|
Religion |
0,8 |
0,9 |
0,8 |
0,7 |
0 |
0 |
0,7 |
0,8 |
0 |
0,9 |
0,5 |
|
Men's problems |
0,7 |
0,8 |
0,2 |
0,7 |
0,1 |
0,3 |
0,2 |
0,3 |
0,2 |
0,4 |
0,5 |
|
Religious hostility |
0,7 |
0,3 |
0,2 |
0,3 |
0,1 |
0,4 |
0,3 |
0,3 |
0,1 |
0,3 |
0,5 |
Subsequently, the algorithm was tested on a proprietary test dataset containing messages and comments retrieved from nodes suspected of distributing radical or extremist content. This phase of the study focused primarily on evaluating the algorithm’s performance when influence assessment relied exclusively on semantic-level features, including emotional intensity, topical relevance, and potential for content amplification. The application of the method to this dataset allowed for the extraction of meaningful semantic metrics, which served as a basis for ranking and identifying nodes with the highest likelihood of contributing to the spread of criminal content. The results of determining the values of basic metrics are fragmentarily shown in Table 6.
Determining the values of a set of basic metrics allowed us to calculate the values of aggregated metrics for assessing influence for each of the social network nodes under study.
The results of ranking influential nodes in accordance with the values of metrics M2 - M5 are shown in Table 7. The obtained ratings can be used to identify the most significant nodes from the positions of:
-
• The degree of criminality of the node content - metric M2.
-
• Identifying the source of distribution of criminal content in the social network - M3.
-
• The integral influence of the node distributing criminal content - metric M4.
-
• Identifying topics that are related to the distribution of criminal content - metric M5.
Table 7. Influence rating of social network nodes distributing criminal content
|
Place in the ranking |
Aggregated metric used in ranking |
|||
|
M 2 |
M 3 |
M 4 |
M 5 |
|
|
1 |
N1 |
N1, N3 |
N1 |
N3 |
|
2 |
N2, N6 |
N3 |
N1 |
|
|
3 |
N6 |
N6 |
N6 |
|
|
4 |
N3 |
N2 |
N2 |
N2 |
The obtained ratings can be used to identify the most significant nodes from the positions of:
-
• The degree of criminality of the node content - metric M2.
-
• Identification of the source of distribution of criminal content in the social network - metric M3.
-
• The integral influence of the node distributing criminal content - metric M4.
-
• Identification of topics that are related to the distribution of criminal content - metric M5.
Using the obtained values of aggregated metrics, graphs were constructed, the use of which provides the possibility of increasing the interpretability of the results of assessing the influence of social network nodes distributing criminal content. These graphs are shown in Fig. 2-4.
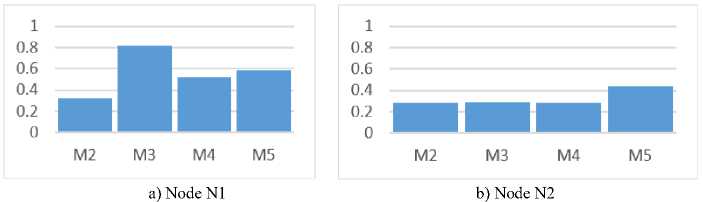
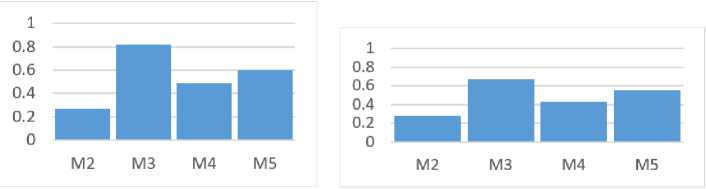
c) Node N3 d) Node N6
Fig.2. Metrics distribution diagrams by nodes
At the same time, Fig. 2 and Fig. 3 show diagrams illustrating the values of aggregated metrics for each of the studied nodes, which is a source of information for forming influence ratings and provides visualization of the differences between nodes.
Figure 4 shows a display of nodes in a two-dimensional space of their aggregated metrics, which allows one to visually assess the influence of each of the nodes under study.
It should be noted that, using the obtained set of values of basic and aggregated metrics of the catch of social networks distributing criminal content, it is possible to construct a number of other graphs, the parameters of which will depend on the characteristics of the task of assessing their influence.
Despite the limited availability of open-access datasets that simultaneously provide both textual content and explicit identification of key actors within criminal networks, this study employs a twofold empirical validation strategy. First, controlled experiments were conducted using publicly available datasets such as How ISIS Uses Twitter, the 9/11
Hijackers Network, and the Caviar Gang Network, which provide structural and operational representations of documented criminal organizations. Second, a real-world dataset was developed through the collection and analysis of user-generated content obtained from the VKontakte social network. This dataset includes posts, comments, and group interactions over a specified time frame and was used to assess the practical applicability of the proposed method. All user identifiers were fully anonymized, and no personally identifiable information was stored or disclosed, ensuring full compliance with ethical standards and data privacy protocols.
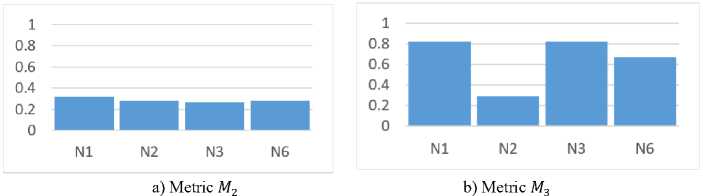
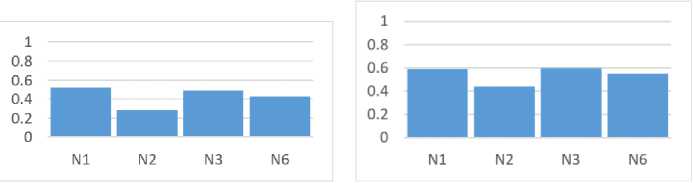
c) Metric M 4 d) Metric Ms
Fig.3. Node metrics charts
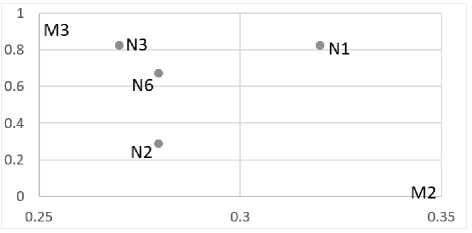
Fig.4. Displaying nodes in a two-dimensional metric space M2 , M 3 .
In contrast to conventional centrality-based approaches such as Degree, Betweenness and Closeness, the proposed method integrates not only topological properties of the network but also semantic, emotional, and behavioral indicators derived from content analysis. By incorporating topic relevance, sentiment intensity, and content emission dynamics, the model enables the identification of influential nodes that may not be structurally central yet play a pivotal role in the dissemination of criminal information. This hybrid approach offers a more comprehensive framework for influence assessment in online criminal ecosystems by capturing both explicit and latent forms of influence. A comparative analysis of these results with the results of the analysis of social network nodes carried out using common statistical approaches indicate the possibility of using the proposed method to expand the functionality of the means of assessing the influence of social network nodes, which confirms the effectiveness of research solutions.
6. Limitations
Although the proposed method demonstrates stable performance across structural, semantic, and behavioral dimensions, it is not without limitations. One of the primary constraints is the increased computational complexity associated with the approach. In contrast to traditional centrality-based methods, the framework requires the extraction and analysis of multiple user-level indicators, including semantic relevance, sentiment intensity, and behavioral activity patterns. This leads to greater computational demands and longer processing times, particularly when applied to large-scale network data. Nevertheless, this complexity contributes to a more accurate and context-aware identification of influential actors, which is essential for practical applications such as threat detection, actor prioritization, and early intervention within online criminal ecosystems.
7. Conclusions
An algorithm for identifying nodes responsible for the dissemination of criminal information in social networks has been developed and validated. The proposed conceptual model incorporates influence assessment metrics that account for the semantic, emotional, and behavioral characteristics of heterogeneous user content, as well as the emission dynamics of criminal messages. The method demonstrates strong performance in detecting influential nodes that may not exhibit structural centrality but play a key role in the propagation of unlawful content. Experimental verification confirmed the effectiveness of the approach using both public and real-world datasets. Notably, the integration of contentbased features into network analysis significantly improves the accuracy of influence detection. The findings have direct implications for real-world applications. Law enforcement agencies and cybersecurity professionals can utilize the method as a decision-support tool for monitoring high-risk users, prioritizing intervention strategies, and disrupting online criminal influence networks. The algorithm is particularly suited for early detection tasks in dynamic information environments where semantic and emotional cues are critical. Future work will focus on enhancing the model’s adaptability to different network structures and content modalities, enabling real-time scalability, and expanding its application to multilingual and cross-platform settings. Further integration with operational intelligence systems may also facilitate automated detection pipelines for digital forensics and threat response.
Acknowledgement
The authors would like to express their gratitude to the editors and reviewers for their detailed review and insightful advice.
